Review
. 2022 Mar 1:12:808451.
doi: 10.3389/fphys.2021.808451. eCollection 2021.

Photoplethysmogram Analysis and Applications: An Integrative Review

Affiliations
Review

Photoplethysmogram Analysis and Applications: An Integrative Review

Junyung Park et al. Front Physiol. .

Abstract

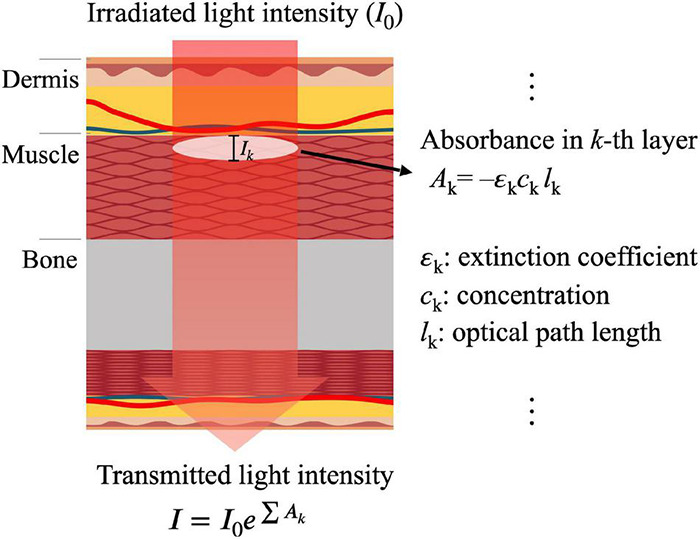
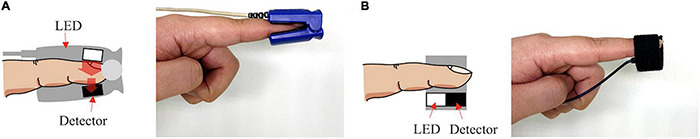
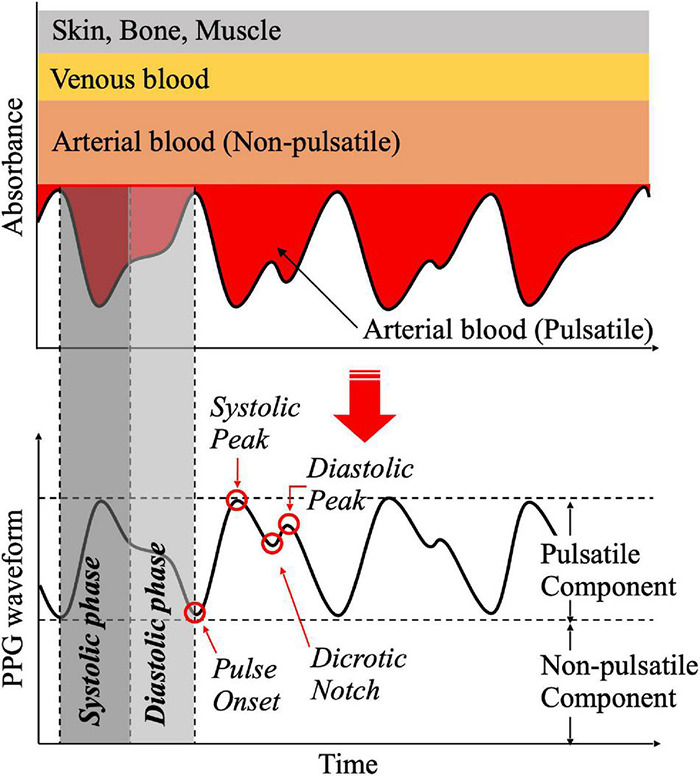
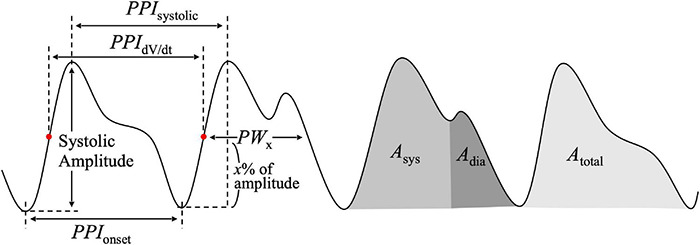
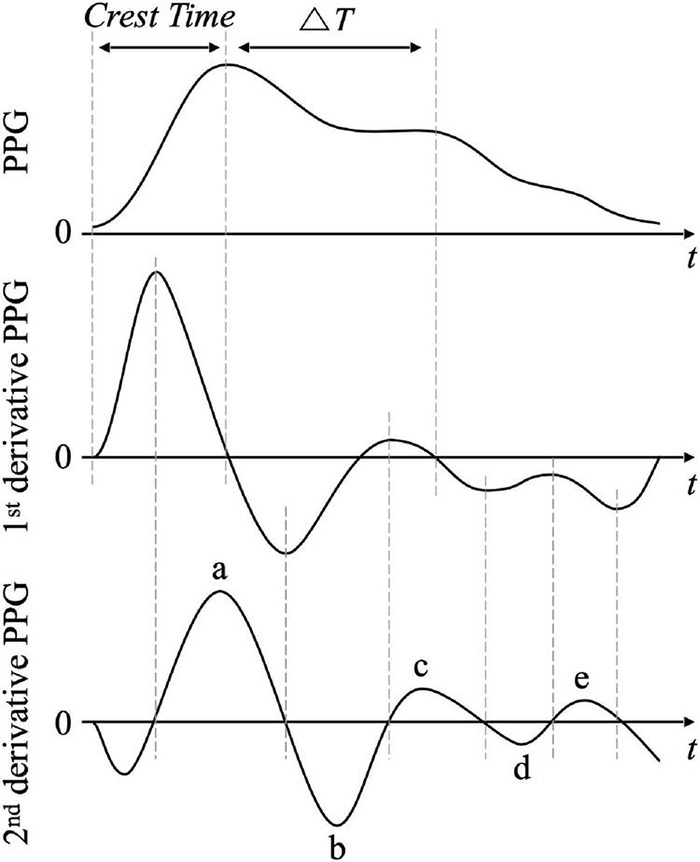
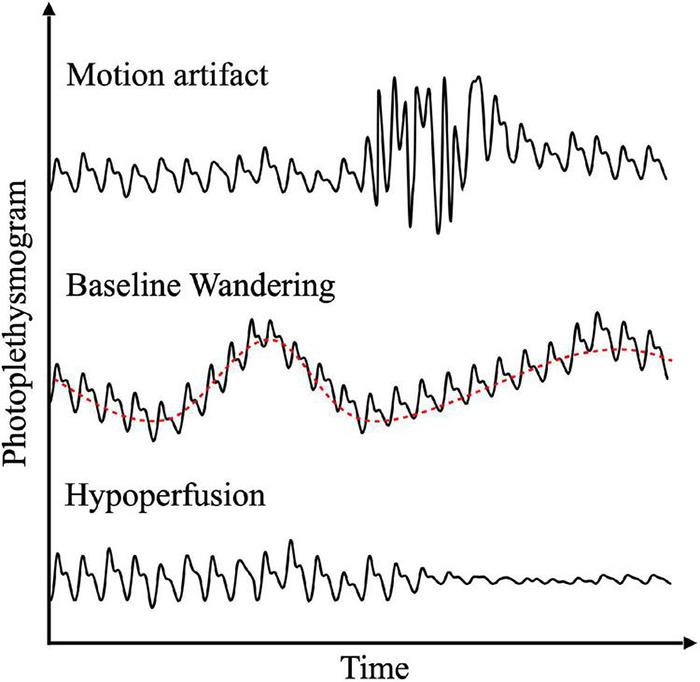
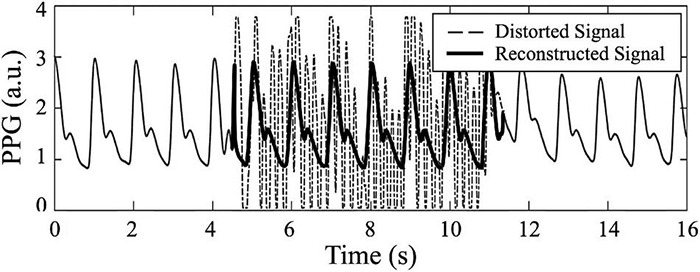
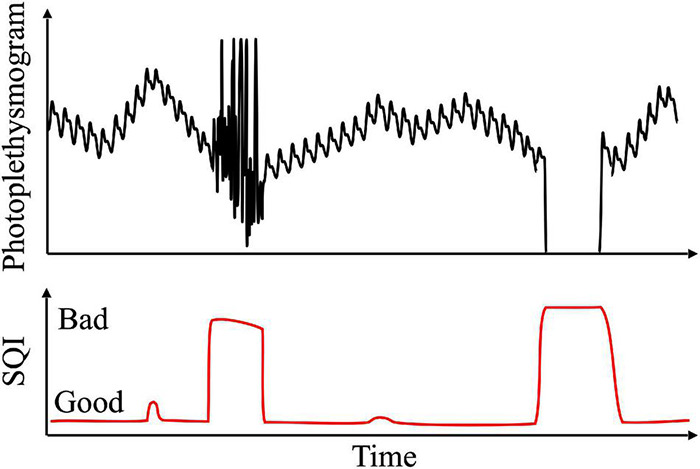
Beyond its use in a clinical environment, photoplethysmogram (PPG) is increasingly used for measuring the physiological state of an individual in daily life. This review aims to examine existing research on photoplethysmogram concerning its generation mechanisms, measurement principles, clinical applications, noise definition, pre-processing techniques, feature detection techniques, and post-processing techniques for photoplethysmogram processing, especially from an engineering point of view. We performed an extensive search with the PubMed, Google Scholar, Institute of Electrical and Electronics Engineers (IEEE), ScienceDirect, and Web of Science databases. Exclusion conditions did not include the year of publication, but articles not published in English were excluded. Based on 118 articles, we identified four main topics of enabling PPG: (A) PPG waveform, (B) PPG features and clinical applications including basic features based on the original PPG waveform, combined features of PPG, and derivative features of PPG, (C) PPG noise including motion artifact baseline wandering and hypoperfusion, and (D) PPG signal processing including PPG preprocessing, PPG peak detection, and signal quality index. The application field of photoplethysmogram has been extending from the clinical to the mobile environment. Although there is no standardized pre-processing pipeline for PPG signal processing, as PPG data are acquired and accumulated in various ways, the recently proposed machine learning-based method is expected to offer a promising solution.

Keywords: bio-signal processing; motion artifacts; noise reduction; photoplethysmography; physiological measurement; physiological signal; signal quality assessment.


Conflict of interest statement

The authors declare that the research was conducted in the absence of any commercial or financial relationships that could be construed as a potential conflict of interest.

Figures

FIGURE 1
FIGURE 1
Light intensity change represented with the Beer–Lambert law in photoplethysmogram measurement, where Ak, εk, ck, and lk are the k-th layer absorbance, extinction coefficient, concentration, and optical path length, respectively.
FIGURE 2
FIGURE 2
Configuration for photoplethysmography measurement: (A) transmissive type and (B) reflective type.
FIGURE 3
FIGURE 3
Principle of phototoplethysmogram generation and waveform features.
FIGURE 4
FIGURE 4
Features of the photoplethysmogram waveform. PPIsystolic, interval between systolic peaks of adjacent pulse; PPIdV/dt, interval between maximum dV/dt of adjacent pulse; PPIonset, interval between pulse onsets of adjacent pulse; PWx, pulse width at x% of systolic amplitude; Asys, systolic area; Adia, diastolic area; Atotal, total pulse area.
FIGURE 5
FIGURE 5
Waveform and features of photoplethysmogram (PPG, top), derivative PPG (middle), and second derivative PPG (bottom). Crest time is the elapsed time from pulse onset to systolic peak. ΔT is the time interval between systolic peak and diastolic peak that is defined by the second downward zero-crossing time in derivative PPG. In the second derivative PPG, a, b, c, d, and e are the early systolic positive peak, early systolic negative peak, late systolic re-increasing peak, late systolic re-decreasing peak, and early diastolic positive peak, respectively.
FIGURE 6
FIGURE 6
Examples of representative PPG distortion due to motion artifact, baseline wandering, and hypoperfusion (from top to bottom).
FIGURE 7
FIGURE 7
Example of PPG waveform reconstruction. Dashed line is distorted PPG, while bold line is reconstructed PPG.
FIGURE 8
FIGURE 8
Example of signal quality assessment using signal quality index (SQI).

References

    1. Adler J. N., Hughes L. A., Vtvilecchia R., Camargo A. C., Jr. (1998). Effect of skin pigmentation on pulse oximetry accuracy in the emergency department. Acad. Emergency Med. 5 965–970. 10.1111/j.1553-2712.1998.tb02772.x - DOI - PubMed
    1. Ahonen J., Jokela R., Uutela K., Huiku M. (2007). Surgical stress index reflects surgical stress in gynaecological laparoscopic day-case surgery. Br. J. Anaesthesia 98 456–461. 10.1093/bja/aem035 - DOI - PubMed
    1. Aiba Y., Ohshiba S., Horiguchi S. I., Morioka I., Miyashita K., Kiyota I., et al. (1999). Peripheral hemodynamics evaluated by acceleration plethysmography in workers exposed to lead. Industrial Health 37 3–8. 10.2486/indhealth.37.3 - DOI - PubMed
    1. Alian A. A., Shelley K. H. (2014). Photoplethysmography. Best Pract. Res. Clin. Anaesthesiol. 28 395–406. - PubMed
    1. Allen J. (2007). Photoplethysmography and its application in clinical physiological measurement. Physiol. Meas. 28:R1. 10.1088/0967-3334/28/3/R01 - DOI - PubMed