. 2022 Jul;163(1):270-284.
doi: 10.1053/j.gastro.2022.03.010. Epub 2022 Mar 15.

Regulation of PGC1α Downstream of the Insulin Signaling Pathway Plays a Role in the Hepatic Proteotoxicity of Mutant α1-Antitrypsin Deficiency Variant Z

Affiliations

Regulation of PGC1α Downstream of the Insulin Signaling Pathway Plays a Role in the Hepatic Proteotoxicity of Mutant α1-Antitrypsin Deficiency Variant Z

David A Rudnick et al. Gastroenterology. 2022 Jul.

Abstract

Background & aims: Insulin signaling is known to regulate essential proteostasis mechanisms.

Methods: The analyses here examined effects of insulin signaling in the PiZ mouse model of α1-antitrypsin deficiency in which hepatocellular accumulation and proteotoxicity of the misfolded α1-antitrypsin Z variant (ATZ) causes liver fibrosis and cancer.

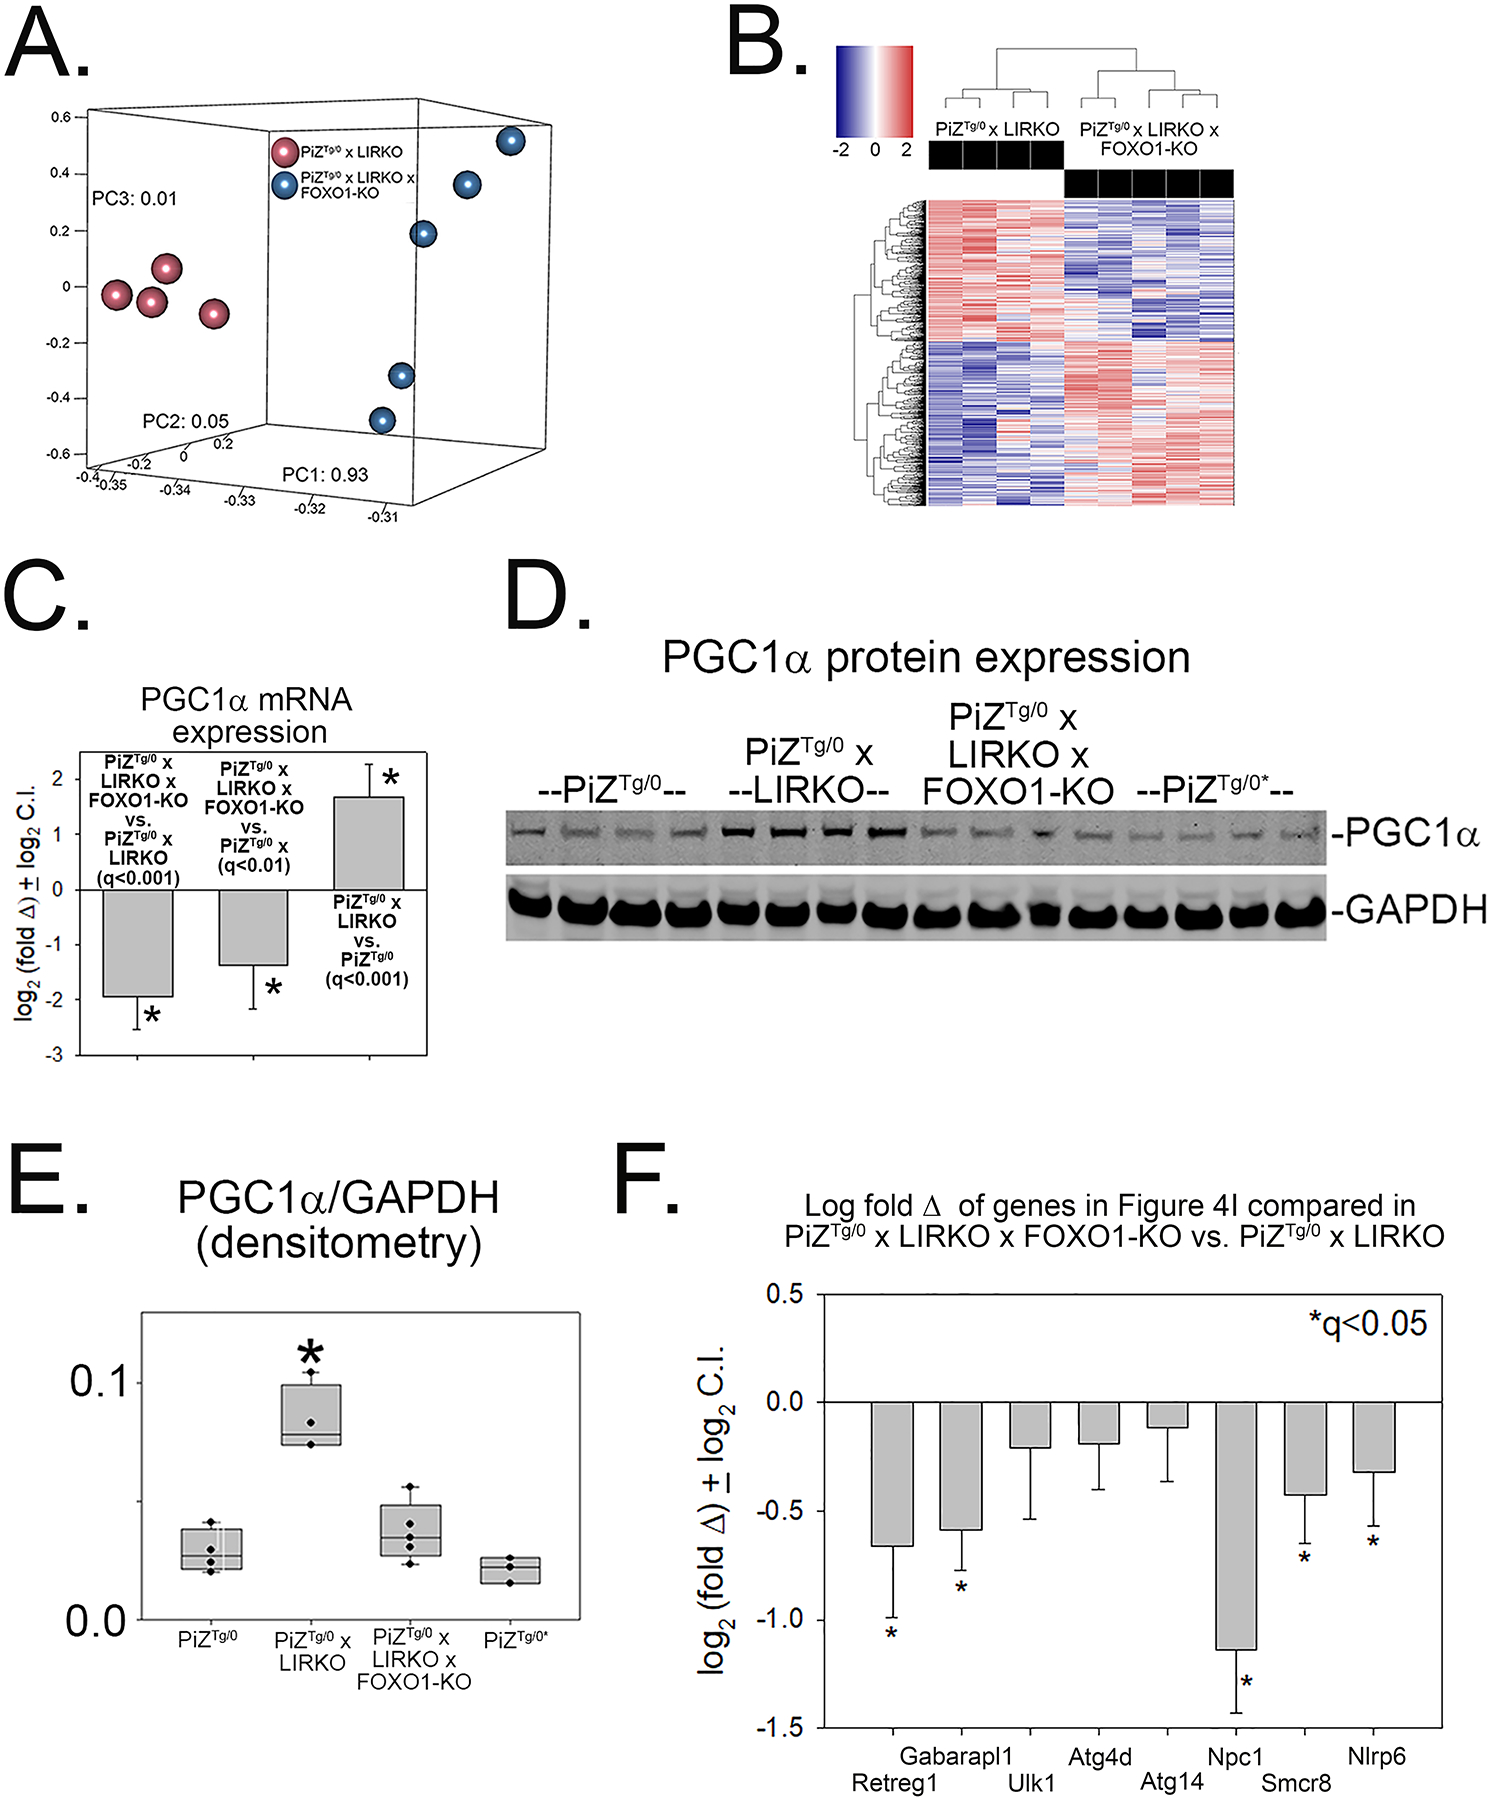
Results: We first studied the effects of breeding PiZ mice to liver-insulin-receptor knockout (LIRKO) mice (with hepatocyte-specific insulin-receptor gene disruption). The results showed decreased hepatic ATZ accumulation and liver fibrosis in PiZ x LIRKO vs PiZ mice, with reversal of those effects when we bred PiZ x LIRKO mice onto a FOXO1-deficient background. Increased intracellular degradation of ATZ mediated by autophagy was identified as the likely mechanism for diminished hepatic proteotoxicity in PiZ x LIRKO mice and the converse was responsible for enhanced toxicity in PiZ x LIRKO x FOXO1-KO animals. Transcriptomic studies showed major effects on oxidative phosphorylation and autophagy genes, and significant induction of peroxisome proliferator-activated-receptor-γ-coactivator-1α (PGC1α) expression in PiZ-LIRKO mice. Because PGC1α plays a key role in oxidative phosphorylation, we further investigated its effects on ATZ proteostasis in our ATZ-expressing mammalian cell model. The results showed PGC1α overexpression or activation enhances autophagic ATZ degradation.

Conclusions: These data implicate suppression of autophagic ATZ degradation by down-regulation of PGC1α as one mechanism by which insulin signaling exacerbates hepatic proteotoxicity in PiZ mice, and identify PGC1α as a novel target for development of new human α1-antitrypsin deficiency liver disease therapies.

Keywords: Autophagy; Liver Disease; Liver Fibrosis; Oxidative Phosphorylation; Proteostasis.


Conflict of interest statement

Disclosures: The authors declare no conflicts of interest exist.

Figures

Figure 1:
Figure 1:. Liver-specific disruption of insulin receptor expression reduces hepatic ATZ accumulation and liver disease in PiZTg/Tg mice.
(A) PAS/diastase staining of liver (scale bar in lower left; boxes define adjacent magnified images); (B) histomorphometric quantification of n=3 PiZTg/Tg and n=5 PiZTg/Tg x LIRKO mouse replicates (*p=0.03, 2-tailed t-test). (C) ATZ immunoblot (IRβ, insulin receptor β); (D) densitometric quantification (*p<0.001, 2-tailed t-test). (E) Picro-Sirius Red staining; (F) histomorphometric quantification (*p=0.004, 2-tailed t-test). (F) Serum ALT (units/liter; *p=0.002, 2-tailed t-test).
Figure 2:
Figure 2:. Liver-specific disruption of insulin receptor expression accelerates hepatocellular ATZ degradation and increases hepatic autophagic flux.
Pulse chase analysis of ATZ degradation in PiZTg/0 vs. PiZTg/0 x LIRKO mouse hepatocytes (from n=3 mice per group): (A) representative autoradiographs; (B) densitometric quantification of replicates (by ‘area-under-the-curve’ (AUC) calculations; for intracellular (IC) AUC PiZTg/0=100±13%, AUC PiZTg/0 x LIRKO 74±7%, *p<0.05, 1-tailed-t-test on AUC calculations; extracellular (EC) AUC PiZTg/0=100±15, AUC PiZTg/0 x LIRKO=84±31%, not significant (ns)). (C, D, E) Immunoblot and densitometric quantification of steady-state LC3-I and II and p62 in PiZTg/Tg and PiZTg/Tg x LIRKO mouse livers (*p=0.02, 2-tailed t-test). (F, G, H) Immunoblot and densitometric quantification of autophagy proteins in livers from vehicle (Veh)- or leupeptin (Leu)-treated PiZTg/Tg x LIRKO mice (*p=0.04 and **p=0.01, 1-tailed t-test). (I) The effect of bafilomycin on ATZ degradation in PiZTg/0 x LIRKO mice (assessed as in (B), with *p=0.02 for Bafilomycin- vs. Vehicle-treated, and *p=0.2 for Bafilomycin-treated vs. PiZTg/0 from panel B-IC, each compared by 1-tailed t-test, n=3 mice/group). J. Effect of Lys05 vs. vehicle on steady-state ATZ levels in PiZ x LIRKO mice (n=4–5 mice/group, *p=0.04 by 1-tailed t-test).
Figure 3:
Figure 3:. Liver-specific FOXO1 disruption increases ATZ accumulation and liver disease in PiZTg/0 x LIRKO mice.
(A) PAS/diastase staining of liver (3 mice/group; scale bars in lower left, boxes define adjacent higher-magnification images). (B) Histomorphometric quantification of PAS/diastase staining (ANOVA p<0.001, 2-tailed-t-test; pairwise comparisons shown). (C) ATZ immunoblot and (D) densitometric quantification (ANOVA *p=0.01, 2-tailed-t-test; pairwise comparisons shown). (E) Picro-Sirius Red staining and (F) histomorphometric quantification (ANOVA p<0.001, 2-tailed-t-test; pairwise comparisons shown). Pulse chase analysis of ATZ degradation including (G) representative autoradiographs and (H) densitometric quantification of replicates (3 mice/group; Figure 2 data reproduced here for comparison; see text for details; *IC p=0.013 for intracellular AUC, by 1-tailed-t-test).
Figure 4:
Figure 4:. Disrupting hepatocellular insulin signaling induces the expression of metabolic genes, including PGC1α, ER-phagy and other autophagy genes in PiZTg/Tg mouse liver.
(A) Principle component, (B) heat map, and (C) Venn diagram analyses comparing patterns of differential gene expression between PiZTg/Tg, PiZTg/Tg x LIRKO, wildtype (WT) and LIRKO mouse transcriptomes (n=3–7 mice/group). (D) PGC1α mRNA expression in PiZ vs. WT and PiZ x LIRKO vs. PiZ (by RNA-Seq, *q values as shown)). (E) PGC1α western blot and (F) densitometry in PiZ vs. PiZ x LIRKO (*p<0.05, 2-tailed-t-test). (G) Venn diagram summarizing ER-phagy genes induced in PiZTg/Tg x LIRKO vs. PiZTg/Tg or suppressed in PiZTg/Tg vs. WT. (H) Venn diagram analysis of and (I) graphical summary comparing RNA-Seq data (*q<0.05) of genes induced in PiZTg/Tg x LIRKO vs. PiZ or suppressed in PiZTg/Tg vs. WT to autophagy genes.
Figure 5:
Figure 5:. Disrupting hepatocellular FOXO1-expression reverses many hepatic transcriptional effects of liver-specific insulin receptor disruption in PiZ mouse liver.
(A) Principle component and (B) heat map analyses comparing patterns of differential hepatic gene expression between PiZTg/0 x LIRKO and PiZTg/0 x LIRKO x FOXO1-KO mice (n=5–6 mice/group). (C) PGC1α mRNA (by RNA-Seq, *q values as shown) and (D, E) protein expression and quantification (*p<0.001 by ANOVA). (F) Effects of liver-specific FOXO1 disruption on hepatic expression of autophagy genes in Figure 4I. (*q<0.05).
Figure 6:
Figure 6:. PGC1α activity causes an autophagy-dependent reduction in ATZ accumulation in HTO/Z cells.
Effects of “low” or “high” dose PGC1α- vs. control-expression vector (see Supplementary Materials and Supplementary Figure 8) in (A-C) HTO/Z vs. (D-F) HTO/Z-STX17-KO cells on ATZ accumulation (by immunoblot densitometry) and PGC1α mRNA expression (by RT-qPCR), and of high dose PGC1α- vs. control-expression vector on (G-I) autophagic flux, by lysosomal inhibition-induced changes in LC3-II/(LC3-I + LC3-II). (J-L) Effects of ZLN005 vs. vehicle on ATZ accumulation and PGC1α expression. ((B) p<0.001, ANOVA; *p<0.01 vs. corresponding controls, 2-tailed-t-test; (C) p=0.02, ANOVA; (E) no significant difference, ANOVA; (F) p=0.025, ANOVA; (H) p<0.001, ANOVA; relevant significant pairwise comparisons as indicated in panels; (I) no significant difference (ns), ANOVA; (K) *p=0.03, 1 tailed-t-test; (L) p=0.001, 1 tailed-t-test.))

Comment in

References

    1. Rudnick DA, Perlmutter DH. Alpha-1-Antitrypsin Deficiency. In: Arias HJA Irwin M., Boyer James L., Cohen David E., Thorgeirsson Snorri, Shafritz David A., Wolkoff Allan W., ed. The Liver: Biology and Pathobiology. 6th ed: Wiley-Blackwell, 2020.
    1. Rudnick DA, Perlmutter DH. Alpha1-Antitrypsin Deficiency. In: Suchy RS F, Balistreri W, Bezerra J, Mack C, Shneider B, ed. Liver Disease in Children. 5th ed: Cambridge University Press, 2021:417–436.
    1. Carlson JA, Rogers BB, Sifers RN, et al. Accumulation of PiZ alpha 1-antitrypsin causes liver damage in transgenic mice. J Clin Invest 1989;83:1183–90. - PMC - PubMed
    1. Rudnick DA, Perlmutter DH. Alpha-1-antitrypsin deficiency: a new paradigm for hepatocellular carcinoma in genetic liver disease. [Review] [49 refs]. Hepatology 2005;42:514–521. - PubMed
    1. Marcus NY, Brunt EM, Blomenkamp K, et al. Characteristics of hepatocellular carcinoma in a murine model of alpha-1-antitrypsin deficiency. Hepatol Res 2010;40:641–53. - PMC - PubMed

Publication types

MeSH terms

Substances

LinkOut - more resources