. 2022 Mar;10(3):e004384.
doi: 10.1136/jitc-2021-004384.

STAT3 inhibitor Napabucasin abrogates MDSC immunosuppressive capacity and prolongs survival of melanoma-bearing mice

Affiliations

STAT3 inhibitor Napabucasin abrogates MDSC immunosuppressive capacity and prolongs survival of melanoma-bearing mice

Rebekka Bitsch et al. J Immunother Cancer. 2022 Mar.

Abstract

Background: Myeloid-derived suppressor cells (MDSCs) represent a negative prognostic factor in malignant melanoma. These cells are generated under chronic inflammatory conditions typical of cancer. The transcription factor signal transducer and activator of transcription 3 (STAT3) orchestrates MDSC accumulation and acquisition of immunosuppressive properties. Here we studied STAT3 inhibition by Napabucasin as a way to block MDSC accumulation and activity and its potential to treat malignant melanoma.

Methods: In vitro generated murine MDSC and primary MDSC from melanoma-bearing mice were used to investigate the effects of Napabucasin on MDSC in vitro. The RET transgenic mouse model of malignant melanoma was used to examine Napabucasin therapy efficiency and its underlying mechanisms in vivo. Furthermore, STAT3 activation and its correlation with survival were explored in MDSC from 19 patients with malignant melanoma and human in vitro generated monocytic myeloid-derived suppressor cell (M-MDSC) were used to evaluate the effects of Napabucasin.

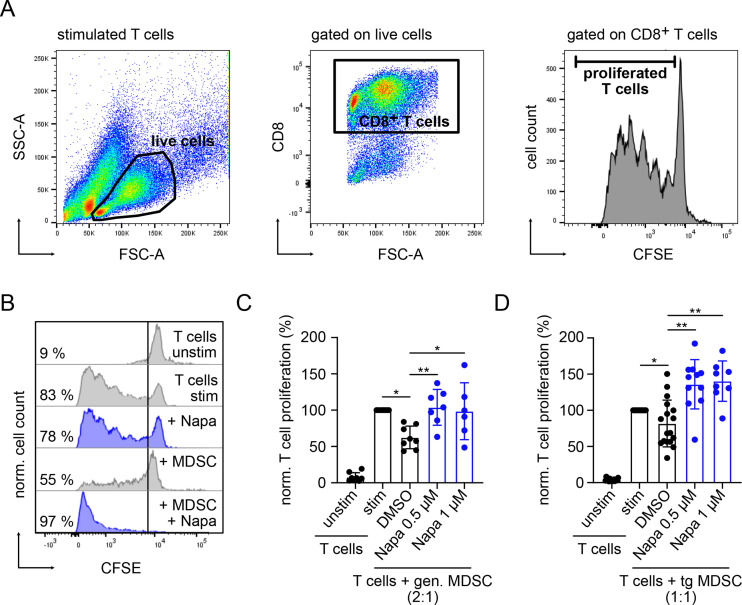
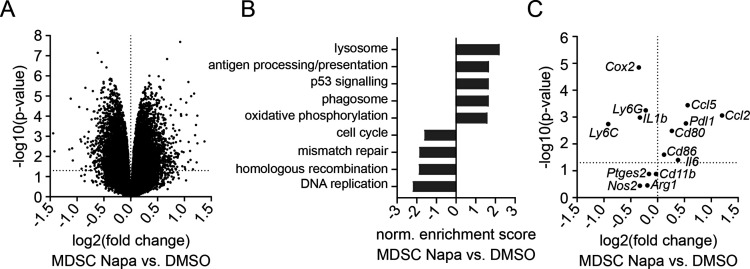
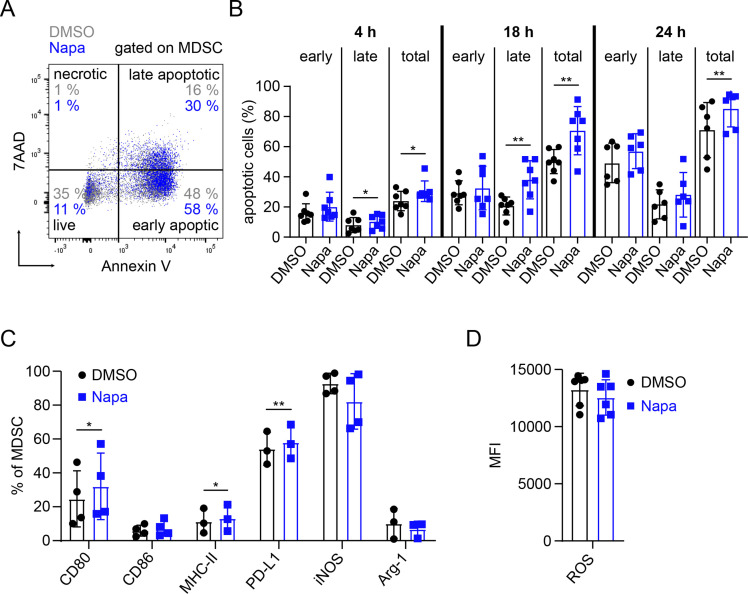
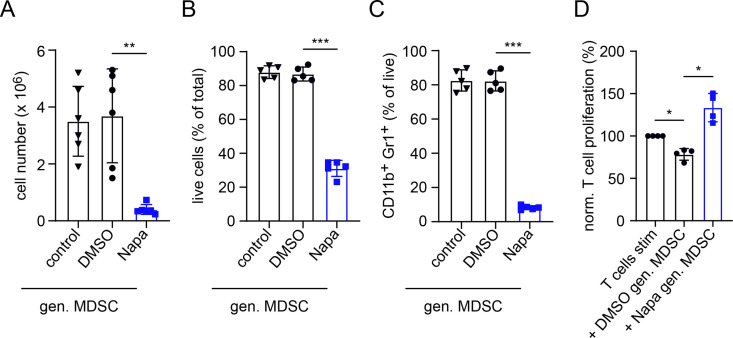
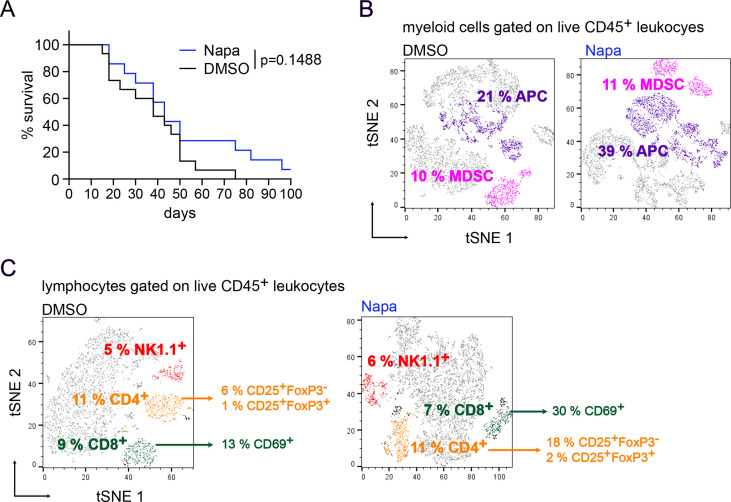
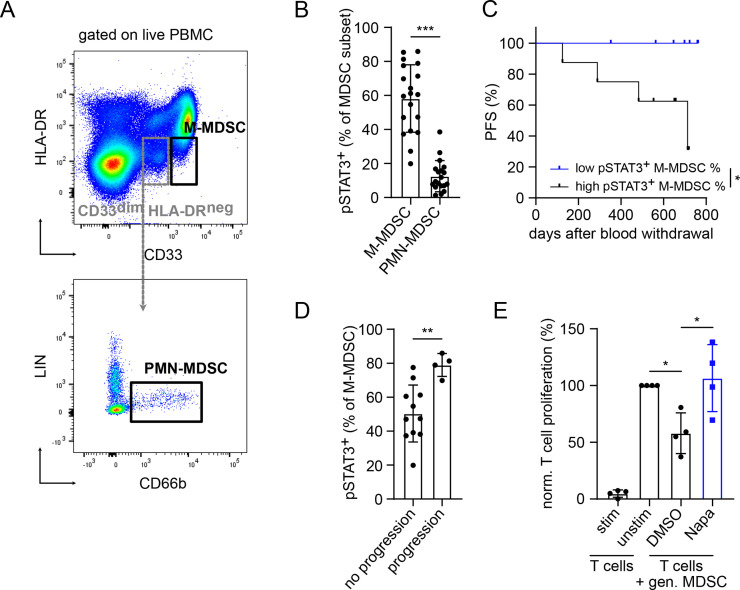
Results: Napabucasin was able to abrogate the capacity of murine MDSC to suppress CD8+ T-cell proliferation. The STAT3 inhibitor induced apoptosis in murine MDSC, significantly increased expression of molecules associated with antigen processing and presentation, as well as slightly decreased expression of immunosuppressive factors on these cells. RET transgenic mice treated with Napabucasin showed prolonged survival accompanied by a strong accumulation of tumor-infiltrating antigen-presenting cells and activation of CD8+ and CD4+ T cells. Interestingly, patients with malignant melanoma with high expression of activated STAT3 in circulating M-MDSC showed significantly worse progression-free survival (PFS) than patients with low levels of activated STAT3. In addition, Napabucasin was able to abrogate suppressive capacity of human in vitro generated M-MDSC.

Conclusion: Our findings demonstrate that STAT3 inhibitor Napabucasin completely abrogated the immunosuppressive capacity of murine MDSC and human M-MDSC and improved melanoma-bearing mouse survival. Moreover, patients with malignant melanoma with high expression levels of activated STAT3 in M-MDSC displayed shorter PFS, indicating its role as a promising therapeutic target in patients with malignant melanoma and a predictive marker for their clinical outcome.

Keywords: immunotherapy; melanoma; myeloid-derived suppressor cells; tumor microenvironment.


Conflict of interest statement

Competing interests: No, there are no competing interests.

Figures

Figure 1
Figure 1
Napabucasin abrogated immunosuppressive capacity of MDSC in vitro. Suppressive capacity of murine MDSC was determined on the coculture with CFSE-labeled murine-activated splenic CD8+ T cells. After 72 hours of incubation, T-cell proliferation was assessed by CFSE dilution measured by flow cytometry. (A) Gating strategy for proliferated T cells. (B) Representative histograms for the proliferation of unstim and stim T cells incubated alone or in the presence of in vitro gen. MDSC with 1 µM Napa or 0.01% DMSO as control. (C) Cumulative data for T-cell proliferation are presented as the percentage of divided T cells norm. to the respective control of stim T cells alone (mean±SD, n=6–7). (D) MDSCs were isolated from the bone marrow of RET TG melanoma-bearing mice (TG MDSC). Cumulative data for T-cell proliferation in the presence or absence of tg MDSC and with or without Napa are shown as the percentage of divided T cells norm. to the respective control of stim T cells alone (mean±SD, n=8–11). Statistics were performed on not norm. data. *P<0.05, **P<0.01. CFSE, carboxyfluorescein succinimidyl ester; gen., generated; MDSC, myeloid-derived suppressor cell; Napa, Napabucasin; norm., normalized; stim, stimulated; tg, transgenic; unstim, unstimulated.
Figure 2
Figure 2
Microarray analysis of Napabucasin-treated MDSC. Whole transcriptome of MDSC generated in vitro and treated for 24 hours with 1 µM Napa or 0.01% DMSO was analyzed by microarray (n=3). (A) Volcano plot with differentially expressed genes. Dotted horizontal line indicates significance threshold (p<0.05). (B) Norm. enrichment score of important significantly regulated pathways found by gene set enrichment analysis pathway analysis using Kyoto Encyclopedia of Genes and Genomes pathways. (C) A plot with selected differentially expressed genes important for MDSC phenotype and function is presented. Dotted horizontal line indicates the significance threshold (p<0.05). MDSC, myeloid-derived suppressor cell; Napa, Napabucasin; norm., normalized.
Figure 3
Figure 3
Napabucasin promoted in vitro apoptosis and alteration of MDSC phenotype. MDSC generated in vitro were treated with 1 µM Napa or 0.01% DMSO. Apoptosis of MDSC and expression of their markers were measured by flow cytometry. (A) Gating strategy for determination of early (annexin V+7AAD) and late apoptotic (annexin V+7AAD+), necrotic (annexin V7AAD+) and live (annexin V7AAD) cells is shown. (B) Results are presented as the percentage of early, late and total apoptotic cells among total MDSC on 4, 18 and 24 hours of incubation with Napa (mean±SD, n=6–7). (C) Data are shown as the percentage of MDSC expressing CD80, CD86, MHC-II, PD-L1, iNOS and Arg-1 within total MDSC on 24 hours of culture with Napa (mean±SD, n=3–4). (D) The level of ROS production by MDSC is presented as MFI (mean±SD, n=6). *P<0.05, **P<0.01. Arg-1, arginase 1; iNOS, inducible nitric oxide synthase; MDSC, myeloid-derived suppressor cell; MFI, median fluorescence intensity; MHC-II, major histocompatibility complex class II; Napa, Napabucasin; PD-L1, programmed death ligand 1; ROS, reactive oxygen species.
Figure 4
Figure 4
Inhibition of MDSC generation in vitro by Napaucasin. MDSCs were generated in vitro with IL-6 and GM-CSF (40 ng/mL each, control). Napa (1 µM) or DMSO (0.01%) was added together with cytokines. (A) Data are shown as cell numbers per plate after 4 days of incubation (n=6). Results are presented as the percentage of live (7AAD) cells within total cells (B) and the percentage of CD11b+Gr1+ cells among total cells (C) measured by flow cytometry (mean±SD, n=5). (D) The function of in vitro generated MDSC was determined on the coculture with CFSE-labeled murine-activated splenic CD8+ T cells. After 72 hours of incubation, T-cell proliferation was evaluated by CFSE dilution measured by flow cytometry. Cumulative data for T-cell proliferation are presented as the percentage of divided T cells norm. to the respective control of stimulated T cells alone (mean±SD, n=4). Statistics were performed on not norm. data. *P<0.05,**P<0.01, ***P<0.001. CFSE, carboxyfluorescein succinimidyl ester; gen., generated; GM-CSF, granulocyte–macrophage colony-stimulating factor; IL, interleukin; MDSC, myeloid-derived suppressor cell; Napa, Napabucasin; norm., normalized.
Figure 5
Figure 5
Effect of Napabucasin in melanoma-bearing mice in vivo. RET transgenic mice with established tumors were injected intraperitoneally with Napa (20 mg/kg) or the corresponding amount of DMSO for 4 weeks, two times per week. (A) Survival of mice is shown as a Kaplan-Meier curve (n=15/group). In another set of experiments, tumor-infiltrating immune cells from Napa-treated (n=2) and DMSO control (n=3) groups were analyzed after 3 weeks of therapy. Results are concatenated, gated on CD45+ live leukocytes and presented as a t-Distributed Stochastic Neighbor Embedding (tSNE) plot. (B) MDSCs were defined as CD11b+Gr1+ cells, whereas APCs were defined as CD11b+Gr1 cells expressing CD11c, CD80, CD86, F4/80 and MHC class II. MDSC and APC frequencies are shown as the percentage among leukocytes. CD11c, CD80, CD86, F4/80 and MHC-II frequencies are shown as the percentage among APCs. (C) Results are presented as the percentage of CD4+ and CD8+ T cells as well as NK1.1+ NK cells within leukocytes. In addition, the percentages of activated CD4+CD25+FoxP3 cells and CD25+FoxP3+ Treg among total CD4+ T cells, as well as activated CD8+CD69+ cells within total CD8+ T cells, are shown. APC, antigen-presenting cell; MDSC, myeloid-derived suppressor cell; MHC-II, major histocompatibility complex class II; Napa, Napabucasin; NK, natural killer; Treg, regulatory T cell.
Figure 6
Figure 6
STAT3 activation in MDSC from patients with melanoma and its inhibition by Napaucasin. PBMC from untreated patients with melanoma (stages I–IV) were analyzed by flow cytometry. (A) Representative dot plots for M-MDSC defined as CD33highHLA-DRlow/neg and PMN-MDSC defined as CD33dim HLA-DRnegCD66b+LIN are presented. (B) Cumulative data are shown as the percentage of pSTAT3+ cells among respective MDSC subsets (mean±SD, n=19). pSTAT3+ MDSC were gated according to isotype control. (C) PFS of patients with high (>58.2%, n=8) and low (<58.2%, n=7) pSTAT3+ M-MDSC frequencies is shown as a Kaplan–Meier curve. Follow-up period was 2 years. (D) Cumulative data are presented as the percentage of pSTAT3+ M-MDSC within total M-MDSC in patients with (n=11) or without (n=4) progression. (E) Human M-MDSCs were generated in vitro for 4 days with IL-6 and GM-CSF followed by coculture with activated CD3+ T cells labeled with cell proliferation dye eFluor 450 in the presence of 0.5 µM Napa or 0.005% DMSO. On 96 hours of incubation, T-cell proliferation was assessed by proliferation dye dilution measured by flow cytometry. Cumulative data for T-cell proliferation are presented as the percentage of divided T cells norm. to the respective control of stimulated T cells alone (mean±SD, n=4). Statistics were performed on not norm. data. *P<0.05, **P<0.01, ***P<0.001. gen., generated; GM-CSF, granulocyte–macrophage colony-stimulating factor; IL, interleukin; MDSC, myeloid-derived suppressor cell; M-MDSC, monocytic myeloid-derived suppressor cell; Napa, Napabucasin; norm., normalized; PFS, progression-free survival; PMN, polymorphonuclear; STAT3, signal transducer and activator of transcription 3.

References

    1. Groth C, Hu X, Weber R, et al. . Immunosuppression mediated by myeloid-derived suppressor cells (MDSCs) during tumour progression. Br J Cancer 2019;120:16–25. 10.1038/s41416-018-0333-1 - DOI - PMC - PubMed
    1. Bronte V, Brandau S, Chen S-H, et al. . Recommendations for myeloid-derived suppressor cell nomenclature and characterization standards. Nat Commun 2016;7:12150. 10.1038/ncomms12150 - DOI - PMC - PubMed
    1. Noman MZ, Desantis G, Janji B, et al. . PD-L1 is a novel direct target of HIF-1α, and its blockade under hypoxia enhanced MDSC-mediated T cell activation. J Exp Med 2014;211:781–90. 10.1084/jem.20131916 - DOI - PMC - PubMed
    1. Corzo CA, Cotter MJ, Cheng P, et al. . Mechanism regulating reactive oxygen species in tumor-induced myeloid-derived suppressor cells. J Immunol 2009;182:5693–701. 10.4049/jimmunol.0900092 - DOI - PMC - PubMed
    1. Rodriguez PC, Quiceno DG, Ochoa AC. L-arginine availability regulates T-lymphocyte cell-cycle progression. Blood 2007;109:1568–73. 10.1182/blood-2006-06-031856 - DOI - PMC - PubMed

Publication types