

Epidemiological cut-off values for a 96-well broth microdilution plate for high-throughput research antibiotic susceptibility testing of M. tuberculosis
- PMID: 35301246
- PMCID: PMC9556810
- DOI: 10.1183/13993003.00239-2022
Epidemiological cut-off values for a 96-well broth microdilution plate for high-throughput research antibiotic susceptibility testing of M. tuberculosis
Abstract
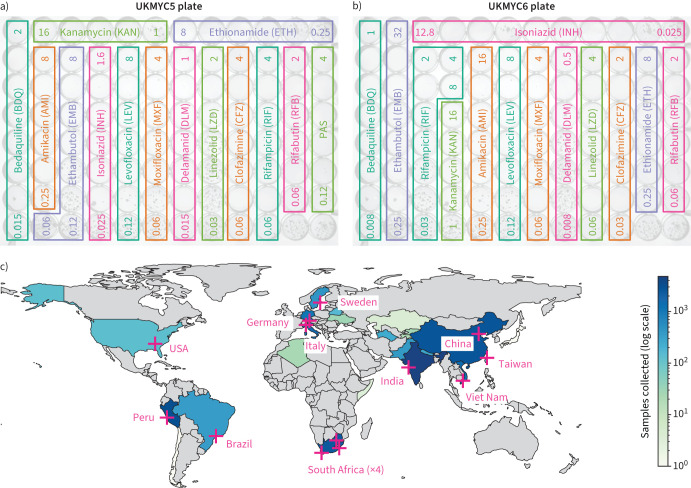
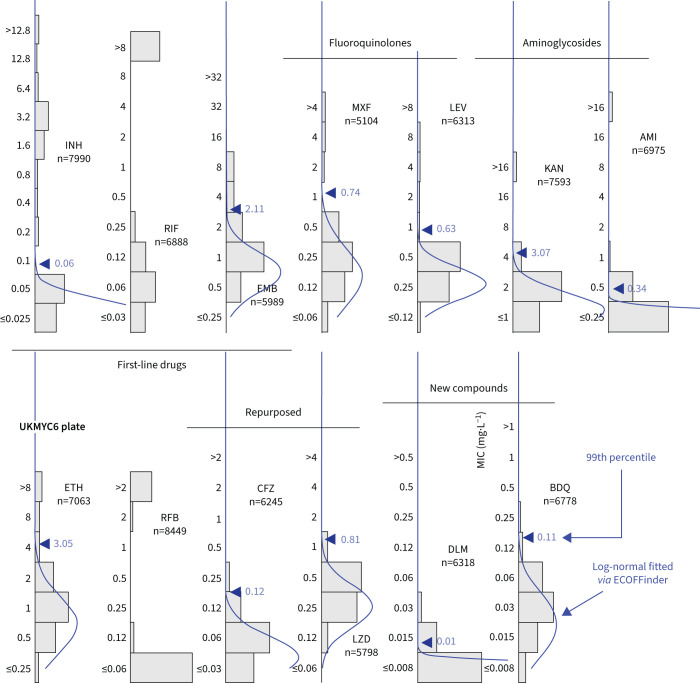
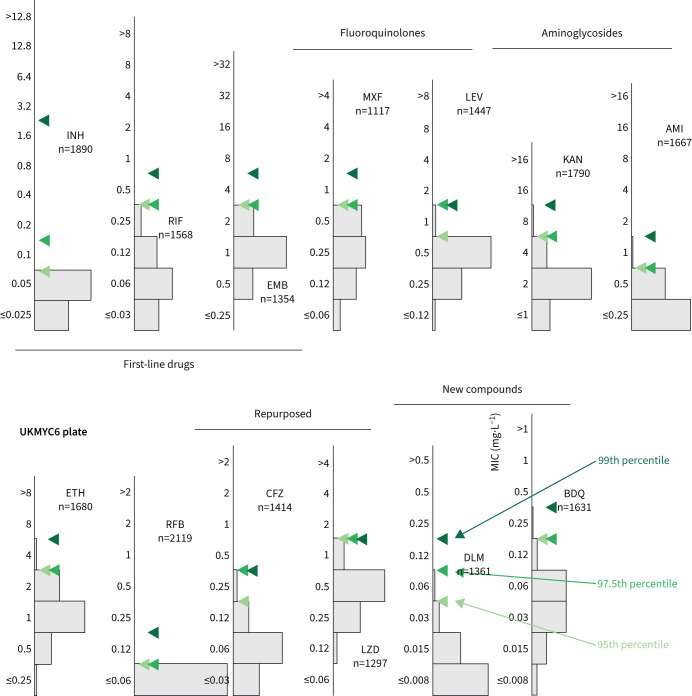
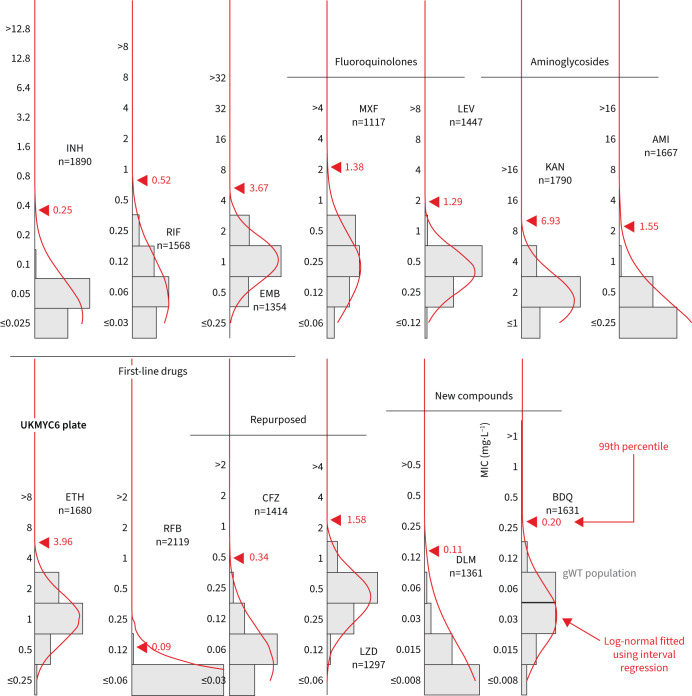
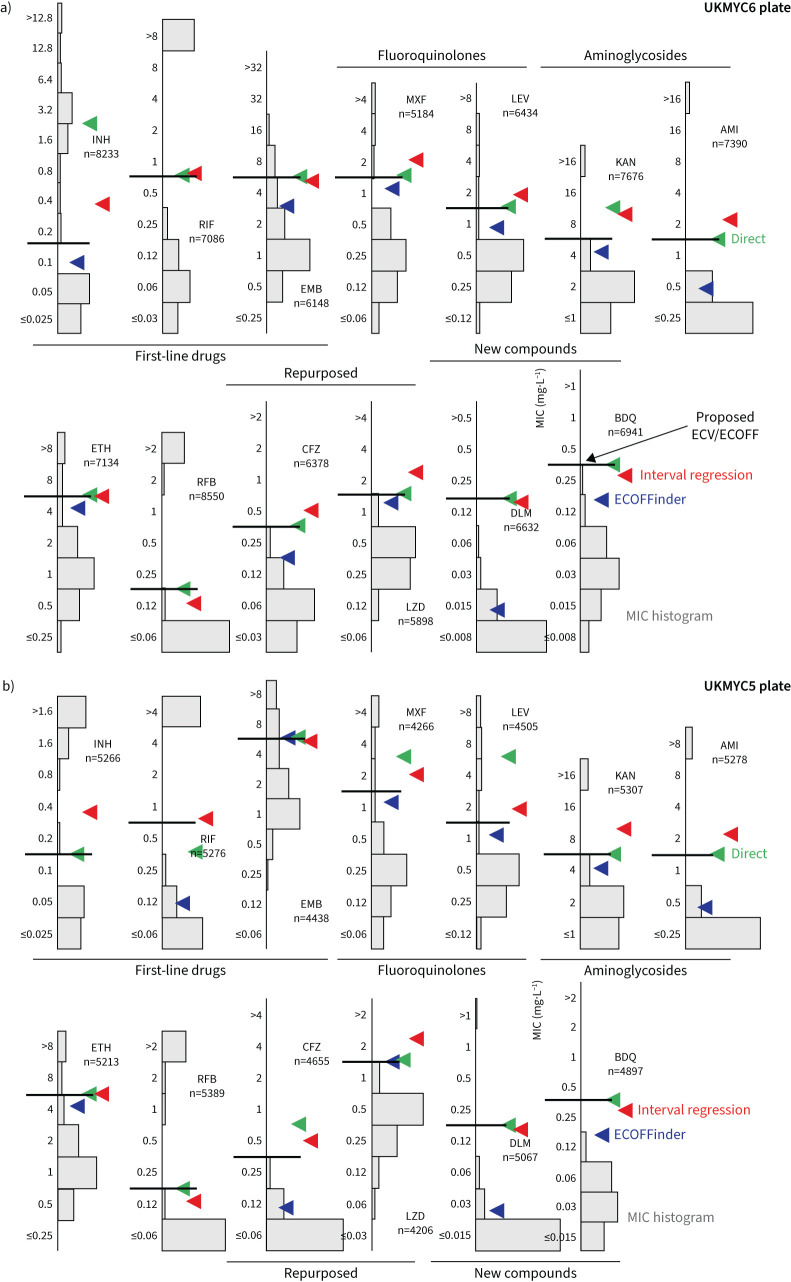
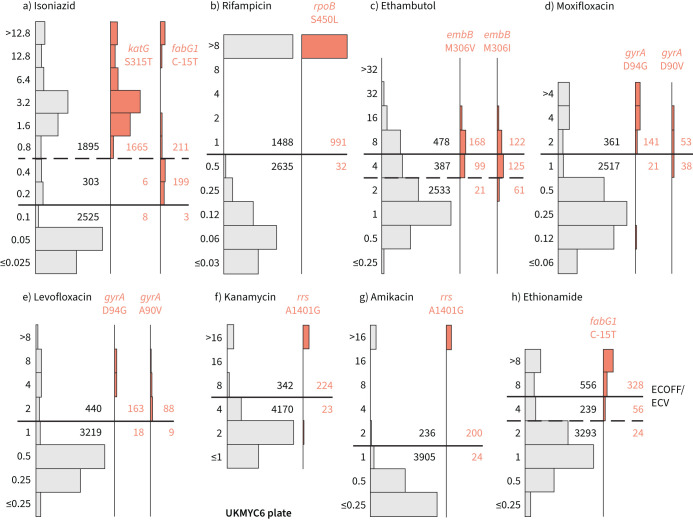
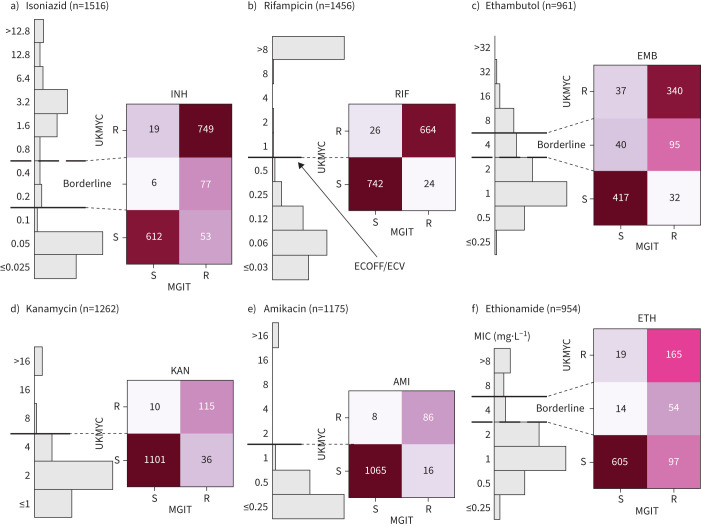
Drug susceptibility testing of M. tuberculosis is rooted in a binary susceptible/resistant paradigm. While there are considerable advantages in measuring the minimum inhibitory concentrations (MICs) of a panel of drugs for an isolate, it is necessary to measure the epidemiological cut-off values (ECOFF/ECVs) to permit comparison with qualitative data. Here we present ECOFF/ECVs for 13 anti-tuberculosis compounds, including bedaquiline and delamanid, derived from 20 637 clinical isolates collected by 14 laboratories based in 11 countries on five continents. Each isolate was incubated for 14 days on a dry 96-well broth microdilution plate and then read. Resistance to most of the drugs due to prior exposure is expected and the MIC distributions for many of the compounds are complex, and therefore a phenotypically wild-type population could not be defined. Since a majority of samples also underwent genetic sequencing, we defined a genotypically wild-type population and measured the MIC of the 99th percentile by direct measurement and via fitting a Gaussian using interval regression. The proposed ECOFF/ECVs were then validated by comparing with the MIC distributions of high-confidence genetic variants that confer resistance and with qualitative drug susceptibility tests obtained via the Mycobacterial Growth Indicator Tube (MGIT) system or Microscopic-Observation Drug Susceptibility (MODS) assay. These ECOFF/ECVs will inform and encourage the more widespread adoption of broth microdilution: this is a cheap culture-based method that tests the susceptibility of 12-14 antibiotics on a single 96-well plate and so could help personalise the treatment of tuberculosis.
Copyright ©The authors 2022.
Conflict of interest statement
Conflict of interest: E. Robinson is employed by Public Health England and holds an honorary contract with Imperial College London. I.F. Laurenson is Director of the Scottish Mycobacteria Reference Laboratory. S. Niemann receives funding from German Center for Infection Research, Excellenz Cluster Precision Medicine in Chronic Inflammation, Leibniz Science Campus Evolutionary Medicine of the LUNG (EvoLUNG)tion EXC 2167. P. Supply is a consultant at Genoscreen. T.C. Rodwell is funded by the National Institutes of Health and Dept of Defense, and receives salary support from the non-profit organisation FIND. T.C. Rodwell is a co-founder, board member and shareholder of Verus Diagnostics Inc., a company that was founded with the intent of developing diagnostic assays. Verus Diagnostics was not involved in any way with data collection, analysis or publication of the results. T.C. Rodwell has not received any financial support from Verus Diagnostics. The University of California San Diego (UCSD) Conflict of Interest office has reviewed and approved T.C. Rodwell's role in Verus Diagnostics Inc. T.C. Rodwell is a co-inventor of a provisional patent for a TB diagnostic assay (provisional patent: 63/048.989). T.C. Rodwell is a co-inventor on a patent associated with the processing of TB sequencing data (European Patent Application 14840432.0 and USSN 14/912,918). T.C. Rodwell has agreed to “donate all present and future interest in and rights to royalties from this patent” to UCSD to ensure that he does not receive any financial benefits from this patent. S. Shah is working and holding employee stock ownership plans at HaystackAnalytics Pvt Ltd (Product: Using whole genome sequencing for drug-susceptibility testing for Mycobacterium tuberculosis). G.F. Gao is listed as an inventor on patent applications for RBD-dimer-based coronavirus vaccines. The patents for RBD-dimers as protein subunit vaccines for SARS-CoV-2 have been licensed to Anhui Zhifei Longcom Biopharmaceutical Co. Ltd, China.
Figures
Comment in
-
The determination of epidemiological cut-off values requires a systematic and joint approach based on quality controlled, non-truncated minimum inhibitory concentration series.Eur Respir J. 2023 May 5;61(5):2202259. doi: 10.1183/13993003.02259-2022. Print 2023 May. Eur Respir J. 2023. PMID: 37147008 No abstract available.
-
Reply: Epidemiological cut-off values for a 96-well broth microdilution plate for high-throughput research antibiotic susceptibility testing of M. tuberculosis.Eur Respir J. 2023 May 5;61(5):2300426. doi: 10.1183/13993003.00426-2023. Print 2023 May. Eur Respir J. 2023. PMID: 37147010 Free PMC article.
-
Minimum inhibitory concentrations and sequencing data have to be analysed in more detail to set provisional epidemiological cut-off values for Mycobacterium tuberculosis complex.Eur Respir J. 2023 May 5;61(5):2202397. doi: 10.1183/13993003.02397-2022. Print 2023 May. Eur Respir J. 2023. PMID: 37147011 No abstract available.
References
-
- World Health Organization . Global tuberculosis report 2000. 2020. www.who.int/publications/i/item/9789240013131 Date last accessed: 8 March 2022.
-
- Enkirch T, Werngren J, Groenheit R, et al. Systematic review of whole-genome sequencing data to predict phenotypic drug resistance and susceptibility in Swedish Mycobacterium tuberculosis isolates, 2016 to 2018. Antimicrob Agents Chemother 2020; 64: e02550-19. doi: 10.1128/AAC.02550-19 - DOI - PMC - PubMed
Publication types
MeSH terms
Substances
Grants and funding
LinkOut - more resources
Full Text Sources
Medical
Molecular Biology Databases