. 2022 Mar 17;13(1):1407.
doi: 10.1038/s41467-022-28237-4.

Multi-omic cross-sectional cohort study of pre-malignant Barrett's esophagus reveals early structural variation and retrotransposon activity

Affiliations

Multi-omic cross-sectional cohort study of pre-malignant Barrett's esophagus reveals early structural variation and retrotransposon activity

A C Katz-Summercorn et al. Nat Commun. .

Abstract

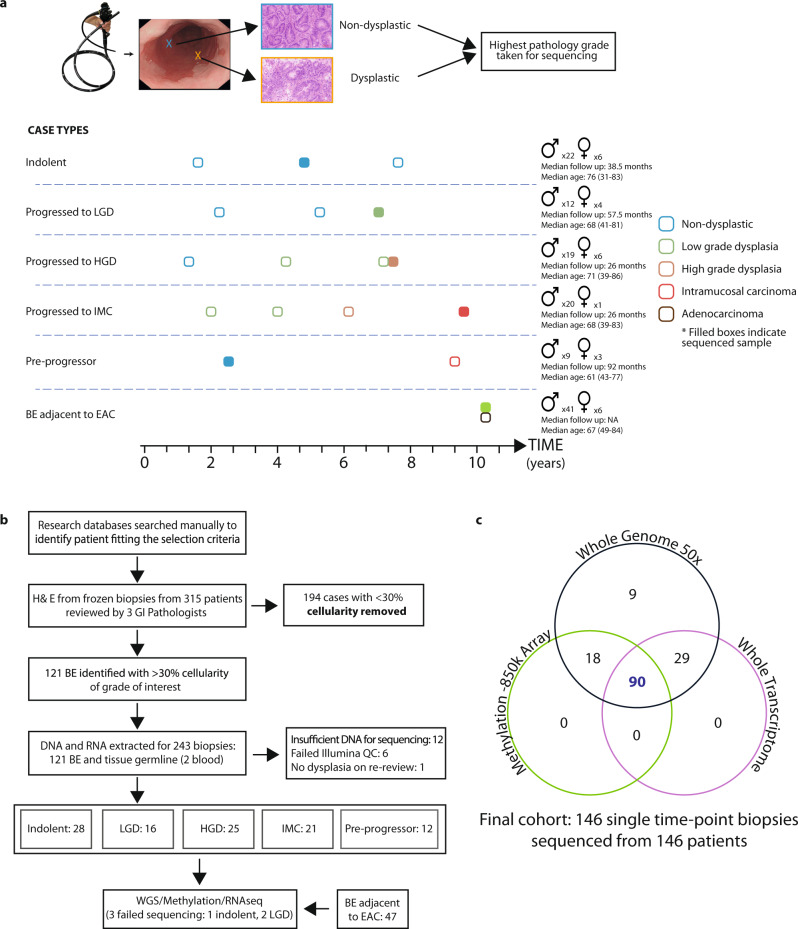
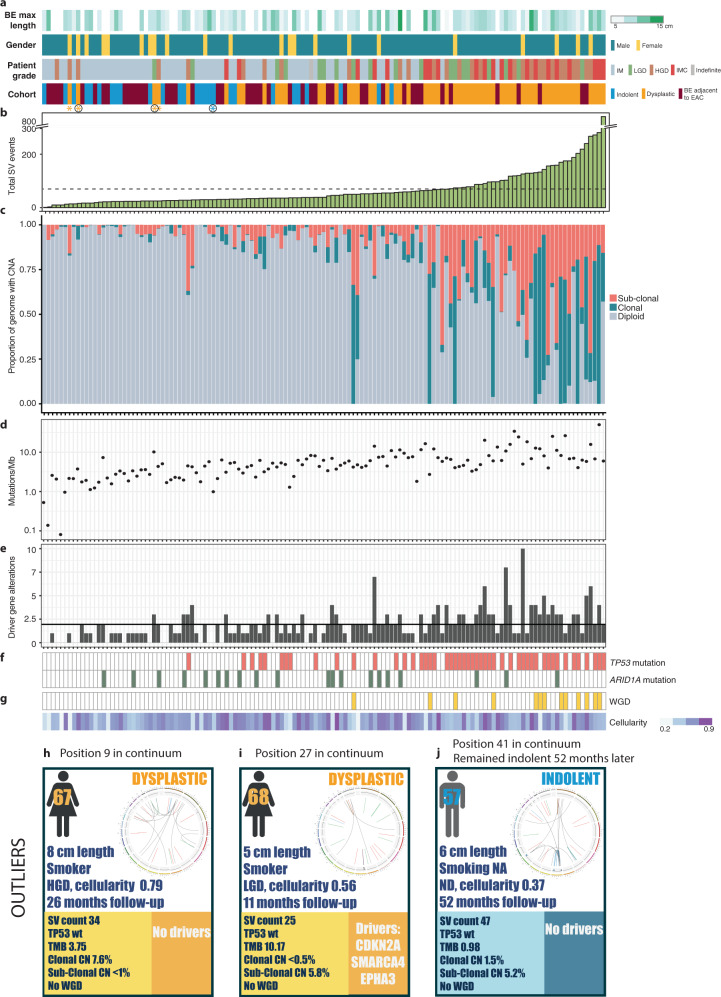
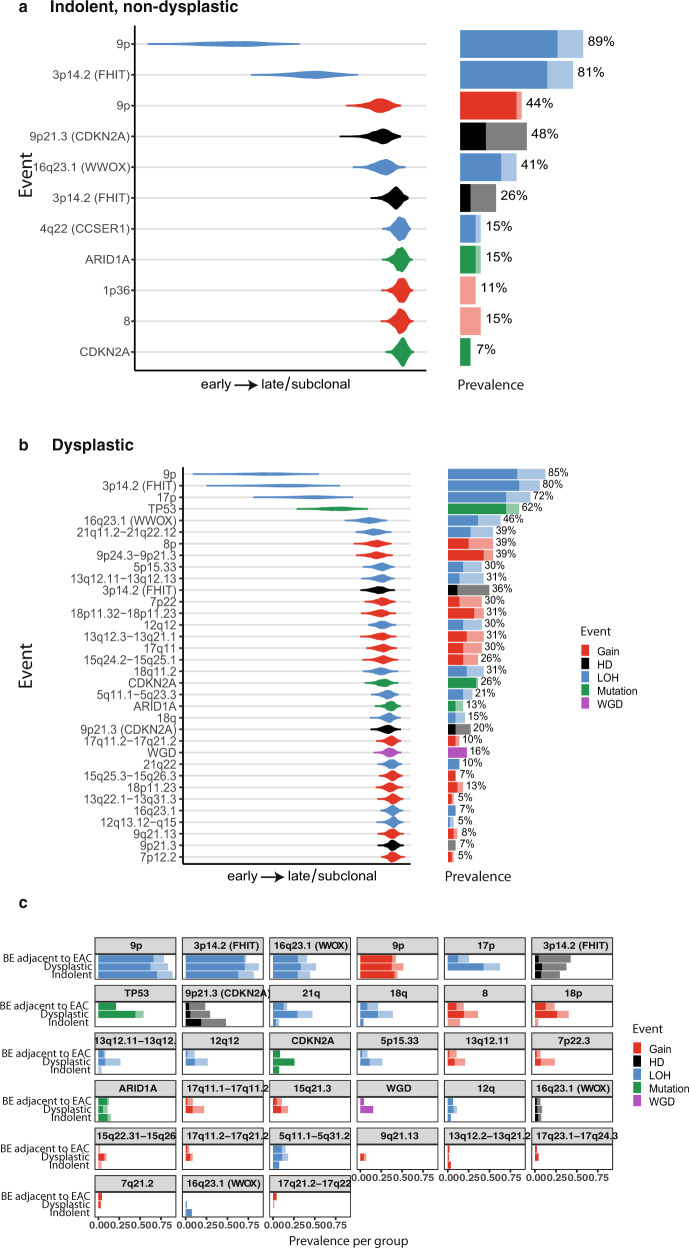
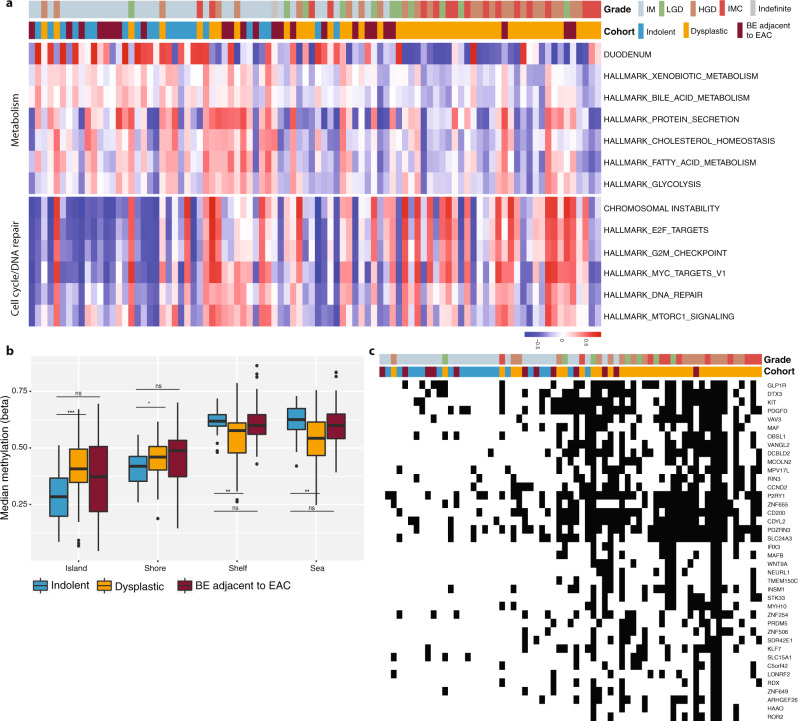
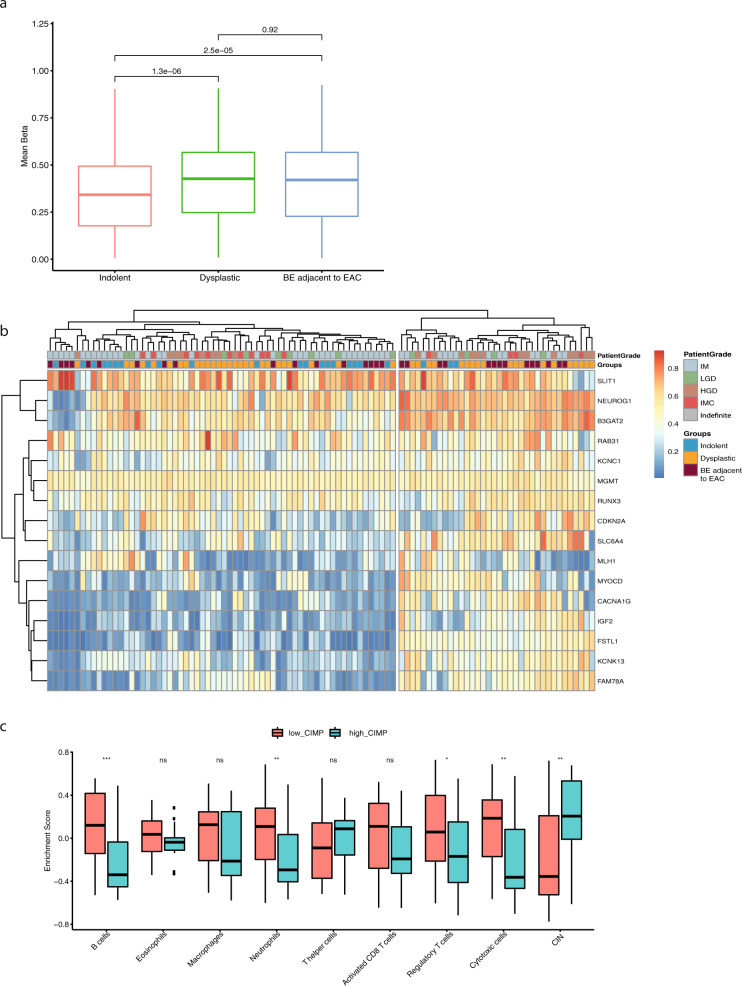
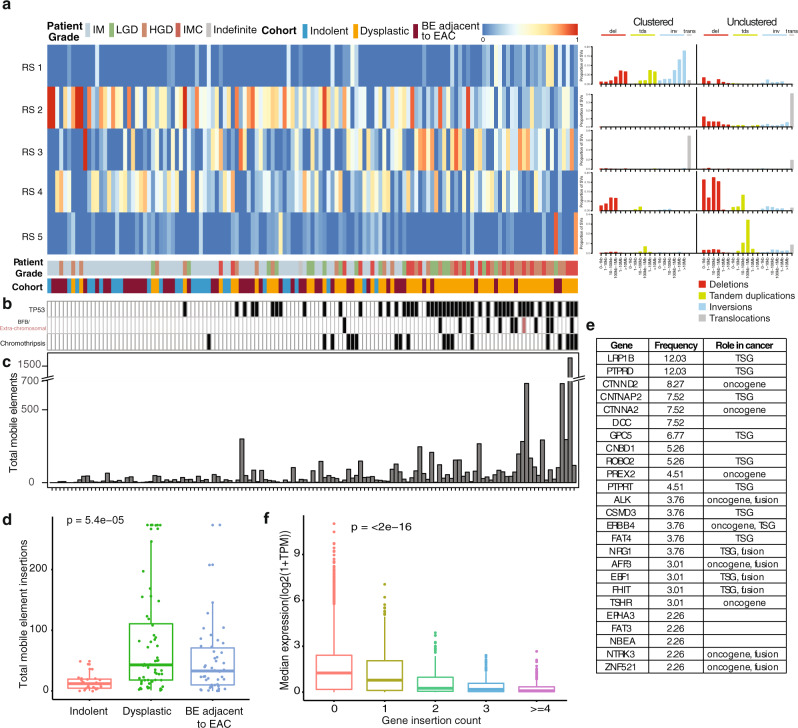
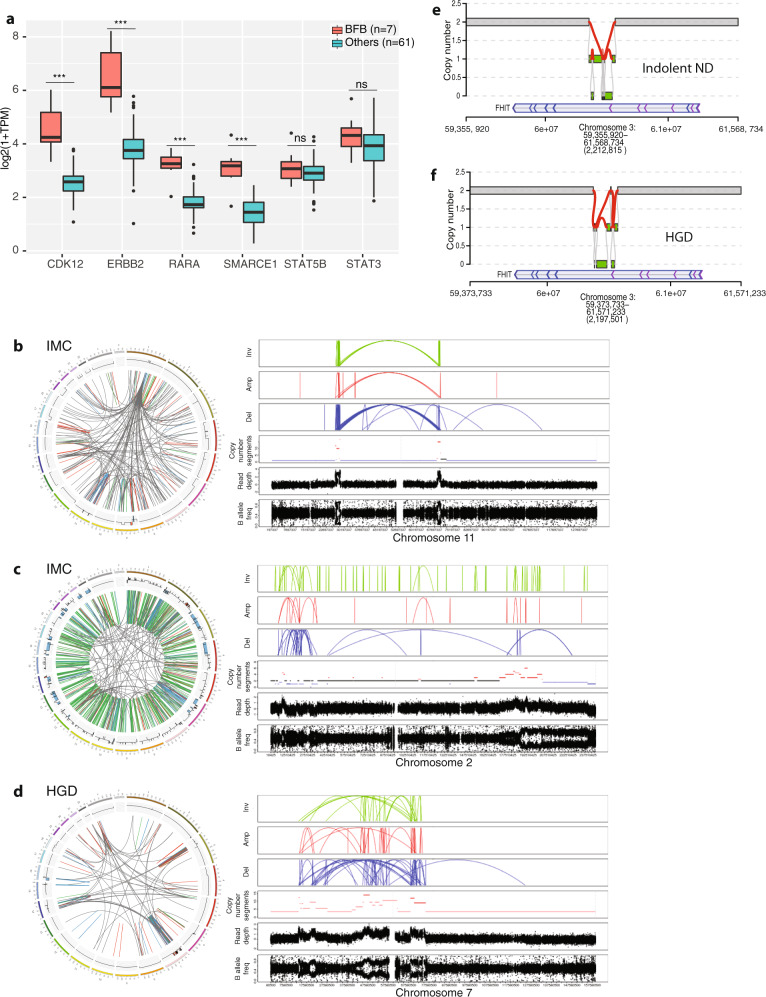
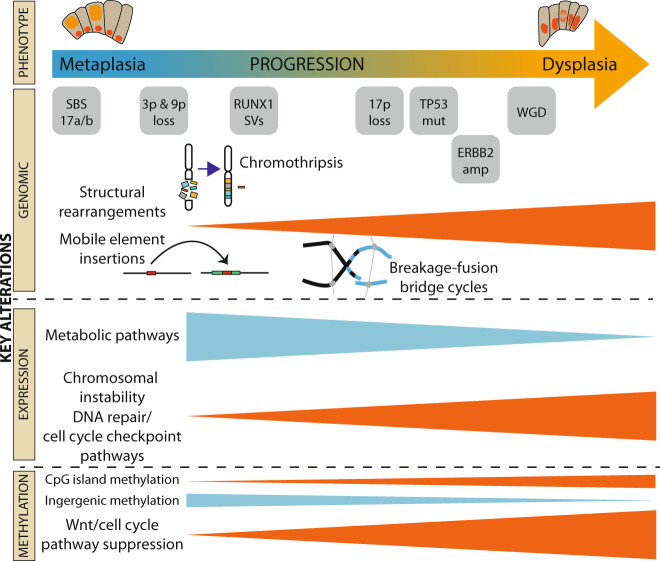
Barrett's esophagus is a pre-malignant lesion that can progress to esophageal adenocarcinoma. We perform a multi-omic analysis of pre-cancer samples from 146 patients with a range of outcomes, comprising 642 person years of follow-up. Whole genome sequencing reveals complex structural variants and LINE-1 retrotransposons, as well as known copy number changes, occurring even prior to dysplasia. The structural variant burden captures the most variance across the cohort and genomic profiles do not always match consensus clinical pathology dysplasia grades. Increasing structural variant burden is associated with: high levels of chromothripsis and breakage-fusion-bridge events; increased expression of genes related to cell cycle checkpoint, DNA repair and chromosomal instability; and epigenetic silencing of Wnt signalling and cell cycle genes. Timing analysis reveals molecular events triggering genomic instability with more clonal expansion in dysplastic samples. Overall genomic complexity occurs early in the Barrett's natural history and may inform the potential for cancer beyond the clinically discernible phenotype.


Conflict of interest statement

R.C.F. and M.O’.D. are named on patents related to Cytosponge and related assays (Cell Sampling Device PCT/GB2010/002077, Biomarker for Barrett’s Oesophagus US2012/0009597) which have been licensed by the Medical Research Council to Covidien GI Solutions (now Medtronic) and are co-founders of CYTED Ltd. R.C.F. and M.O’.D. have a patent on a method for detecting benign conditions in the upper intestinal tract (Methods for Detection of Benign Conditions PCT/GB2012/000855). These are not directly involved in the topic of this paper. The remaining authors declare no competing interests.

Figures

Fig. 1
Fig. 1. Study design and sequencing strategy.
a Examples of representative cases selected for sequencing, with surveillance endoscopies over time and the highest grade at the time point detailed: indolent non-dysplastic; cases which progressed to low-grade dysplasia (LGD) high-grade dysplasia (HGD) or intramucosal carcinoma (IMC); cases sampled prior to progression to dysplasia; Barrett’s esophagus (BE) sampled from adjacent to esophageal adenocarcinoma, at the cancer time point. The highest available pathology grade frozen biopsy was used for sequencing. Examples of frozen biopsy histology are shown. Gender, median follow-ups after the sequenced sample and median age and range detailed. b Flow diagram detailing cohort creation. 149 high-cellularity, triple pathology reviewed, single-time point BE biopsies sequenced from 149 individual patients with different disease trajectories were sequenced. c For each patient, one biopsy underwent whole-genome sequencing (WGS) at 50×, whole-transcriptome sequencing and methylation with the EPIC 850k array, where sufficient material was available. Three samples were later excluded due to genomic mismatch or poor coverage, resulting in an analysed cohort of 146 patients. The Venn diagram shows the numbers of biopsies sequenced with each modality.
Fig. 2
Fig. 2. Genomic characteristics of the pre-cancer cohort.
Samples are ordered by their total calculated numbers of structural variant (SV) events (n = 134). a Patient clinical features: maximum BE length (cm), gender, grade of patient at time of biopsy, patient group within the cohort. The patient grade indicates the highest grade which the patient had at the time point, but for the Barrett’s adjacent to cancer, for which the time point was cancer, the patient grade instead indicated the dysplasia status of the biopsy. Asterisks mark outlier cases discussed in more detail. b Total number of SV events per patient. Mean number of events (69.9) indicated by the dashed line. c Percentage of the genome with clonal and sub-clonal copy number aberrations (CNAs). d Total number of mutations/Mb. e Total number of driver gene alterations per sample. Mean of 1.95 shown by solid black line. f TP53 and ARID1A mutations. g Frequency of whole-genome doubling (WGD) and estimated biopsy cellularity calculated by Battenberg. hj Three cases highlighted as outliers in the continuum. h, i Examples of dysplastic cases lying to the left of the continuum (marked with a yellow asterisk in a black circle in a). j Indolent case with evidence of chromothripsis (marked with a blue asterisk in a black circle in a). For each case, the clinical details of age, gender, maximum length of the BE segment (cm), smoking status, grade of the patient, total follow-up length and computational cellularity of the biopsy are given. Genomic statistics and mutations in driver genes are detailed at the bottom. Circos plots to the right of each case summarise the dominant SV events occurring in each sample.
Fig. 3
Fig. 3. Timing of genomic events.
The timing of specific genomic events for indolent (a) and dysplastic (b) samples, showing the relative ordering of copy number events, driver mutations and WGD. c Prevalence of copy number events, driver mutations and WGD per group (indolent, progressed, BE adjacent to the tumour). The events are ordered in the relative order of occurrence determined by the Plackett-Luce model. The lighter colours indicate sub-clonal events. LOH loss of heterozygosity, HD homozygous deletion, WGD whole-genome doubling.
Fig. 4
Fig. 4. Expression pathway and methylation analysis of the continuum.
a Gene set enrichment analysis revealed the differential enrichment of genes involved in two main pathways, along the continuum: metabolism and cell cycle/DNA repair. Samples are ordered based on the SV continuum in Fig. 2, with highest patient grade and cohort group denoted at the top. b Median methylation levels for the cohort groups within different regions of the genome in relation to the CpG islands: island, shore (up to 2 kb from CpG island), shelf (2–4 kb from CpG island) and sea (>4 kb from CpG island). N = 100. Boxplot centre line denotes median, box limits are upper and lower quartiles, whiskers denote 1.5* the interquartile range. Statistical significance was calculated using Wilcoxon signed-ranked test. ns non-significant, *p-value < 0.05, **p-value < 0.5, ***p-value < 0.001. c Integrated gene expression and methylation data. Patients are aligned along the same SV continuum order. Thirty-seven genes related to the Wnt signalling and cell cycle pathways for which altered expression followed a gain in promoter methylation and for which there was a significant change in expression with progression.
Fig. 5
Fig. 5. CIMP marker analysis.
a Boxplot representing mean methylation (beta) of CIMP marker genes across three groups of BE cases. N = 100. Boxplot centre line denotes median, box limits are upper and lower quartiles, whiskers denote 1.5* the interquartile range. Statistical significance calculated using Wilcoxon signed-ranked test. b Heatmap showing methylation levels for all CIMP marker genes and grouping of samples into low and high CIMP groups. Annotation of samples are shown on the top. c Enrichment of different immune cell types and chromosomal instability in low and high CIMP groups. Boxplot centre line denotes median, box limits are upper and lower quartiles, whiskers denote 1.5* the interquartile range. Statistical significance was calculated using Wilcoxon signed-ranked test. ns non-significant, *p-value < 0.05, ***p-value < 0.001.
Fig. 6
Fig. 6. Complex structural variant analysis: mobile element insertions.
a Structural rearrangement signature (RS) proportions in the cohort: RS1 is dominated by clustered rearrangements; RS2 by unclustered translocations and deletions; RS3 by clustered translocations; RS4 is dominated by deletions; RS5 by tandem duplications >100 kb. Samples remain ordered by the total number of SV events with patient grade and cohort given. b TP53 mutation, breakage-fusion-bridge cycles (BFB) and chromothripsis events in the cohort. c The total number of mobile elements in each sample along the continuum. d Distribution of total mobile element insertion across different grades of samples. Indolent (n = 27), Dysplastic (n = 60), BE adjacent to EAC (n = 46). Boxplot centre line denotes median, box limits are upper and lower quartiles, whiskers denote 1.5* the interquartile range. Kruskal–Wallis test was used to compare groups. e Twenty-eight genes with oncogenic and tumour suppressor roles affected by recurrent (>3) mobile element insertions (as annotated by the Cancer Gene Consensus). f All genes are grouped by number of mobile element insertions and then their expression plotted. 0 (n = 17564), 1 (n = 1156), 2 (n = 277), 3 (n = 139), ≥4 (n = 190). Boxplot centre line denotes median, box limits are upper and lower quartiles, whiskers denote 1.5* the interquartile range. Kruskal–Wallis test was used to compare groups.
Fig. 7
Fig. 7. Breakage-fusion-bridge events and case examples of complex rearrangements.
a Comparison of expression levels of genes both within (CDK12, ERBB2, RARA, SMARCE1) and outside (STAT5B, STAT3) the genomic locus undergoing break-fusion-bridge (BFB) events for samples affected by BFB to those without. BFB cases, n = 7, other cases, n = 61. Boxplot centre line denotes median, box limits are upper and lower quartiles, whiskers denote 1.5* the interquartile range. ***p-value < 0.001, ns no significance. Statistical significance was calculated using Wilcoxon signed-ranked test. bd Circos plots for specific cases as examples of the complex rearrangements seen in dysplastic cases. The outer circle represents each chromosome. Translocations are indicated by the grey lines arcing from one region of the genome to another; the green lines indicate tandem duplications; red indicates deletions; blue signifies inversions. Adjacent to the circos plots are magnified regions showing the clustered events and resultant focal CNAs. b An IMC case, with extra-chromosomal DNA and extremely high copy number in two arms of chromosome 11, whereby one locus contains the CCND1 driver gene. c An IMC case dominated by tandem duplications and also showing characteristics of sub-telomeric BFB and chromothripsis in chromosome 2. d A HGD case displaying evidence of chromoplexy in chromosomes 3, 7, 16, 18 and X, as well as a complex BFB event in chromosome 7, involving the driver gene EGFR. e, f Two cases, one indolent, non-dysplastic and one with HGD, both displaying a distinct pattern of deletion in an area of low copy number junctions termed “rigma” at the fragile site FHIT locus.
Fig. 8
Fig. 8. Summary of main events.
Overview of the main events across the different sequencing modalities, seen to be associated with progression from the indolent, non-dysplastic to the dysplastic state.

References

    1. Srivastava S, Reid BJ, Ghosh S, Kramer BS. Research needs for understanding the biology of overdiagnosis in cancer screening. J. Cell. Physiol. 2016;231:1870–1875. - PMC - PubMed
    1. Pashayan N, Pharoah PDP. The challenge of early detection in cancer. Science. 2020;368:589–590. - PubMed
    1. Zagari RM, et al. Gastro-oesophageal reflux symptoms, oesophagitis and barrett’s oesophagus in the general population: the Loiano-Monghidoro study. Gut. 2008;57:1354–1359. - PubMed
    1. Ronkainen J, et al. Prevalence of Barrett’s esophagus in the general population: an endoscopic study. Gastroenterology. 2005;129:1825–1831. - PubMed
    1. Anderson, L. et al. Risk factors for Barrett’s oesophagus and oesophageal adenocarcinoma: results from the FINBAR study. World J. Gastroenterol.13, 1585–1594 (2007). - PMC - PubMed

Publication types