. 2022 Mar 17;13(1):1434.
doi: 10.1038/s41467-022-29142-6.

Oncogenic gene expression and epigenetic remodeling of cis-regulatory elements in ASXL1-mutant chronic myelomonocytic leukemia

Affiliations

Oncogenic gene expression and epigenetic remodeling of cis-regulatory elements in ASXL1-mutant chronic myelomonocytic leukemia

Moritz Binder et al. Nat Commun. .

Abstract

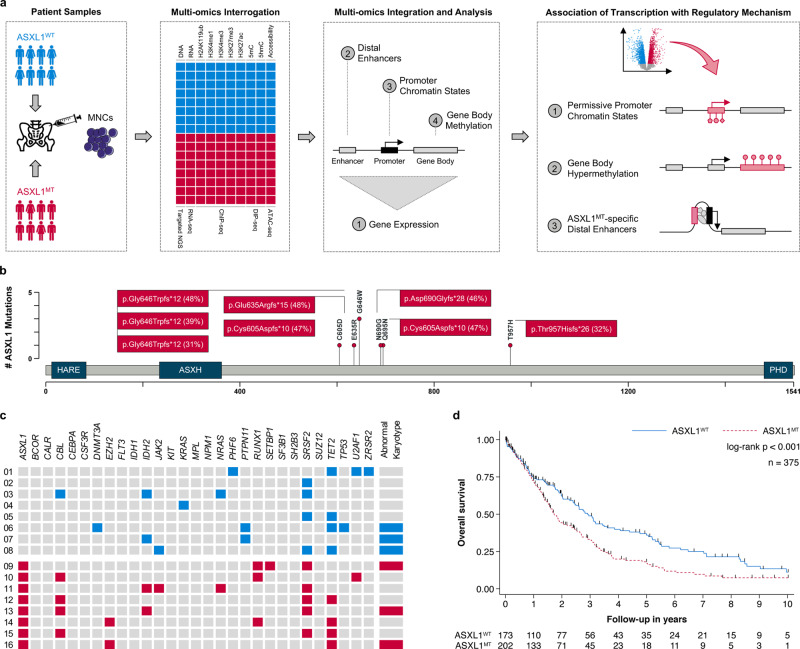
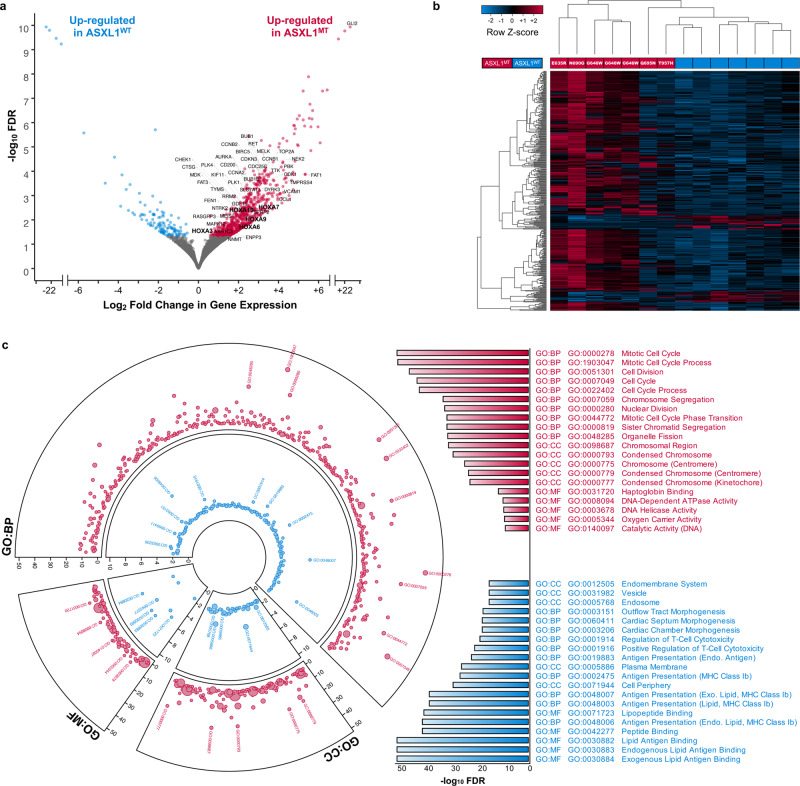
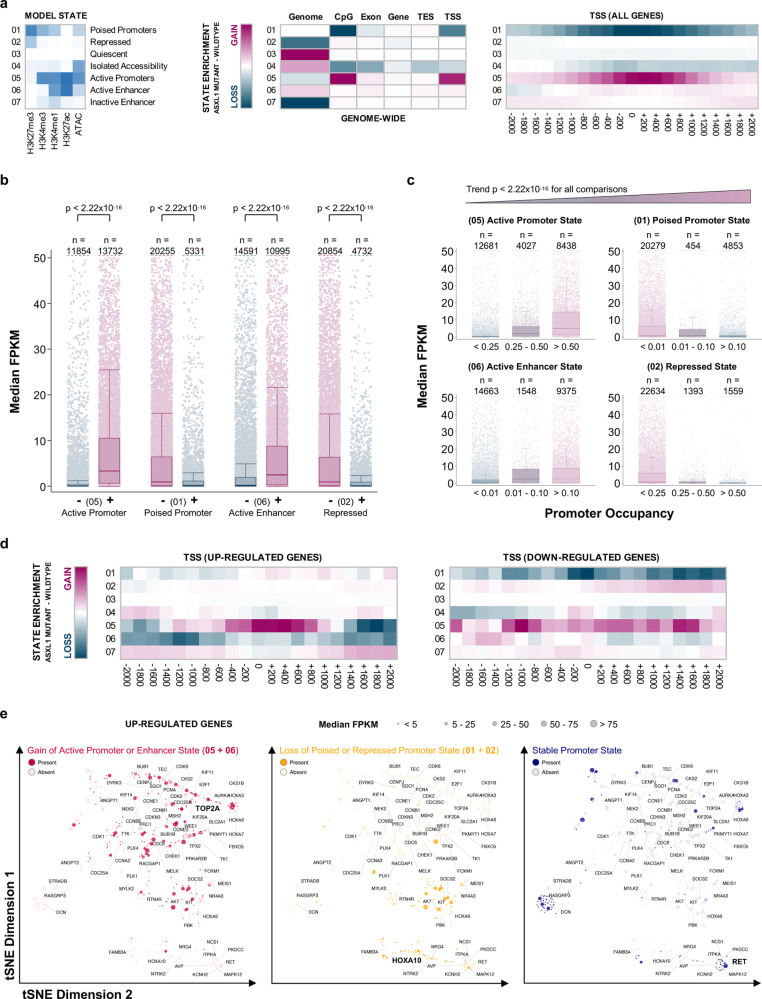
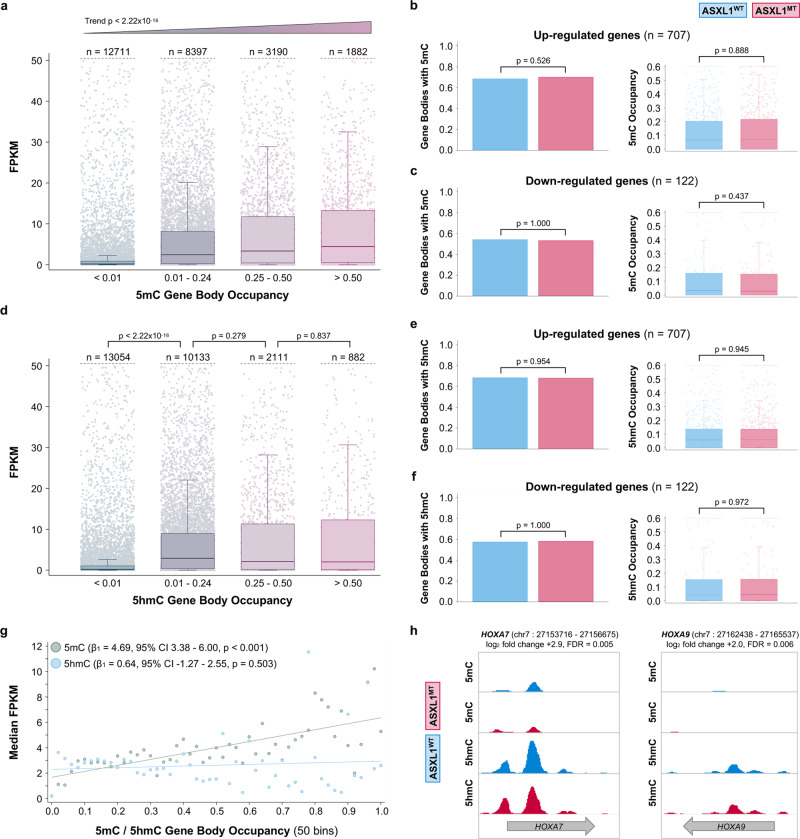
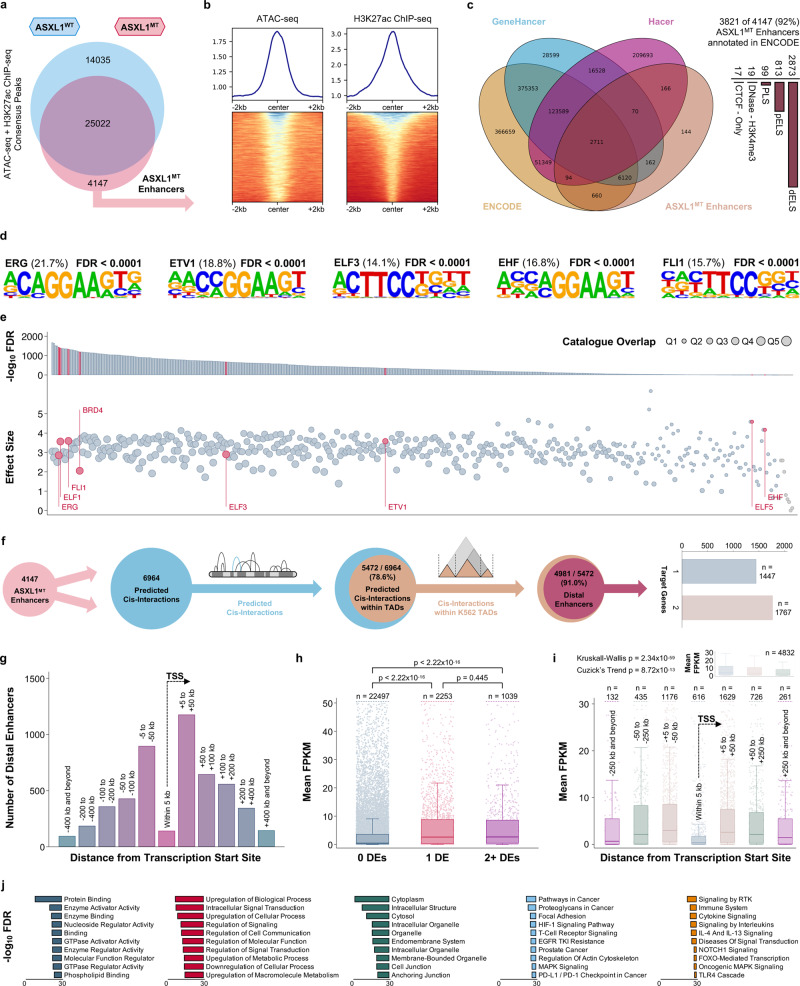
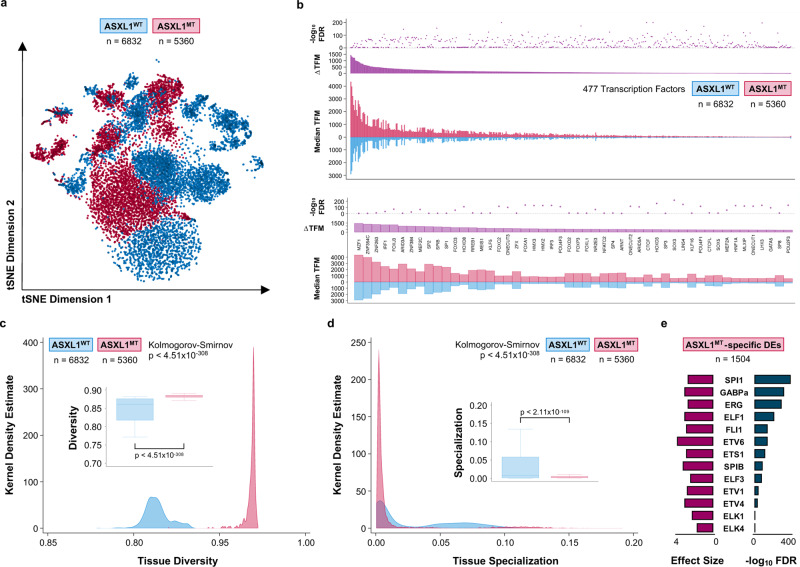
Myeloid neoplasms are clonal hematopoietic stem cell disorders driven by the sequential acquisition of recurrent genetic lesions. Truncating mutations in the chromatin remodeler ASXL1 (ASXL1MT) are associated with a high-risk disease phenotype with increased proliferation, epigenetic therapeutic resistance, and poor survival outcomes. We performed a multi-omics interrogation to define gene expression and chromatin remodeling associated with ASXL1MT in chronic myelomonocytic leukemia (CMML). ASXL1MT are associated with a loss of repressive histone methylation and increase in permissive histone methylation and acetylation in promoter regions. ASXL1MT are further associated with de novo accessibility of distal enhancers binding ETS transcription factors, targeting important leukemogenic driver genes. Chromatin remodeling of promoters and enhancers is strongly associated with gene expression and heterogenous among overexpressed genes. These results provide a comprehensive map of the transcriptome and chromatin landscape of ASXL1MT CMML, forming an important framework for the development of novel therapeutic strategies targeting oncogenic cis interactions.


Conflict of interest statement

The authors declare no competing interests.

Figures

Fig. 1
Fig. 1. Truncating ASXL1 mutations are of prognostic significance in chronic myelomonocytic leukemia and frequently co-occur with other mutations.
a Flowchart showing the study design: An integrated multi-omics approach to discover ASXL1MT-specific epigenetic regulatory mechanisms associated with transcriptional up-regulation. b Lollipop plot showing that all mutations in ASXL1 resulted in a frameshift preserving the HB1, ASXL, restriction endonuclease helix-turn-helix (HARE) and LXXLL motif alpha helical (ASXH) domain but not the plant homeodomain (PHD). All observed variant allele frequencies were compatible with heterozygosity. c Heatmap showing the spectrum of co-mutations, which included spliceosome components, chromatin regulators, modulators of DNA methylation, and cell signaling molecules. The prevalence of abnormal karyotypes and the burden of co-mutations were similar between ASXL1MT and ASXL1WT patients. d Kaplan–Meier plot showing overall survival estimates for the 375 patients with chronic myelomonocytic leukemia from which the 16 patients in this study were sampled from (median follow-up 18 months). The presence of truncating ASXL1 mutations was associated with increased all-cause mortality in this patient population (median overall survival 1.72 years, 95% CI 1.51–2.19, n = 202 versus 2.92 years, 95% CI 2.39–3.61, n = 173; HR 1.54, 95% CI 1.19–1.98, p = 0.001). This association remained consistent after adjusting for age at diagnosis, sex, and the other factors of the Mayo Molecular Risk Stratification Model (HR 1.37, 95% CI 1.05–1.78, p = 0.019, n = 375). There were no violations of the proportional hazards assumption (p = 0.113). Source data are provided as a Source Data file.
Fig. 2
Fig. 2. The transcriptome of ASXL1MT CMML is characterized by transcriptional up-regulation of key mitotic pathways and leukemogenic driver genes.
a Volcano plot showing a predominance of transcriptional up-regulation in ASXL1MT CMML with a limited number of genes being down-regulated. Up-regulated therapeutic targets with therapeutic agents either being available or currently under development are labeled. Also labeled are the members of the posterior HOXA cluster including the leukemogenic driver HOXA9 and its co-factor MEIS1 (bold). b Heatmap showing the separation of ASXL1MT and ASXL1WT CMML by unsupervised hierarchical clustering of all differentially expressed genes with FDR < 0.010. c Circos plot showing the up-regulation of mitotic activity and down-regulation of MHC class I mediated antigen presentation and cytotoxic T-cell activity in ASXL1MT CMML (red: up-regulated in ASXLMT CMML, blue: up-regulated in ASXLWT CMML). Bar graph showing the top hits in each gene ontology category (GO: Gene Ontology; BP: Biological Process; MF: Molecular Function; CC: Cellular Compartment). Axes represent the statistical significance of the gene ontology terms and the size of the markers is proportional to the number of genes per cluster.
Fig. 3
Fig. 3. ASXL1MT CMML is associated with permissive promoter chromatin states supporting transcriptional up-regulation.
a Heatmaps showing the chromatin states discovered by hidden Markov modeling and the transition of chromatin states between ASXL1WT and ASXL1MT CMML. b Box and strip plots showing the association between the presence of a given chromatin promoter state and gene expression (transcriptome-wide) among patients with ASXL1MT CMML (two-sided Mann–Whitney U test, raw p-values without adjustment for multiple hypothesis testing shown). c Box and strip plots showing the association between the extent of promoter occupancy of a given chromatin state and gene expression (transcriptome-wide) among patients with ASXL1MT CMML (two-sided Cuzick’s test for trend, raw p-values without adjustment for multiple hypothesis testing shown). The associations shown in b and c validate the model’s ability to predict gene expression and suggest that the transitions of these chromatin states between ASXL1WT and ASXL1MT CMML may serve as a plausible explanation for the observed differences in gene expression. d Heatmaps showing the chromatin state transitions in promoter regions between ASXL1WT and ASXL1MT CMML for the up- (n = 707) and down-regulated (n = 122) genes separately. e Scatter plots showing the 707 up-regulated genes in two-dimensional tSNE space, clustered based on their promoter chromatin states. Color coding indicates the type of promoter chromatin state transition affecting each gene between ASXL1WT and ASXL1MT CMML. Marker size indicates the median gene expression among patients with ASXL1MT CMML. The HOXA genes, MEIS1, and the mitotic kinases are labeled. One representative gene from each group of promoter chromatin state transitions is highlighted (bold print) and corresponding ChIP-seq signal tracks are shown in Supplementary Fig. 3e. Data are presented as standard Tukey boxplots (with the box encompassing Q1 to Q3, the median denoted as a central horizontal line in the box, and the whiskers covering the data within ±1.5 IQR in 3b and c).
Fig. 4
Fig. 4. Gene body (hydroxy-)methylation is positively associated with gene expression but cannot serve as an explanation for the increased transcriptional activity given the lack of differential (hydroxy-)methylation between ASXL1 genotypes.
a Box and strip plots showing the association between the extent of gene body methylation and gene expression (transcriptome-wide) among patients with ASXL1MT CMML (two-sided Cuzick’s test for trend, raw p-values without adjustment for multiple hypothesis testing shown). b Bar graphs showing the lack of differential gene body methylation between ASXL1WT and ASXL1MT CMML for the up-regulated genes. c Bar graphs showing the lack of differential gene body methylation between ASXL1WT and ASXL1MT CMML for the down-regulated genes. d Box and strip plots showing the association between the extent of gene body hydroxymethylation and gene expression (transcriptome-wide) among patients with ASXL1MT CMML. e Bar graphs showing the lack of differential gene body hydroxymethylation between ASXL1WT and ASXL1MT CMML for the up-regulated genes. f Bar graphs showing the lack of differential gene body hydroxymethylation between ASXL1WT and ASXL1MT CMML for the down-regulated genes. g Scatter plot showing the association between the extent of gene body (hydroxy)methylation and gene expression among patients with ASXL1MT CMML. Gene expression increases linearly with increases in gene body methylation. While the presence (compared to the absence) of gene body hydroxymethylation is strongly associated with increased gene expression, a greater extent of gene body hydroxymethylation is not associated with further increases in gene expression (threshold). The two-sided Wald test was used to test the model coefficients (raw p-values without adjustment for multiple hypothesis testing are shown). h Signal tracks showing the lack of differential (hydroxy-)methylation between ASXL1WT and ASXL1MT CMML for the up-regulated genes HOXA7 and HOXA9. Data are presented as mean values (bars in 4b, c, e, f) or standard Tukey boxplots (with the box encompassing Q1 to Q3, the median denoted as a central horizontal line in the box, and the whiskers covering the data within ±1.5 IQR in 4af). The two-sided Mann–Whitney U test was used to compare groups in 4bf, raw p-values without adjustment for multiple hypothesis testing are shown.
Fig. 5
Fig. 5. ASXL1MT-specific distal enhancers are positively associated with gene expression of their putative target genes and can serve as a plausible explanation for the increased transcriptional activity in ASXL1MT CMML.
a Venn diagram showing the co-mapping of chromatin accessibility and H3K27ac to identify ASXL1MT-specific cis-regulatory elements. b Signal curves and heatmaps showing the co-occurrence of DNA accessibility and H3K27ac in these ASXL1MT-specific cis-regulatory elements. c Venn diagram and bar graphs demonstrating the identity of these ASXL1MT-specific cis-regulatory elements (known enhancers, mostly distally located). d Position weight matrices generated from motif discovery show the over-representation of ETS transcription factors (top 5 enriched motifs) in the ASXL1MT-specific distal enhancers. e Validation of the predicted ETS transcription factor enrichment in the ASXL1MT-specific distal enhancers using publicly available human transcription factor ChIP-seq data. f Euler diagrams and bar graphs showing the association between the ASXL1MT-specific distal enhancers and putative target genes within leukemia-specific topologically associating domains. g Bar graphs showing the distribution of the ASXL1MT-specific distal enhancers by distance on the linear genome from the transcription start site of their putative target genes. h Box and strip plots demonstrating the association between the presence of distal enhancers and increased gene expression among patients with ASXL1MT CMML (without evidence for a dosage effect of more than one distal enhancer). i Box and strip plots demonstrating the association between proximity of distal enhancer and putative target gene on the linear genome and increased gene expression of the putative target gene among patients with ASXL1MT CMML. j Bar graphs showing the functional annotation of the putative target genes of the ASXL1MT-specific distal enhancers including receptor tyrosine kinase, cytokine, and oncogenic MAPK signaling. Data are presented as standard Tukey boxplots (with the box encompassing Q1 to Q3, the median denoted as a central horizontal line in the box, and the whiskers covering the data within ±1.5 IQR in 5h and i).
Fig. 6
Fig. 6. ASXL1MT CMML is associated with increased intratumoral heterogeneity secondary to an extended repertoire of accessible distal enhancers.
a Scatter plot showing 12192 single cells from CMML patients (stratified by ASXL1 genotype) in two-dimensional tSNE space, clustered based on the accessibility of known transcription factor motifs. b Bar graphs and dot plot demonstrating the increased single-cell accessibility of binding sites for 476 transcription factors (top panel), ranked by the difference in accessible transcription factor motif (TFM) binding sites (scATAC-seq peaks with a given transcription factor motif) between ASXL1WT and ASXL1MT CMML. The top 50 transcription factors with increased accessible binding sites are magnified (bottom panel) and included key oncogenic myeloid transcription factors such as MZF1, MEF2C, and MEIS1. Source data are provided as a Source Data file. c Area graphs and box plots showing a measure of tissue diversity (based on single-cell entropies) for 12192 single cells from CMML patients (stratified by ASXL1 genotype). The two-sample Kolmogorov-Smirnov test for equality of distribution functions was used to compare both distributions. Source data are provided as a Source Data file. d Area graphs and box plots showing a measure of tissue specialization (based on single-cell entropies) for 12192 single cells from CMML patients (stratified by ASXL1 genotype). The two-sample Kolmogorov-Smirnov test for equality of distribution functions was used to compare both distributions (p-value). Source data are provided as a Source Data file. e Bar graphs showing the enrichment of ETS transcription factor motifs in 1504 ASXL1MT-specific distal enhancers identified by scATAC-seq (validation of bulk ATAC-seq findings). Data are presented as standard Tukey boxplots (with the box encompassing Q1 to Q3, the median denoted as a central horizontal line in the box, and the whiskers covering the data within ±1.5 IQR in 6c and d).

References

    1. Metzeler KH, et al. Spectrum and prognostic relevance of driver gene mutations in acute myeloid leukemia. Blood. 2016;128:686–698. - PubMed
    1. Papaemmanuil E, et al. Genomic classification and prognosis in acute myeloid leukemia. N. Engl. J. Med. 2016;374:2209–2221. - PMC - PubMed
    1. Patnaik, M. M. & Tefferi, A. Chronic myelomonocytic leukemia: 2020 update on diagnosis, risk stratification and management. Am. J. Hematol.95, 97–115 (2020). - PubMed
    1. Gelsi-Boyer V, et al. ASXL1 mutation is associated with poor prognosis and acute transformation in chronic myelomonocytic leukaemia. Br. J. Haematol. 2010;151:365–375. - PubMed
    1. Itzykson R, et al. Prognostic score including gene mutations in chronic myelomonocytic leukemia. J. Clin. Oncol. 2013;31:2428–2436. - PubMed

MeSH terms