. 2022 Mar 17;13(1):1440.
doi: 10.1038/s41467-022-29174-y.

Autophagy impairment in liver CD11c+ cells promotes non-alcoholic fatty liver disease through production of IL-23

Affiliations

Autophagy impairment in liver CD11c+ cells promotes non-alcoholic fatty liver disease through production of IL-23

Lauriane Galle-Treger et al. Nat Commun. .

Abstract

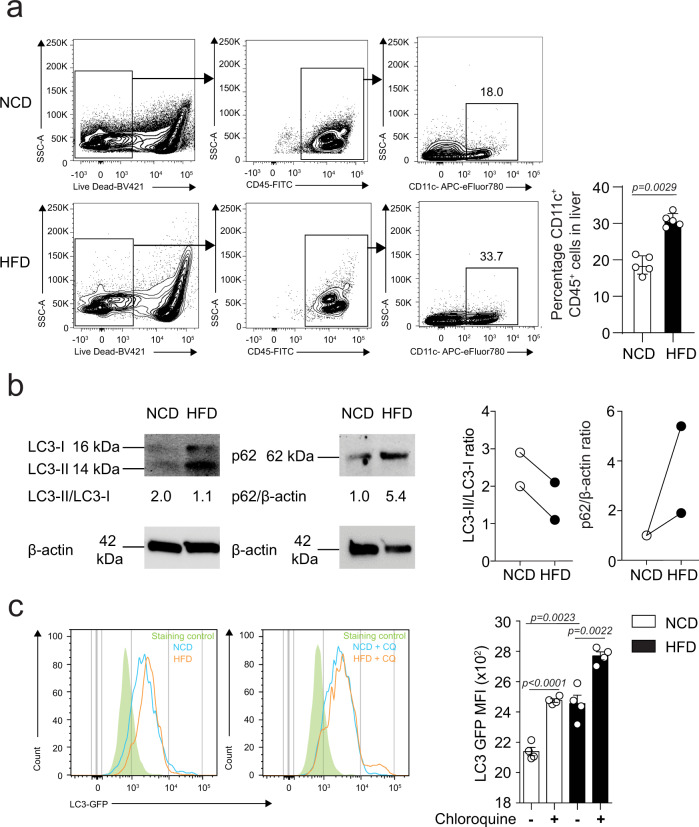
There has been a global increase in rates of obesity with a parallel epidemic of non-alcoholic fatty liver disease (NAFLD). Autophagy is an essential mechanism involved in the degradation of cellular material and has an important function in the maintenance of liver homeostasis. Here, we explore the effect of Autophagy-related 5 (Atg5) deficiency in liver CD11c+ cells in mice fed HFD. When compared to control mice, Atg5-deficient CD11c+ mice exhibit increased glucose intolerance and decreased insulin sensitivity when fed HFD. This phenotype is associated with the development of NAFLD. We observe that IL-23 secretion is induced in hepatic CD11c+ myeloid cells following HFD feeding. We demonstrate that both therapeutic and preventative IL-23 blockade alleviates glucose intolerance, insulin resistance and protects against NAFLD development. This study provides insights into the function of autophagy and IL-23 production by hepatic CD11c+ cells in NAFLD pathogenesis and suggests potential therapeutic targets.


Conflict of interest statement

The authors declare no competing interests.

Figures

Fig. 1
Fig. 1. Autophagy genes are inhibited in human and mouse livers in lipid-rich contexts.
a Color-coded histogram of the expression levels of genes associated with the IL-23 pathway or the autophagy mechanism. The genes are shown as their moderated t-statistic value which is calculated based on the fold-change between patients with advanced NAFLD compared to mild cases. Transcriptome data was obtained and reanalyzed for 72 patients (40 patients with mild NAFLD and 32 patients with advanced NAFLD). b Color-coded histogram of the expression levels of genes associated with the IL-23 pathway or the autophagy mechanism. The genes are shown as their fold-change values between WT mice fed NCD or HFD for 7 weeks (n = 2).
Fig. 2
Fig. 2. HFD induces CD11c expression and impairs the autophagic flux in hepatic CD11c+ cells.
a Gating strategy of hepatic CD11c+ CD45+ cells isolated from C57BL/6 mice fed NCD or HFD (left panel). Percentage of hepatic CD11c+ CD45+ cells (right panel), n = 5 mice. b Western blot analysis of LC3-I/II and p62 levels in hepatic CD11c+ cells isolated from C57BL/6 mice (NCD vs. HFD) (left panel showing LC3 bands and a middle panel showing p62 bands). Densitometric quantification of LC3II/LC3I ratio (normalized to β-actin) and p62/β-actin (right panel), n = 2 independent experiments. c Flow cytometry quantification of LC3 expression in hepatic CD11c+ cells isolated from C57BL/6 mice (NCD vs. HFD) and cultured for 15 h in the presence or absence of chloroquine (CQ at 25 μM), n = 4 mice. Error bars are the mean ± SD, two-tailed Student’s t test. Experiments were performed at least two times. Source data are provided as a Source Data file.
Fig. 3
Fig. 3. Loss of Atg5 increases dendritic cell accumulation in mice fed HFD.
a Gating strategy was used to identify myeloid populations in mice fed NCD or HFD for 14 weeks (top panel WT cells, bottom panel Atg5 CD11cKO mice). The level of isotype-matched stain defines TIM4 CLEC4f population and discriminates TIM4+ and TIM4 cells. b Histogram of CD11c expression in macrophage subpopulations (CLEC4f macrophages, TIM4+ KC and TIM4 KC) from WT and Atg5 CD11cKO mice. c Percentage of CLEC4f- macrophages, TIM4+ KC and TIM4 KC from total liver macrophages in WT and Atg5 CD11cKO mice (NCD vs. HFD). Error bars are the mean ± SD, ns nonsignificant, two-tailed Student’s t test, n = 5 mice. Experiments were performed three times. Source data are provided as a Source Data file.
Fig. 4
Fig. 4. Atg5 deletion in CD11c+ cells induces insulin resistance in mice.
a WT and Atg5 CD11cKO mice were fed HFD for 14 weeks according to the scheme, n = 6. b Total weight and c fasting blood glucose levels were measured every 2 weeks for 14 weeks. d Serum insulin concentrations were measured by ELISA after 24 weeks of HFD. Glucose tolerance test (e) and insulin tolerance test (f) were performed on WT and Atg5 CD11cKO mice fed HFD and treated for 14 weeks. The corresponding area under the curve was calculated for each group. g Photos of the dissected liver after perfusion. h Liver weights were measured after 14 weeks of HFD. i Serum (left) and hepatic (right) triglyceride levels was measured after 14 weeks of HFD. j Serum ALT was measured by colorimetric assay. k Representative hematoxylin and eosin-stained hepatic sections (×400), scale bars, 100 µm. l Histology score for steatosis, hepatocyte ballooning, lobular inflammation, NAFLD Activity Score, and fibrosis was quantified. Error bars are the mean ± SD, two-tailed Student’s t test, n = 5 mice. Experiments were performed three times. Source data are provided as a Source Data file. Mouse image provided with permission from Servier Medical Art.
Fig. 5
Fig. 5. Atg5 deletion in CD11c+ cells increases IL-23 induction.
a WT and Atg5 CD11cKO mice were fed HFD for 14 weeks according to the scheme, n = 6. After 14 weeks of HFD, hepatic CD11c+ cells were isolated. b Volcano plot comparison of whole transcriptome gene expression of sorted hepatic WT and Atg5 CD11cKO cells from mice fed HFD for 14 weeks, n = 6. Differentially expressed genes (p-value < 0.05), with changes of at least 2-fold change (FC) are shown in orange (upregulated) or blue (downregulated). c Network analysis of upregulated (red) and downregulated (green) genes overall significantly predicted to induce liver inflammation. d Heat plot of differentially expressed genes related to IL-23 pathway. e Representative flow cytometric plots of IL-23 expression in hepatic CD11c+ cells in WT and Atg5 CD11cKO mice after 14 weeks of HFD. f Percentage of hepatic IL-23+ CD11c+ cells after 0, 4, 8, 10, and 14 weeks of HFD, n = 5 mice. g Serum IL-23 levels in WT and Atg5 CD11cKO after 14 weeks of HFD, n = 8 mice. Error bars are the mean ± SD, two-tailed Student’s t test. Experiments were performed three times. Source data are provided as a Source Data file. Mouse image provided with permission from Servier Medical Art.
Fig. 6
Fig. 6. Preventive anti-IL-23 treatment protects against insulin resistance and NAFLD development in mice.
a WT and Atg5 CD11cKO mice fed HFD for 14 weeks were treated either with anti-IL-23 antibody or isotype control by intraperitoneal injection every week according to the scheme, n = 6. b Total weight, c blood glucose, and d serum insulin levels were measured after 14 weeks of diet. e Glucose tolerance test and f insulin tolerance tests were performed in WT and Atg5 CD11cKO mice fed HFD for 14 weeks and treated either with anti-IL-23 antibody or isotype control. The corresponding area under the curve was calculated for each group. g Liver weights were measured. h Serum ALT was measured by colorimetric assay. i Representative Hematoxylin and eosin-stained hepatic sections (×400), scale bars, 100 µm. j Histology score for steatosis, hepatocyte ballooning, lobular inflammation, fibrosis, and NAFLD Activity score was quantified. k Hepatic triglycerides levels were measured. Error bars are the mean ± SD, two-tailed Student’s t test, n = 5 mice. Experiments were performed three times. Source data are provided as a Source Data file. Mouse image provided with permission from Servier Medical Art.
Fig. 7
Fig. 7. Therapeutic anti-IL-23 treatment ameliorates established insulin resistance and NAFLD.
a WT and Atg5 CD11cKO mice-fed HFD for 14 weeks. After 8 weeks of diet, mice were treated either with anti-IL-23 antibody or isotype control by intraperitoneal injection every week according to the scheme, n = 6. b Total weight, c blood glucose, and d serum insulin levels were measured after 14 weeks of diet. e Glucose tolerance test and f insulin tolerance tests were performed in WT and Atg5 CD11cKO mice fed HFD for 14 weeks and treated either with anti-IL-23 antibody or isotype control. The corresponding area under the curve was calculated for each group. g Liver weights were measured. h Serum ALT was measured by colorimetric assay. i Representative Hematoxylin and eosin-stained hepatic sections (×400), scale bars, 100 µm. j Histology score for steatosis, hepatocyte ballooning, lobular inflammation, fibrosis, and NAFLD Activity score was quantified. k Hepatic triglycerides levels were measured. Error bars are the mean ± SD, two-tailed Student’s t test, n = 5 mice. Experiments were performed three times. Source data are provided as a Source Data file. Mouse image provided with permission from Servier Medical Art.

References

    1. Younossi ZM. Non-alcoholic fatty liver disease—a global public health perspective. J. Hepatol. 2019;70:531–544. - PubMed
    1. Cotter TG, Rinella M. Nonalcoholic fatty liver disease 2020: The State of the Disease. Gastroenterology. 2020;158:1851–1864. - PubMed
    1. Yang Z, Klionsky DJ. Mammalian autophagy: core molecular machinery and signaling regulation. Curr. Opin. Cell Biol. 2010;22:124–131. - PMC - PubMed
    1. Yang Z, Klionsky DJ. An overview of the molecular mechanism of autophagy. Curr. Top. Microbiol. Immunol. 2009;335:1–32. - PMC - PubMed
    1. Yang Z, Klionsky DJ. Eaten alive: a history of macroautophagy. Nat. Cell Biol. 2010;12:814–822. - PMC - PubMed

Publication types