. 2023 Sep;28(9):3727-3738.
doi: 10.1038/s41380-022-01499-6. Epub 2022 Mar 17.

Autistic-like behavior and cerebellar dysfunction in Bmal1 mutant mice ameliorated by mTORC1 inhibition

Affiliations

Autistic-like behavior and cerebellar dysfunction in Bmal1 mutant mice ameliorated by mTORC1 inhibition

Dong Liu et al. Mol Psychiatry. 2023 Sep.

Abstract

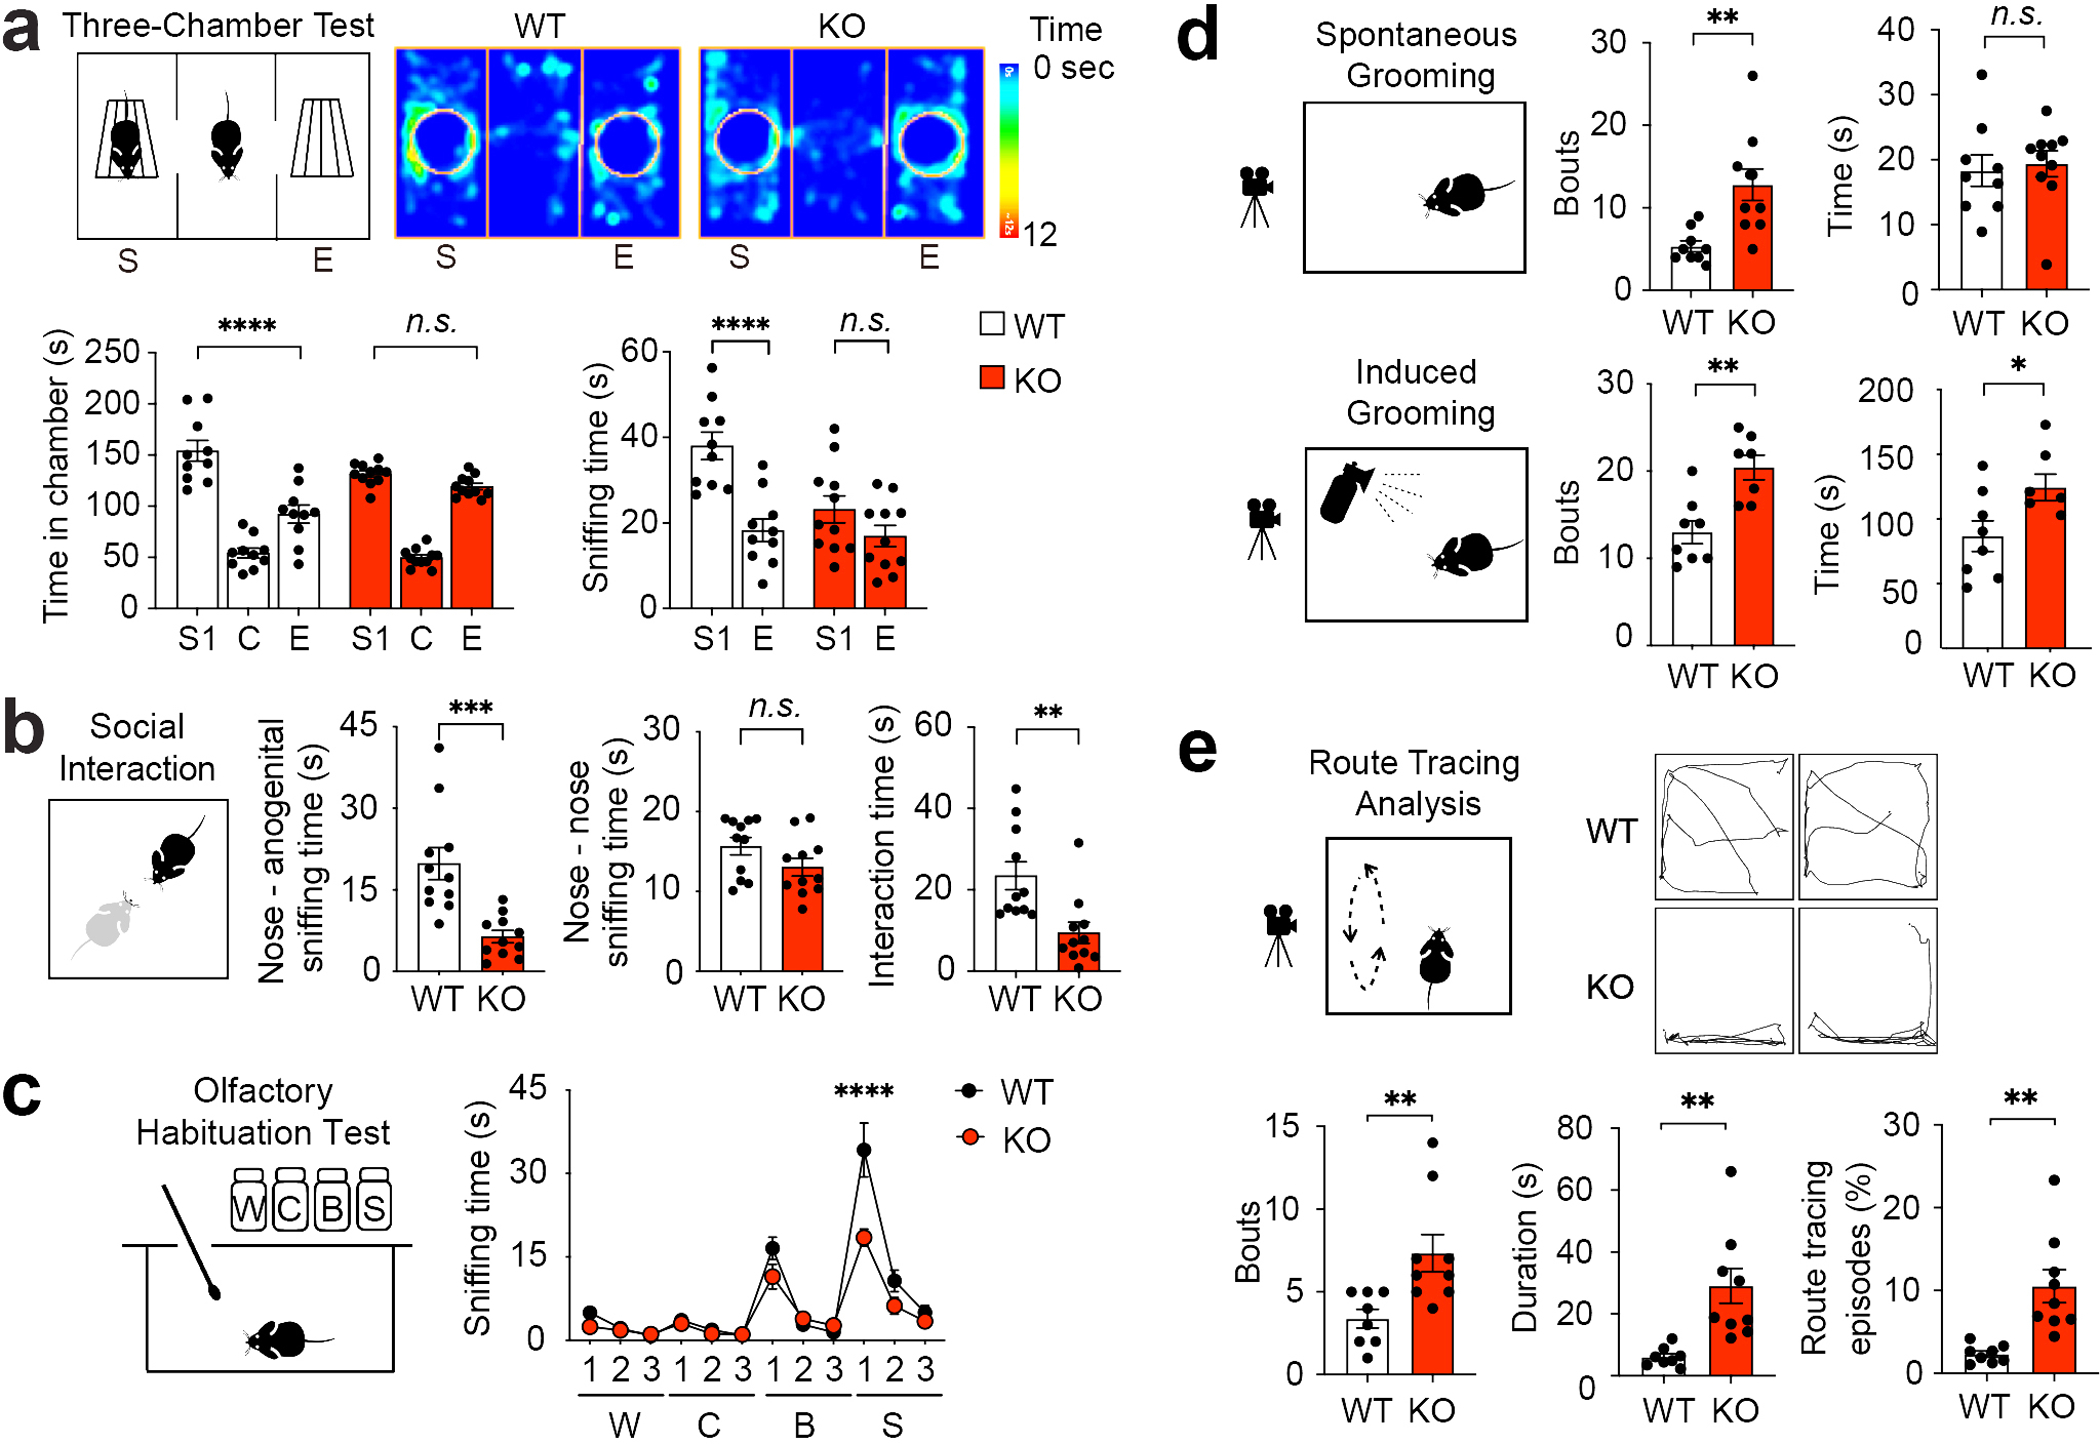
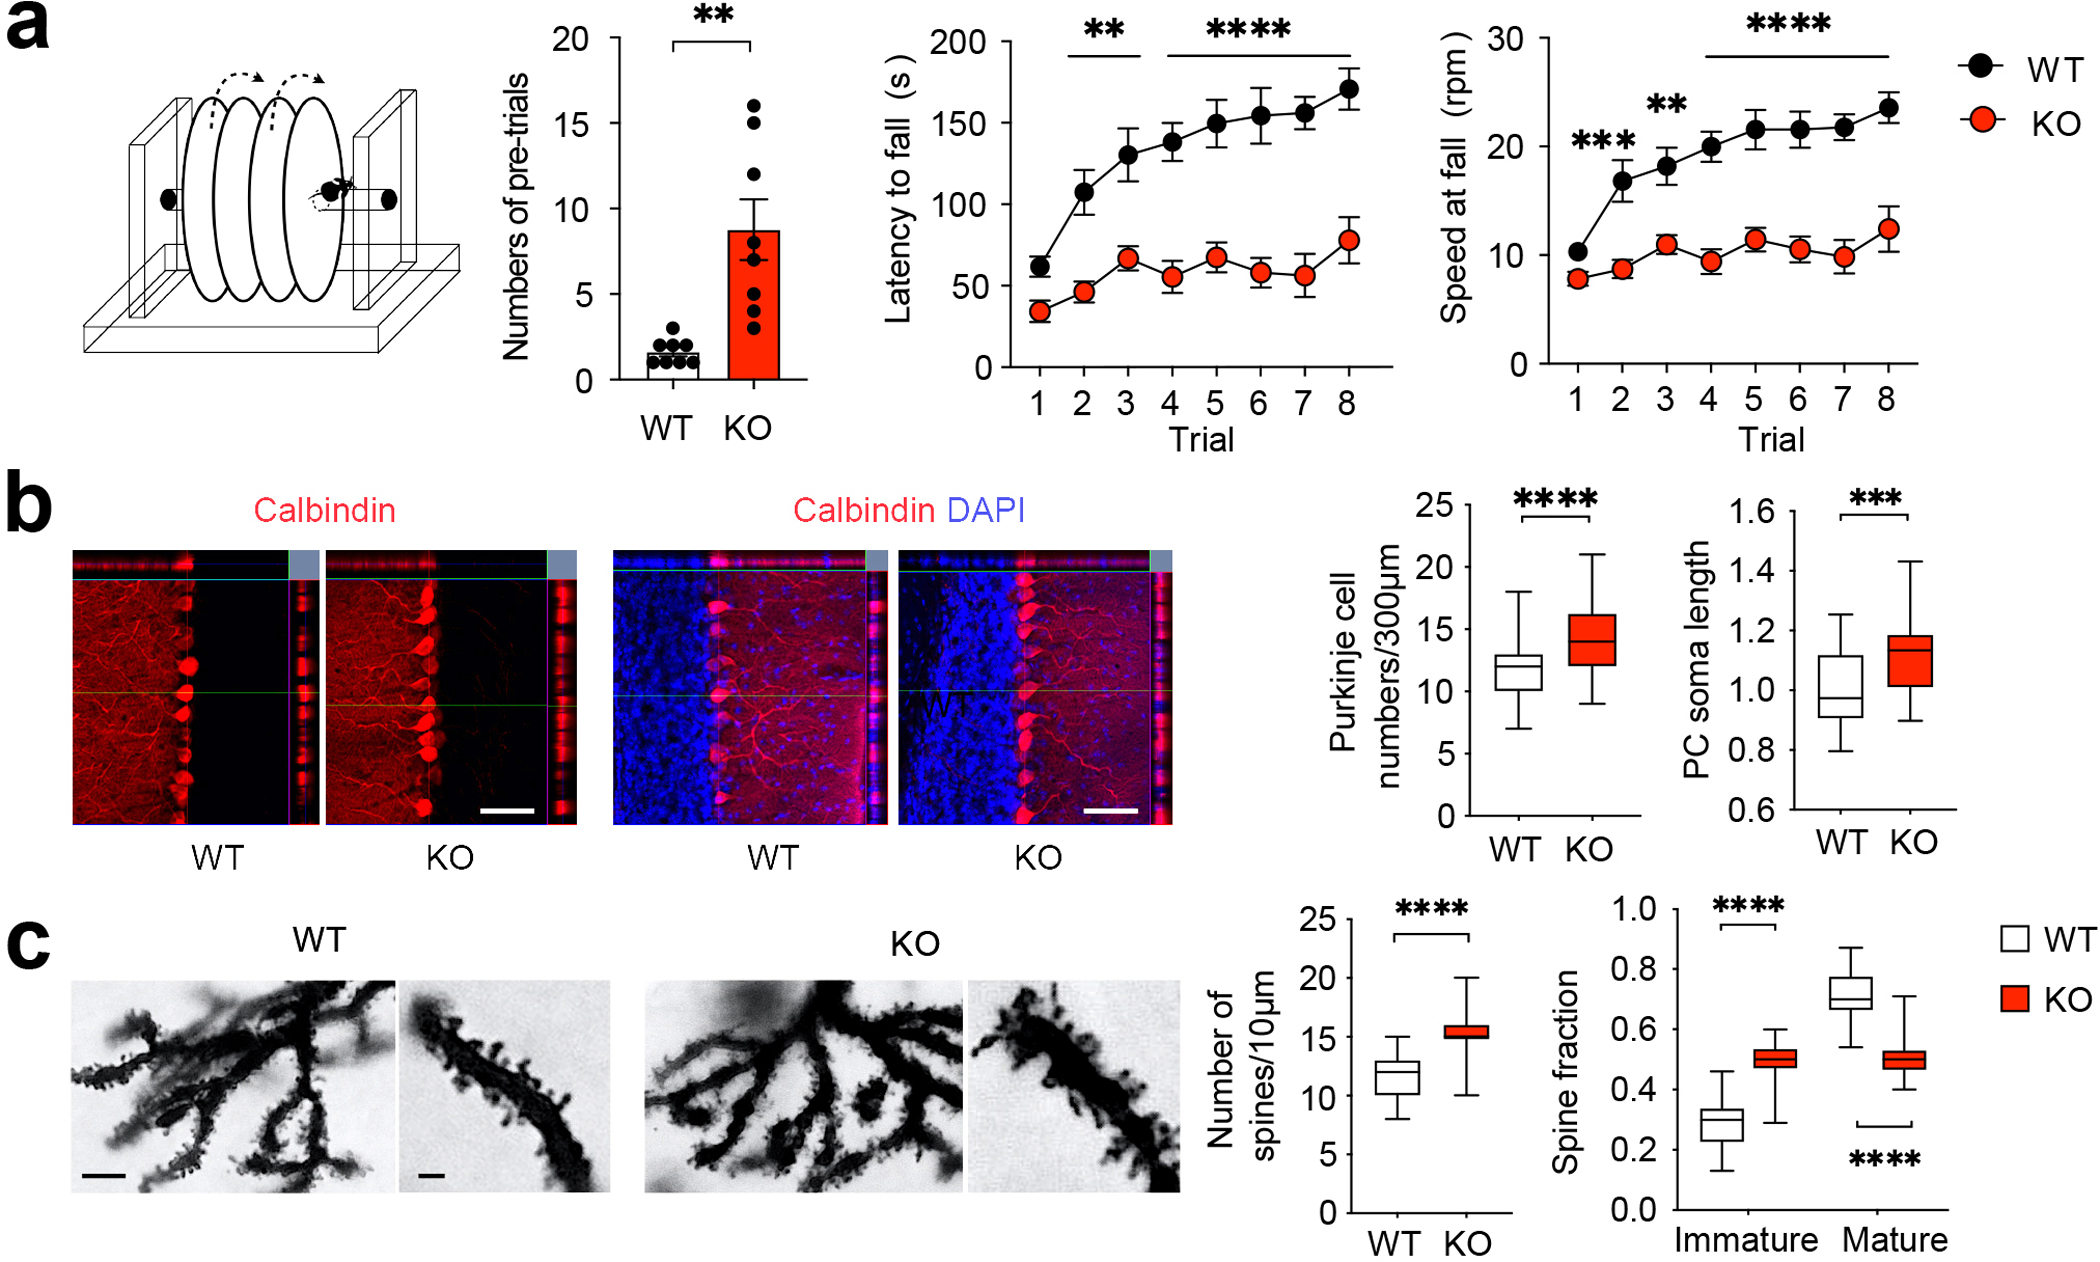
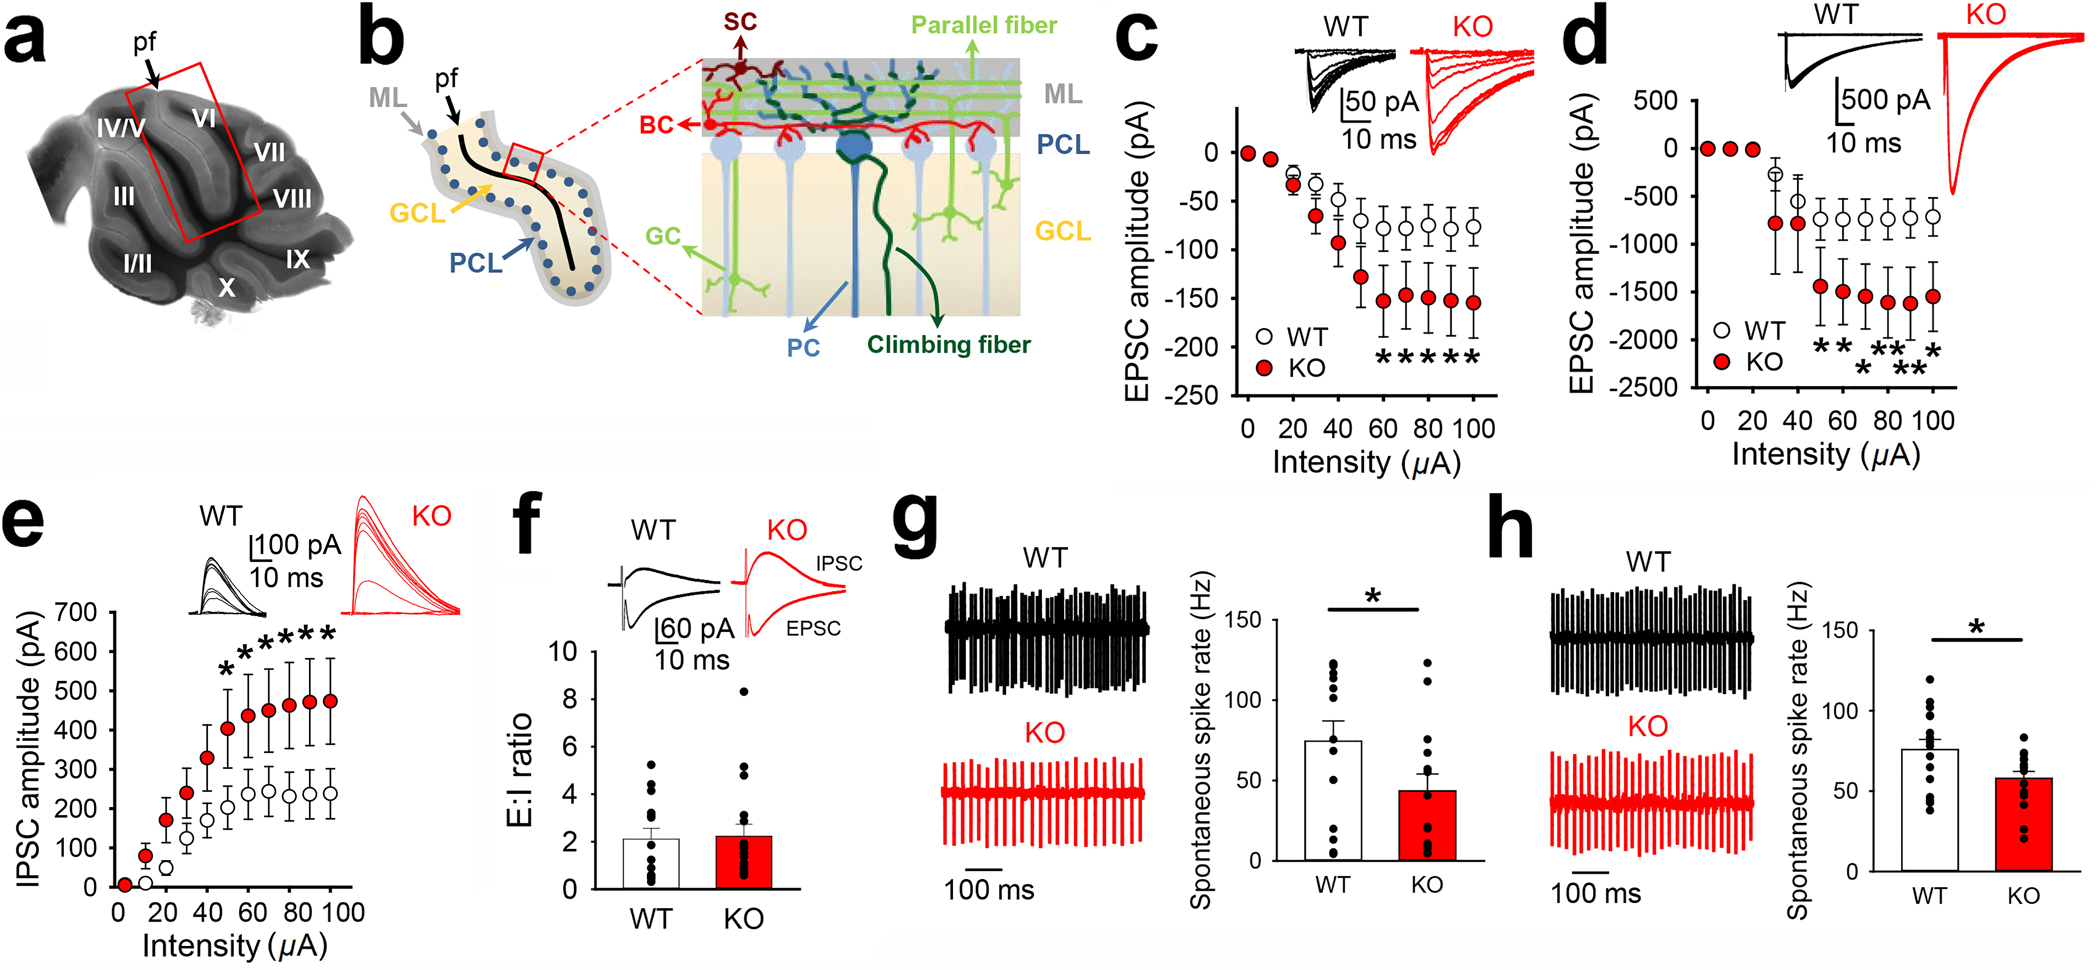
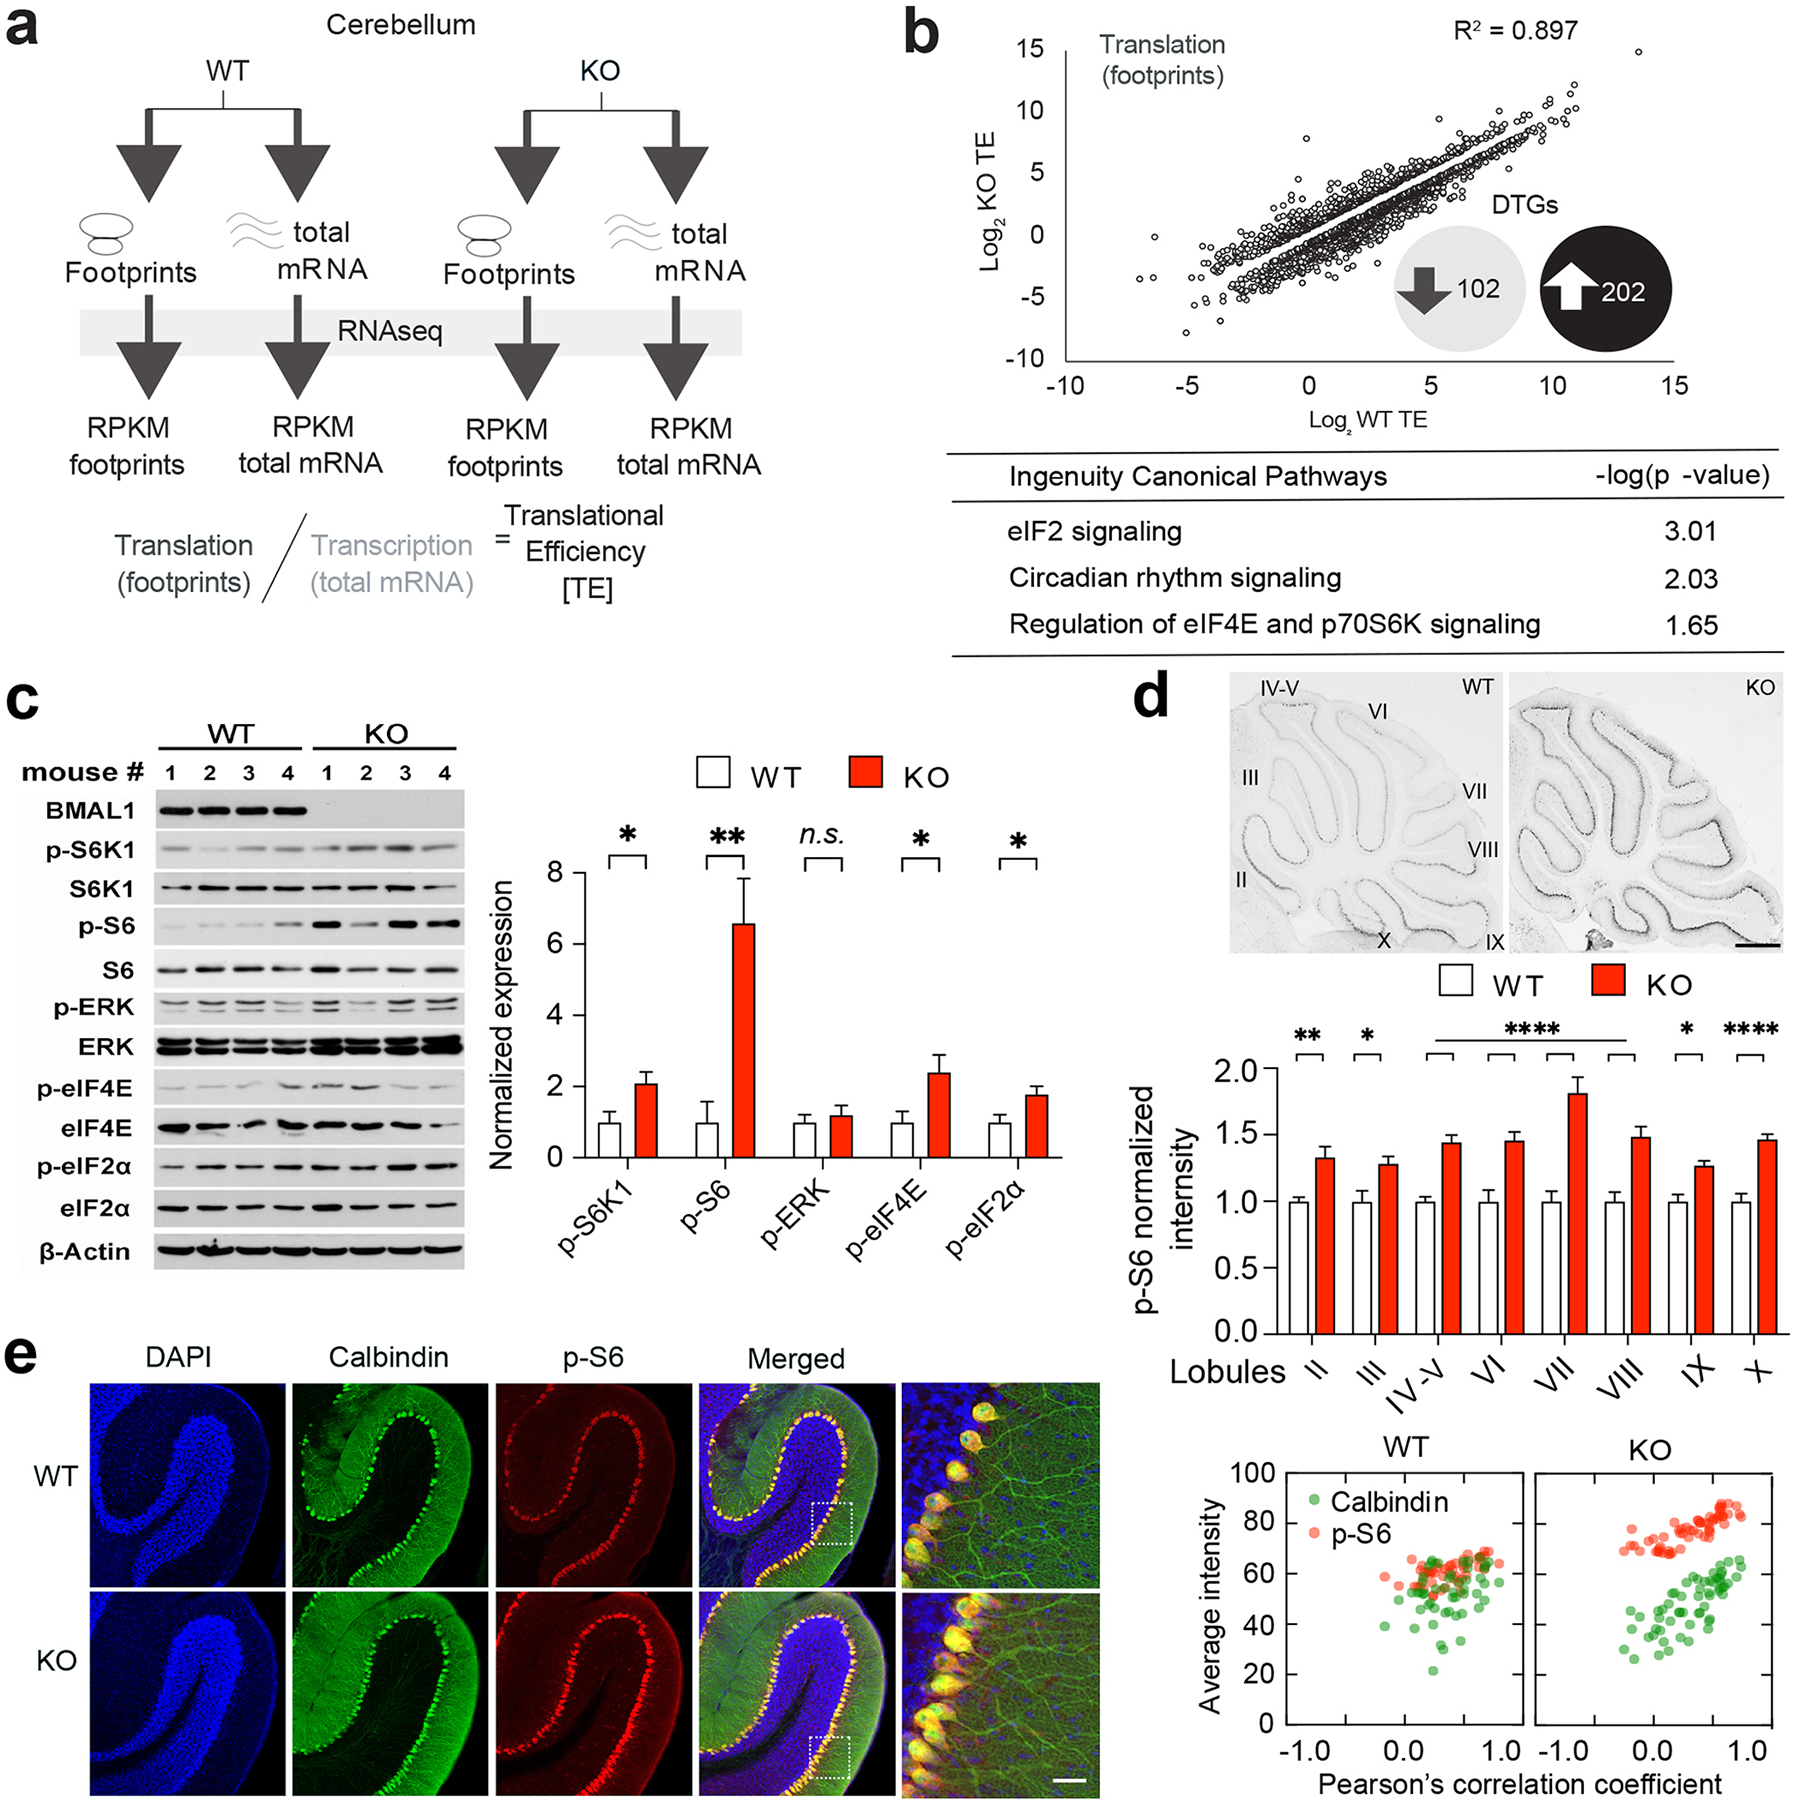
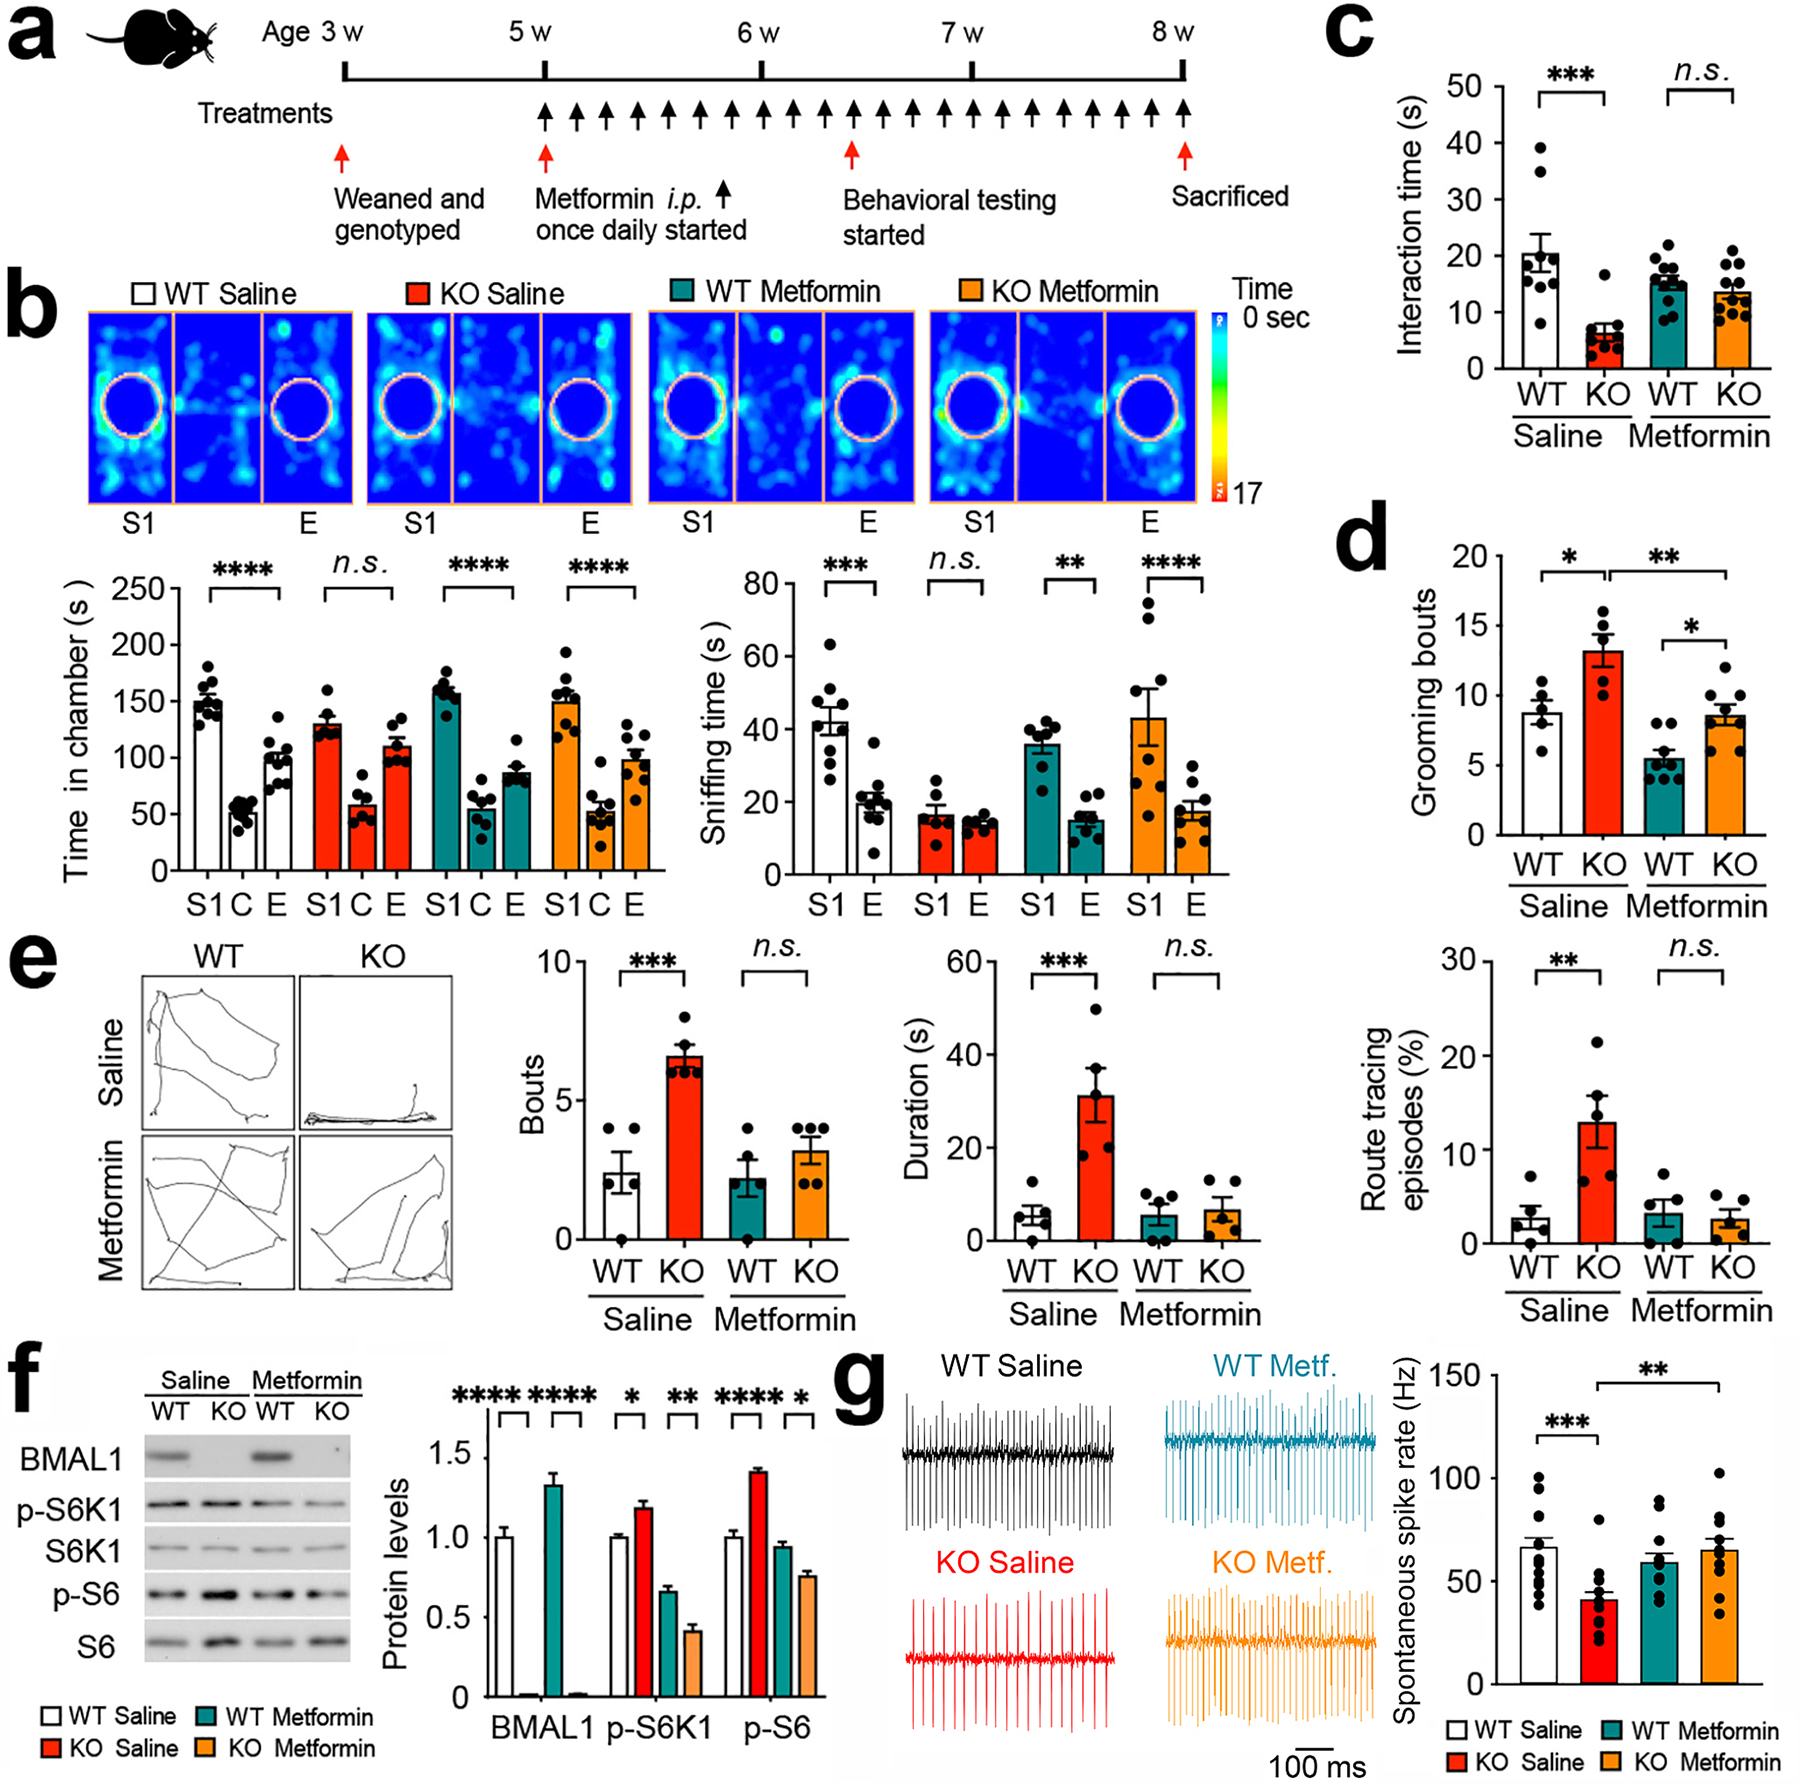
Although circadian and sleep disorders are frequently associated with autism spectrum disorders (ASD), it remains elusive whether clock gene disruption can lead to autistic-like phenotypes in animals. The essential clock gene Bmal1 has been associated with human sociability and its missense mutations are identified in ASD. Here we report that global Bmal1 deletion led to significant social impairments, excessive stereotyped and repetitive behaviors, as well as motor learning disabilities in mice, all of which resemble core behavioral deficits in ASD. Furthermore, aberrant cell density and immature morphology of dendritic spines were identified in the cerebellar Purkinje cells (PCs) of Bmal1 knockout (KO) mice. Electrophysiological recordings uncovered enhanced excitatory and inhibitory synaptic transmission and reduced firing rates in the PCs of Bmal1 KO mice. Differential expression of ASD- and ataxia-associated genes (Ntng2, Mfrp, Nr4a2, Thbs1, Atxn1, and Atxn3) and dysregulated pathways of translational control, including hyperactivated mammalian target of rapamycin complex 1 (mTORC1) signaling, were identified in the cerebellum of Bmal1 KO mice. Interestingly, the antidiabetic drug metformin reversed mTORC1 hyperactivation and alleviated major behavioral and PC deficits in Bmal1 KO mice. Importantly, conditional Bmal1 deletion only in cerebellar PCs was sufficient to recapitulate autistic-like behavioral and cellular changes akin to those identified in Bmal1 KO mice. Together, these results unveil a previously unidentified role for Bmal1 disruption in cerebellar dysfunction and autistic-like behaviors. Our findings provide experimental evidence supporting a putative role for dysregulation of circadian clock gene expression in the pathogenesis of ASD.


Conflict of interest statement

Conflict of interest

The authors declare no competing interests.

Figures

Figure 1.
Figure 1.. Bmal1 KO mice exhibit deficits in social interaction, excessive repetitive behaviors, and stereotypy.
(a) Three-chamber test for mouse sociability. Top: a schematic diagram and representative heat maps of a Bmal1 WT mouse and a Bmal1 KO mouse in the three-chamber test. S: stranger 1, C: center, E: empty. The heat map indicates time spent on the location. Bottom: bar graphs indicating time spent in individual chambers (left, F (2, 57) chamber × genotype = 8.735, P = 0.001, two-way ANOVA) and time spent sniffing wire cages (right, F (1, 38) chamber × genotype = 5.451, P = 0.025, two-way ANOVA) during the three-chamber test. Note that the KO mice spent similar time in the S chamber as in the E chamber (Bmal1 KO: S vs. E, P = 0.421, post hoc Bonferroni’s comparison). The KO mice also spent similar time sniffing S cage compared to the E cage (Bmal1 KO: S vs. E, P = 0.250, post hoc Bonferroni’s comparison). n = 10–11 mice/group. (b) Reciprocal social interaction test. Left: schematic diagram indicates the setup of the test. Middle: bar graphs indicating time spent on nose - anogenital sniffing (t (20) = 4.265, P = 0.0004, Student’s t-test) and nose - nose sniffing (t (20) = 1.685, P = 0.108, Student’s t-test). Right: time spent in interactions including push-crawling and following activities (t (20) = 3.277, P = 0.004, Student’s t-test). n = 11 mice/group. (c) Olfactory habituation test. A schematic diagram is shown on the left. Sniffing time is shown on the right. W: water, C: cinnamon, B: butter, S: social odor (dirty cage swabs). Notably, time spent sniffing the social odor was markedly reduced, whereas time sniffing non-social odors was not changed in the KO mice compared with the WT mice (F (11,55) odor × genotype = 7.168, P < 0.0001, two-way ANOVA). n = 6 mice/group. Data are presented as mean ± standard error of the mean (SEM). ****P < 0.0001. (d) Analysis of mouse grooming. Top: spontaneous grooming. A diagram is on the left and bar graphs are on the right indicating grooming bouts (t (17) = 3.514, P = 0.003, Student’s t-test) and time (t (17) = 0.341, P = 0.372, Student’s t-test). n = 9–10 mice/group. Bottom: water-puff induced grooming. A diagram is shown on the left and bar graphs on the right indicate grooming bouts (t (13) = 3.839, P = 0.002, Student’s t-test) and time (t (13) = 2.365, P = 0.034, Student’s t-test). n = 7–8 mice/group. (e) Analysis of route tracing behavior. Route tracing is defined as a mouse repeatedly following the same route for at least three times on the cage floor. Top: A diagram is shown on the left and trace maps of route tracing episodes (20s) are on the right. Bottom: bar graphs indicate numbers of bouts (t (15) = 3.010, P = 0.009, Student’s t-test), duration (t (15) = 3.786, P = 0.002, Student’s t-test), and percentage of time engaging in route tracing (t (15) = 3.833, P = 0.002, Student’s t-test). n = 8–9 mice/group. All data in (a), (b), (d) and (e) are presented as individual values and mean ± SEM. *P < 0.05, **P < 0.01, ***P < 0.001, ****P < 0.0001, n.s., not significant (Supplementary Fig. 1; see Supplementary Tab. 3 for detailed statistics).
Figure 2.
Figure 2.. Bmal1 KO mice exhibit motor learning deficits and pervasive pathological changes in the cerebellum.
(a) Mouse rotarod test. Left: A diagram of the rotarod test equipment. Middle: A bar graph indicates numbers of pre-trials (t (14) = 3.981, P = 0.001, Student’s t-test). Note that the Bmal1 KO mice required more pre-training trials before the rotarod test. Right: Line graphs indicate latencies to fall and speeds at fall. Note that the KO mice exhibited markedly shorter latency to fall and lower speed at falling. The performance in KO mice was not improved over the eight trials compared with the WT littermates (F (1,112) genotype = 169.7, P < 0.0001, two-way ANOVA). n = 8 mice/group. Data are shown as mean ± SEM. **P < 0.01, ****P < 0.0001. (b) Expression of Calbindin-D (28k), a Purkinje cell marker. Left: representative microscopic images of cerebellar lobule V immunolabeled for Calbindin-D (red) and counterstained by DAPI (blue). Scale bar = 50 μm. Right: quantitation of Purkinje cell density and soma length is shown in box plots. The whiskers indicate the range from minimum to maximum and the boxes indicate the range from the 25th to 75th percentiles. The lines in the box indicate the medians. Note that Purkinje cell density was increased in the KO cerebellum compared with WT cerebellum (t (103) = 5.493, P < 0.0001, Student’s t-test). n = 50–55 cells, 3–4 mice/group. (c) Golgi-Cox staining of Purkinje cells. Left: representative microscopic images of Golgi-Cox staining indicating dendritic morphology of Purkinje cells. Scale bar = 10 μm for low and 3 μm for high magnification images. Right: Quantitative analysis of density and morphology of dendric spines in box plots. The whiskers indicate the range from minimum to maximum and the boxes indicate the range from the 25th to 75th percentiles. The lines in the box indicate the medians. Note that the number of dendritic spines was increased (t (58) = 8.187, P < 0.0001, Student’s t-test), and more spines were of immature morphology in KO mice compared with WT mice (F (1,116) fraction × genotype = 155.5, P < 0.0001, immature fraction Bmal1 WT vs. Bmal1 KO: P < 0.0001, two-way ANOVA). n = 30 dendrite branches, 3 mice/group. ***P < 0.001, ****P < 0.0001 (Supplementary Fig. 2; see Supplementary Tab.3 for detailed statistics).
Figure 3.
Figure 3.. Aberrant synaptic transmission and firing activities in Purkinje cells (PCs) of Bmal1 KO mice.
(a) Differential interference contrast (DIC) image of a sagittal cerebellar section of a WT mouse with lobules labelled with roman numbers. PCs were recorded from lobules V and VI on both sides of the primary fissure (pf, framed region). (b) Schematic representation of lobules V and VI (left) and synaptic inputs onto PCs (right) (ML: Molecular layer, PCL: Purkinje cell layer, GCL: granule cell layer, GC: granule cells, PC: Purkinje cell, BC: basket cells, SC: stellate cells). (c) Input-Output relationships of excitatory postsynaptic currents (EPSCs) evoked by parallel fiber stimulation (WT, n = 10 cells; KO, n = 14 cells; two-way ANOVA with post hoc Bonferroni’s comparisons). Representative traces are shown in the top inset. (d) Input-Output relationships of EPSCs evoked by climbing fiber stimulation (WT, n = 9 cells; KO, n = 6 cells; two-way ANOVA with post hoc Bonferroni’s comparisons). Representative traces are shown in the top inset. (e) Input-Output relationships of IPSCs obtained at Vh = +35 mV (WT, n = 16; KO, n = 16; two-way ANOVA with Bonferroni post hoc analysis). Representative traces are shown in the top inset. (f) Synaptic excitation: inhibition ratio (E:I ratio) evoked by electrical stimulation of parallel fibers (WT, n = 14 cells; KO, n = 17 cells; Mann-Whitney test; P = 0.677). Representative traces are shown in the top inset. Note that EPSCs are going inwards and IPSCs are going outwards. (g) Cell-attached recordings of spontaneous action potential firing in PCs. No blockers were added to the artificial cerebrospinal fluid. Left: representative traces of a WT (top panel) and a KO (bottom panel) Purkinje cell. Right: Quantitative analysis of PC spike rates (WT, n = 14 cells; KO, n = 14 cells; t-test, one-tailed P = 0.036). (h) Cell-attached recordings of spontaneous action potential firing in PCs. Picrotoxin 50 μM, CNQX 20 μM and AP5 50 μM were added to the ACSF to block GABAA, AMPA and NMDA receptors, respectively. Left: representative traces of a WT (top panel) and a KO (bottom panel) Purkinje cell. Right: Quantitative analysis of PC spike rates (WT, n = 16 cells; KO, n = 16 cells; t-test, two-tailed P = 0.026). Data are presented as mean ± standard error of mean (SEM) in (c), (d), and (e). Data are presented as individual values and mean ± SEM in (f), (g), and (h). *P < 0.05, **P < 0.01 (Supplementary Fig. 3; see Supplementary Tab.3 for detailed statistics).
Figure 4.
Figure 4.. Altered translational landscape and dysregulated translational control pathways in the cerebellum of Bmal1 KO mice.
(a) A diagram indicates experimental design to assess genome-wide translational efficiency of mRNAs using ribosome profiling in whole cerebellum tissue. RPKM: Reads Per Kilobase of transcript per Million mapped reads. (b) Top: log2 Translational Efficiency (TE) Plots (P < 0.05 and 1.5 ≥ ratio ≥ 0.667; n = 2 mice/group for footprints and mRNA). DTGs: Differentially Translated Genes, R2: squared Pearson product-moment correlation coefficient. Bottom: Ingenuity Pathway Analysis (IPA) of DTGs. (c) Left: Immunoblots indicating activities of the mTORC1/S6K1, eIF2α, and ERK MAPK/p-eIF4E pathways in the cerebellum using phosphorylated S6K1, S6, eIF2α, ERK and eIF4E as indicators. β-actin was used as a loading control. Right: Quantitation of protein levels of phospho-S6K1 (t (6) = 2.604, P = 0.041), phospho-S6 (t (6) = 4.072, P = 0.007), phospho-eIF2α (t (6) = 2.618, P = 0.040), phospho-ERK (t (6) = 0.629, P = 0.553) and phospho-eIF4E (t (6) = 2.479, P = 0.048). Student’s t-test, n = 4 mice/group. (d) Top: Representative bright field microscopic images of sagittal cerebellar sections immunolabeled for phospho-S6. Scale bar = 500 μm. Bottom: Quantitation of phospho-S6 levels in different cerebellar lobules (F (7,224) lobule × genotype = 3.476, P = 0.002, two-way ANOVA). n = 15 sections, 3 mice/group. In (c) and (d), data are shown as mean ± SEM. *P < 0.05, **P < 0.01, ****P < 0.0001, n.s., not significant. (e) Left: Representative confocal microscopic images of cerebellar sections double immunolabeled for Calbindin-D(28k) (green) and phospho-S6 (p-S6, red). Cell nuclei were counterstained by DAPI (blue). Framed regions are magnified to the right. Scale bar = 20 μm. Right: cellular colocalization analysis of Calbindin-D(28k) and p-S6. n = 51–59 cells, 3 mice/group. Note that Calbindin-D(28k) and p-S6 were colocalized in the Purkinje cell soma and the p-S6 level was increased in the KO mice (Supplementary Figs. 4 and 5; see Supplementary Tab.3 for detailed statistics).
Figure 5.
Figure 5.. Metformin ameliorates behavioral deficits and reverses cerebellar mTORC1 hyperactivation in Bmal1 KO mice.
(a) A diagram indicating the paradigm used for metformin treatment and tests. Metformin (200 mg/kg, i.p.) or saline (10 μl × body weight in grams, i.p.) was administered once a day at ZT 20 (8 h after light-off) for 10 d to Bmal1 WT and KO mice. Behavioral tests were started at Day 11. Metformin treatment was continued throughout the tests. (b) Three-chamber tests for mouse sociability. Top: Representative heat maps indicating time spent on the location from the four groups. S1: stranger 1, E: empty. Bottom: bar graphs indicate time spent in chambers and in sniffing. Note that metformin treatment reversed the sociability deficits in the Bmal1 KO mice (Bmal1 KO Saline: S1 vs. Empty, P > 0.99; Bmal1 KO Metformin: S1 vs. Empty, P < 0.0001, two-way ANOVA and post hoc Bonferroni’s comparison). n = 6–9 mice/group. (c) Reciprocal social tests. Bar graphs indicate time spent in social interactions. Note that metformin treatment significantly increased the interaction time in KO mice (push-crawl and following) (F (3,35) = 7.672, P = 0.0005, Bmal1 WT Metformin vs. Bmal1 KO Metformin: P = 0.931, one-way ANOVA). n = 8–11 mice/group. (d) Spontaneous grooming analysis. Note that metformin treatment decreased the number of grooming bouts in the Bmal1 KO mice (F (3,22) = 14.660, P < 0.0001, Bmal1 KO Saline vs. Bmal1 KO Metformin: P = 0.004, one-way ANOVA). n = 5–8 mice/group. (e) Route tracing analysis. Left: Trace maps of route tracing episodes (20s). Right: Three bar graphs indicate that metformin treatment significantly decreased the number of bouts, duration, and percentage of time engaging in route tracing in Bmal1 KO mice (Bmal1 WT Metformin vs. Bmal1 KO Metformin: P > 0.999). n = 5 mice/group. (f) Left: representative western blots indicate decreased levels of phospho-S6K1 and phospho-S6 after metformin treatment in the cerebellum of Bmal1 KO mice. Right: Quantitative analysis of the blots. n = 3 mice/group. (g) Cell-attached recordings of spontaneous action potential firing in PCs. Picrotoxin 50 μM, CNQX 20 μM and AP5 50 μM was added to the ACSF to block GABAA, AMPA and NMDA receptors, respectively. Left: representative traces from a Purkinje cell in each group. Right: Quantitative analysis of PC spike rates (WT saline, n = 16; KO saline, n = 15; WT metformin, n = 12; KO metformin, n = 11; one-way ANOVA with post hoc Bonferroni’s comparisons). Data are shown as mean ± SEM. *P < 0.05, **P < 0.01, ***P < 0.001, ****P < 0.0001. n.s., not significant (Supplementary Fig. 6; see Supplementary Table 3 for detailed statistics).
Figure 6.
Figure 6.. Conditional deletion of Bmal1 in cerebellar Purkinje cells leads to autistic-like behavioral and cellular changes in Bmal1flx/flx: L7-Cre mice.
(a) Three-chamber test for mouse social behavior. Left: Representative heat maps of a Bmal1flx/flx mouse and a Bmal1flx/flx::L7-Cre mouse in the three-chamber social novelty test. The heat maps indicate time spent on the location. S1: stranger 1, S2: stranger 2. Right: bar graphs indicating time spent in individual chambers (F (2, 57) chamber × genotype = 4.997, P = 0.01, two-way ANOVA) and time spent sniffing wire cages (F (1,38) chamber × genotype = 2.191, P = 0.147, two-way ANOVA) during the three-chamber test. S1: stranger 1, C: center, S2: stranger 2. Note that the Bmal1flx/flx mice spent a longer time in the S2 chamber compared with the S1 chamber and a longer time sniffing the S2 cage compared with the S1 cage. In contrast, the Bmal1flx/flx::L7-Cre mice spent similar time in the S1 chamber as in the S2 chamber (S1 vs. S2, P = 0.190) and similar time sniffing S1 cage compared to the S2 cage (S1 vs. S2, P > 0.999, post hoc Bonferroni’s comparison). n = 9–12 mice/group. (b) Analysis of mouse grooming. Bar graphs indicate that the total grooming time (t (18) = 2.469, P = 0.024, Student’s t-test) and the number of grooming bouts (t (13) = 3.356, P = 0.004, Student’s t-test) were increased in the Bmal1flx/flx::L7-Cre mice compared with the Bmal1flx/flx mice. n = 10 mice/group. (c) Marble burying test. The bar graph indicates that the total number of buried marbles was increased in the Bmal1flx/flx::L7-Cre mice compared with the Bmal1flx/flx mice (t (20) = 4.127, P = 0.0005, Student’s t-test). n = 10–12 mice/group. (d) Mouse rotarod test. The line graph on the left indicates the time latency to fall and the graph on the right indicates the rotating speed at fall. Note that the Bmal1flx/flx::L7-Cre mice exhibited shorter latencies to fall (F (1,66) genotype = 16.64, P = 0.0001, two-way ANOVA) and fell at lower speeds (F (1,25) genotype = 16.75, P = 0.0004, two-way ANOVA). n = 4–5 mice/group, 3 trials/day. (e) Representative confocal microscopic images of cerebellar lobule V immunolabeled for Calbindin-D(28k) (green) and Bmal1 (red). Cell nuclei were counterstained by DAPI (blue). Scale bar = 50 μm. Numbers of Bmal1 positive PCs are shown to the right. (f) Input-Output relationships of EPSCs evoked by parallel fiber stimulation (Bmal1flx/flx, n = 16; Bmal1flx/flx::L7-Cre, n = 11; two-way ANOVA with Bonferroni post hoc analysis). Representative traces are shown in the top inset. (g) Input-Output relationships of IPSCs obtained at a Vh = +35 mV (Bmal1flx/flx, n = 13; Bmal1flx/flx::L7-Cre, n = 13; two-way ANOVA with Bonferroni post hoc analysis). Representative traces are shown in the top inset. (h) Cell-attached recordings of PCs spontaneous action potential firing. Picrotoxin 50 μM, CNQX 20 μM and AP5 50 μM is added to the ACSF in order to block GABAA, AMPA and NMDA receptors, respectively. Left: representative traces of a WT (top panel) and a KO (bottom panel) Purkinje cell. Right: Quantitative analysis of Purkinje cell spontaneous action potential firing (Bmal1flx/flx, n = 16; Bmal1flx/flx::L7-Cre, n = 17; t-test, one-tailed p = 0.0300). (i) Left: Representative bright field microscopic images of sagittal cerebellar sections immunolabeled for phospho-S6. Scale bar = 500 μm. Right: Quantitation of phospho-S6 levels in different cerebellar lobules (F (1,128) genotype =299.6, P < 0.0001, two-way ANOVA). n = 9 sections, 3 mice/group. (j) Golgi-Cox staining of Purkinje cell dendrites. Left: representative microscopic images indicating dendritic morphology of Purkinje cells. Scale bar = 10 μm. Right: Box plots indicate quantitative analysis of density and morphology of dendric spines. Note that the number of dendritic spines was increased (t (102) = 3.213, P = 0.002, Student’s t-test), and more spines exhibited immature morphology in the Bmal1flx/flx::L7-Cre mice compared with the Bmal1flx/flx mice (F (1,204) fraction × genotype = 17.93, P < 0.0001, immature fraction Bmal1flx/flx vs. Bmal1flx/flx:: L7-Cre: P = 0.016, two-way ANOVA). n = 48–56 dendrite branches, 4 mice/group. Data are presented as mean ± SEM with or without individual values. *P < 0.05, **P < 0.01, ***P < 0.001, ****P < 0.0001, n.s., not significant. (Supplementary Fig. 7; see Supplementary Tab.3 for detailed statistics).

References

    1. Herzog ED, Hermanstyne T, Smyllie NJ, Hastings MH. Regulating the Suprachiasmatic Nucleus (SCN) Circadian Clockwork: Interplay between Cell-Autonomous and Circuit-Level Mechanisms. Cold Spring Harb Perspect Biol 2017; 9(1). - PMC - PubMed
    1. Takahashi JS, Hong HK, Ko CH, McDearmon EL. The genetics of mammalian circadian order and disorder: implications for physiology and disease. Nat Rev Genet 2008; 9(10): 764–775. - PMC - PubMed
    1. Rosbash M The implications of multiple circadian clock origins. PLoS Biol 2009; 7(3): e62. - PMC - PubMed
    1. Bunger MK, Wilsbacher LD, Moran SM, Clendenin C, Radcliffe LA, Hogenesch JB et al. Mop3 is an essential component of the master circadian pacemaker in mammals. Cell 2000; 103(7): 1009–1017. - PMC - PubMed
    1. Lai MC, Lombardo MV, Baron-Cohen S. Autism. Lancet 2014; 383(9920): 896–910. - PubMed

MeSH terms

Substances