. 2022 Mar;8(3):245-256.
doi: 10.1038/s41477-022-01108-y. Epub 2022 Mar 17.

Targeted introduction of heritable point mutations into the plant mitochondrial genome

Affiliations

Targeted introduction of heritable point mutations into the plant mitochondrial genome

Joachim Forner et al. Nat Plants. 2022 Mar.

Abstract

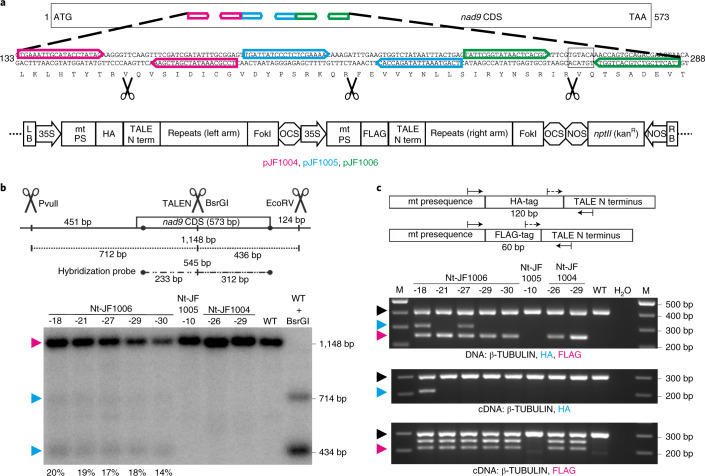
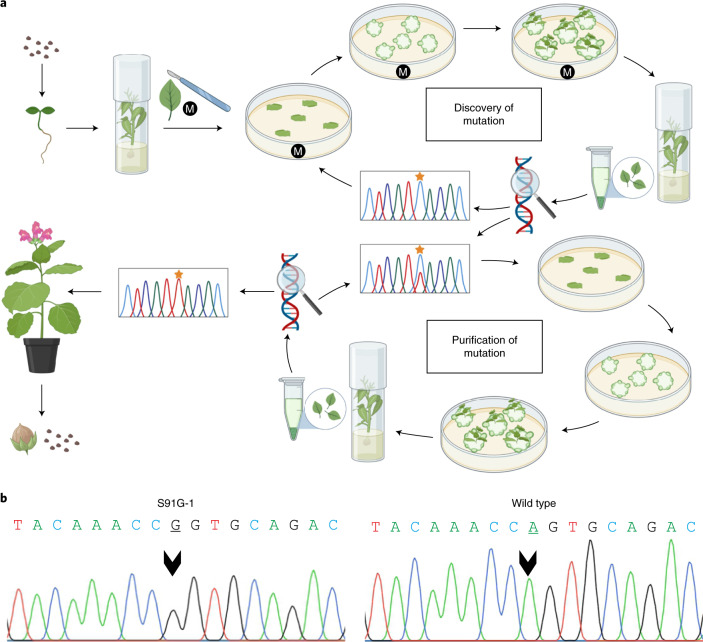
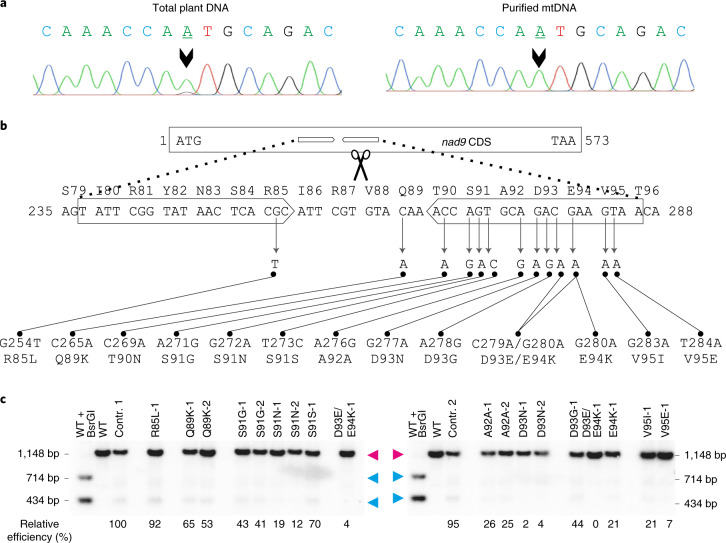
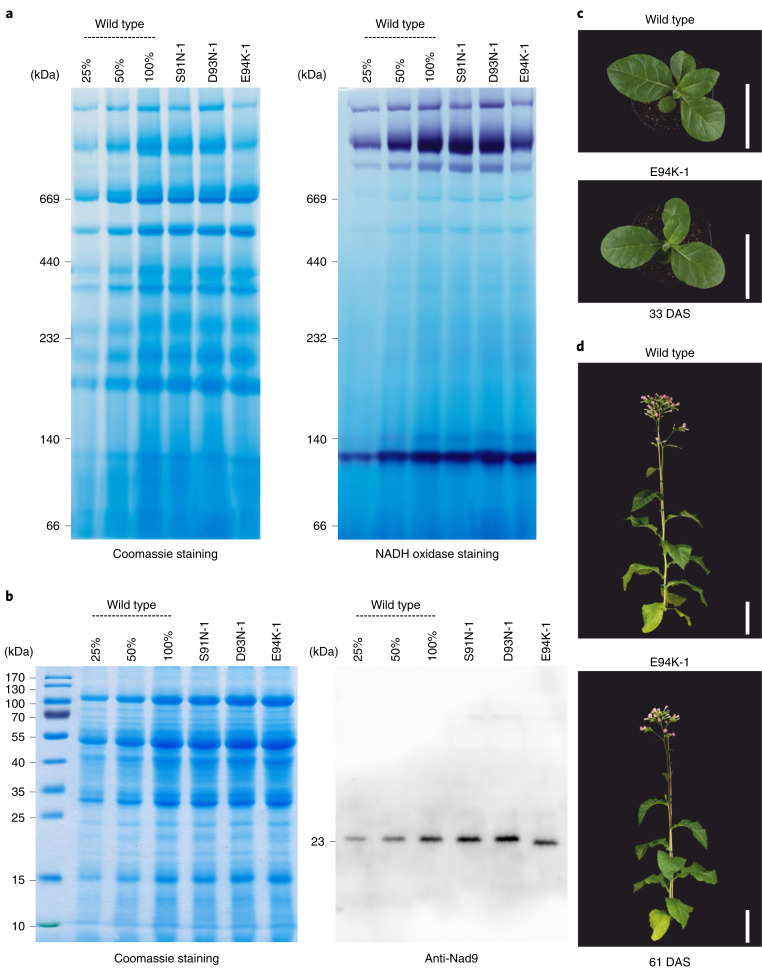
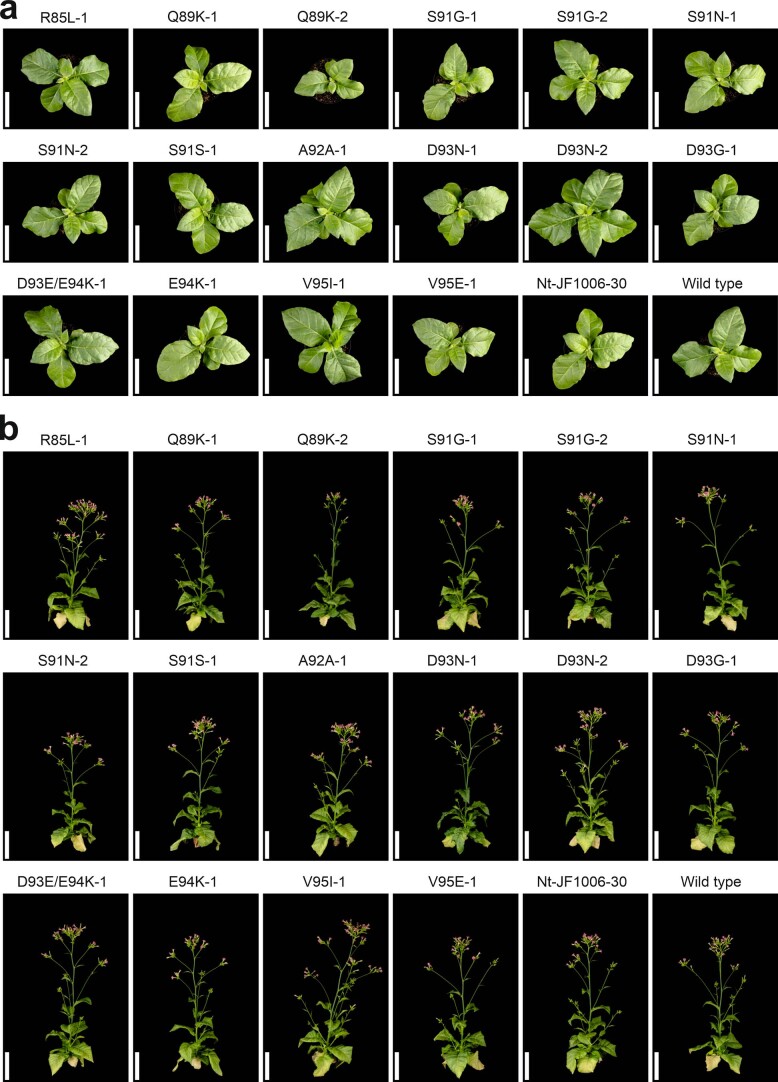
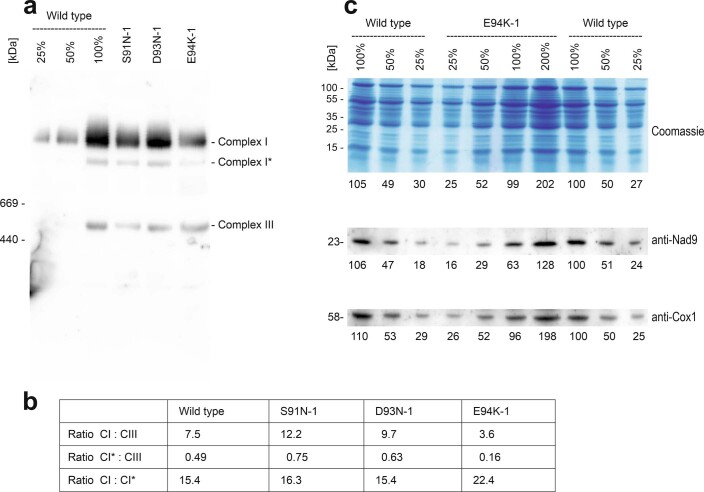
The development of technologies for the genetic manipulation of mitochondrial genomes remains a major challenge. Here we report a method for the targeted introduction of mutations into plant mitochondrial DNA (mtDNA) that we refer to as transcription activator-like effector nuclease (TALEN) gene-drive mutagenesis (GDM), or TALEN-GDM. The method combines TALEN-induced site-specific cleavage of the mtDNA with selection for mutations that confer resistance to the TALEN cut. Applying TALEN-GDM to the tobacco mitochondrial nad9 gene, we isolated a large set of mutants carrying single amino acid substitutions in the Nad9 protein. The mutants could be purified to homochondriomy and stably inherited their edited mtDNA in the expected maternal fashion. TALEN-GDM induces both transitions and transversions, and can access most nucleotide positions within the TALEN binding site. Our work provides an efficient method for targeted mitochondrial genome editing that produces genetically stable, homochondriomic and fertile plants with specific point mutations in their mtDNA.


Conflict of interest statement

The authors declare no competing interests.

Figures

Fig. 1
Fig. 1. Generation of transgenic tobacco lines expressing TALENs targeted to the mitochondrial nad9 locus.
a, Binding sites of the three designed TALEN pairs in the nad9 coding sequence (CDS) and schematic view of the binary vectors used for plant transformation. The nucleotide positions refer to the start codon (ATG = 1). The scissors indicate the predicted TALEN cut sites; the BsrGI restriction site is boxed. LB/RB, T-DNA left/right borders; 35S, CaMV 35S promoter; mt PS, mitochondrial presequence (from the Arabidopsis IVD protein); HA, 3xHA-tag; TALE N term, TALE amino terminus; Repeats, TALE DNA-binding units; FokI, endonuclease domain; OCS, octopine synthase terminator (Agrobacterium); FLAG, 3xFLAG-tag; NOS (octagon), nopaline synthase terminator (Agrobacterium); nptII (kanR), neomycin phosphotransferase II encoding kanamycin resistance; NOS (arrow), nopaline synthase promoter (Agrobacterium). The coloured arrows indicate TALEN binding sites. b, Detection of TALEN activity by Southern blot analysis. The predicted sizes of hybridizing restriction fragments and the location of the probe are depicted. The scissors mark the cut sites of the restriction enzymes PvuII, EcoRV and BsrGI, and of the pJF1006-encoded TALEN pair. BsrGI cuts 2 bp away from the predicted TALEN cut site. In addition to PvuII and EcoRV, BsrGI was included in a digestion reaction with wild-type DNA (WT + BsrGI; right) to simulate the TALEN cut. The numbers below the gel give the relative intensities of the TALEN cleavage products. The arrowheads mark the positions of the three expected signals (magenta indicates uncut; cyan indicates TALEN-cut). c, PCR and RT–PCR assays to test for the presence of TALEN arms in the lines shown in b. The binding sites of the PCR primers are shown in the upper panel (the dashed lines are for RT–PCR primers), and the lower panels display the PCR results. A sequence from the β-TUBULIN gene was amplified as an internal control. The arrowheads indicate the expected sizes for β-TUBULIN (black, 412 bp/303 bp for DNA/cDNA), the HA arm (cyan, 311 bp/210 bp) and the FLAG arm (magenta, 251 bp/212 bp). H2O, water control; M, DNA size marker. Only the FLAG–TALEN arm is present in Nt-JF1006-30. Pools of kanamycin-resistant T1 seedlings obtained by selfing were used for the nucleic acid extractions. See also Extended Data Fig. 4. The experiments in b and c were performed once.
Fig. 2
Fig. 2. Workflow for the isolation of tobacco lines with TALEN-induced point mutations in the mitochondrial nad9 gene.
a, Schematic overview of the experimental procedures. Transgenic plants with confirmed TALEN activity (Extended Data Fig. 1) were raised from seeds, and leaves were harvested, cut into pieces and placed onto shoot induction medium. Leaves from regenerated shoots were genotyped for mutations in nad9 (‘Discovery of mutation’). If no mutation was detected, a new regeneration round was initiated. When a point mutation was found, an additional regeneration round was conducted to promote genome segregation and facilitate the isolation of homochondriomic lines (‘Purification of mutation’). Homochondriomic mutant shoots were rooted and transferred to the greenhouse for seed production. In some experiments, the mutagens (M) EtBr or NEU were added to the shoot induction medium or applied during seed imbibition. See the text, the Methods and the Supplementary Methods for the details. b, Exemplary sequencing chromatograms showing the successful isolation of a homochondriomic nad9 mutant carrying a Ser-to-Gly exchange in amino acid position 91 of the Nad9 protein (corresponding to an A-to-G substitution in nucleotide position 271 of the nad9 reading frame). The mutated position is indicated by arrowheads in the sequencing chromatograms of the S91G-1 mutant line and the wild type. The sequencing primer was oJF271 (Supplementary Table 2).
Fig. 3
Fig. 3. Apparent heterochondriomy, locations of the TALEN-induced point mutations in nad9 and effects of the point mutations on TALEN cleavage activity.
a, Genotyping of an S91N-1 mutant plant carrying the G272A mutation. Sequencing of PCR products amplified from total plant DNA (with primers oJF271 and oJF272; Supplementary Table 2) suggested persistent heteroplasmy (that is, the presence of residual copies of wild-type nad9 alleles), as evidenced by an A + G double peak (arrowhead, left sequence). However, when the same PCR product was generated from purified mtDNA as a template, a clean single A peak is seen (right sequence). The sequencing was done with primer oJF271. b, Overview of all TALEN-induced mutations obtained in nad9. The nucleotide positions in the nad9 coding sequence (ATG = 1) and the amino acid positions in the Nad9 protein are given. The block arrows denote the pJF1006 TALEN binding sites. The ‘left’ (HA-)TALEN (not present in line Nt-JF1006-30) extends from nucleotide positions 237 to 255 and the ‘right’ (FLAG-)TALEN from positions 268 to 286. The scissors point to the predicted TALEN cut site. c, Analysis of TALEN cleavage activity by Southern blotting using pools of kanamycin-resistant seedlings (from back-crosses of the original mutants with the wild type). The same restriction enzymes and hybridization probe as in Fig. 1b were used, but electrophoretic separation was done in a 2% agarose gel. To determine the relative cutting efficiencies, the percentage of cut nad9 was calculated for each lane and then divided by the respective value for control line 1 (contr. 1). The smaller of the two nad9 cleavage products was used for quantification, because it is covered by a larger portion of the hybridization probe. Contr. 1 and contr. 2 are descendants of Nt-JF1006-30 plants having gone through the same mutagenesis procedure as the point mutants, but retaining a wild-type nad9 sequence. Line D93E/E94K-1 is represented twice (descendants of two different vegetative clones of the original mutant plant). The full Southern blot with enhanced contrast settings is presented in Extended Data Fig. 5. Unlike all other mutants, line R85L-1 may not be the result of a gene drive effect. A technical replicate of the Southern blot yielded similar results.
Fig. 4
Fig. 4. Biochemical characterization and phenotypes of mitochondrial nad9 mutants.
a, Analysis of mitochondrial protein complexes and NADH oxidase (complex I) staining in selected nad9 mutants by blue-native polyacrylamide gel electrophoresis (BN–PAGE). Protein sizes are given in kDa. A dilution series of the wild-type sample (25%, 50% and 100%) was loaded to allow for semiquantitative assessment of protein accumulation. A technical replicate of the BN–PAGE (stained with Coomassie) yielded similar results; the NADH oxidase (complex I) staining was performed once. b, Accumulation and electrophoretic mobility of Nad9 proteins in nad9 mutants assessed by SDS–PAGE. Note the faster migration of the E94K variant of Nad9. The Coomassie-stained gel is shown to confirm equal loading. The SDS–PAGE (including Coomassie staining) was done seven times and the anti-Nad9 western blot five times (technical replicates), with similar results (see also Extended Data Fig. 9). c, Plant phenotypes. Plants were grown on soil and cultivated in long-day conditions in the greenhouse. A wild-type plant and an E94K-1 mutant plant (harbouring a G280A mutation in nad9) are shown. The photographs were taken 33 days after sowing (DAS). Scale bars, 10 cm. d, Plants photographed 61 DAS. Scale bars, 20 cm.
Fig. 5
Fig. 5. Determination of gas exchange rates and photosynthetic parameters of two mitochondrial mutants grown at 350 µE m−2 s−1 light intensity in a controlled-environment chamber.
a, Light response curves of assimilation of plants measured at 400 ppm and 2,000 ppm CO2 concentration, and stimulated respiration during the first minutes after the end of illumination with saturating actinic light. b, Photosynthetic parameters, measured only at 400 ppm CO2 concentration. Nt-JF1006-30 served as the TALEN control harbouring the unaltered nad9 allele. NPQ, non-photochemical quenching; qL, measure of the redox state of the photosystem II (PSII) acceptor side; Y(NO), measure of the non-regulated thermal dissipation of excitation energy, an indicator of PSII photoinhibition (if increased); Y(ND), measure of the donor side limitation of PSI by linear electron transport; Y(NA), measure of the acceptor side limitation of PSI by the Calvin–Benson cycle and other downstream metabolic reactions. For the wild type and the TALEN-control line Nt-JF1006-30, n = 6 biological replicates (independent plants) were measured. For the single mutant E94K-1 and the double mutant D93E/E94K-1, n = 5 independent plants (biological replicates) were measured, except for the assimilation measurements at 2,000 ppm CO2 for the single mutant E94K-1, where n = 4 biological replicates were analysed. The youngest fully expanded leaves were analysed. The average values and standard deviations are shown. Where the error bars are not visible, the standard deviation was smaller than the size of the symbol.
Extended Data Fig. 1
Extended Data Fig. 1. Isolation of TALEN-expressing lines.
The workflow illustrating the procedures involved in the generation of transgenic TALEN-expressing lines and the detection of TALEN cleavage activity in the mitochondrial genome is schematically shown. Tobacco leaves are transformed with Agrobacterium tumefaciens cells harboring TALEN-encoding plasmids. Putative transgenic T0 shoots are regenerated on medium containing kanamycin, rooted and transferred to the greenhouse. DNA is isolated from these plants and assayed by Southern blotting for TALEN activity (that is, cleavage of nad9). Individual T1 seedlings derived from these plants (and selected for kanamycin resistance) are screened again for TALEN activity and then used for T2 seed production. The blue-white pill indicates presence of kanamycin in the medium.
Extended Data Fig. 2
Extended Data Fig. 2. Southern blot analyses to identify lines with stable functional TALEN expression.
For details, see Fig. 1b. (a) The blots in the upper panel show the full screen of all transgenic plants obtained with the three TALEN constructs. Pools of approximately ten kanamycin-resistant T1 seedlings were used for DNA extraction. Candidate lines showing a hybridization pattern consistent with TALEN cleavage activity are marked by black arrows. (b) Analysis of additional T1 descendants of four candidate T0 lines. Each lane represents a pool of two individual plants. The 1148 bp fragment (nad9 not cut by TALENs) is marked by a cyan arrowhead, the two fragments resulting from the TALEN cut (712 bp and 436 bp) are indicated by magenta arrowheads. All Southern blots shown here were performed once.
Extended Data Fig. 3
Extended Data Fig. 3. Detection of TALEN-induced DNA double-strand breaks.
(a) End-mapping strategy to verify that the TALENs cut at the predicted sites. Arrows indicate oligonucleotides or primer-binding sites. mtDNA cut by the TALENs in vivo is blunted by mung bean exonuclease in vitro, followed by adapter ligation and PCR amplification. Note that PCR 2 is a half-nested PCR using the products of PCR 1 as template. P, 5’ monophosphate group of oligonucleotides. (b) PCR results obtained from execution of the strategy depicted in panel (a). Arrows indicate the expected sizes of products derived from TALEN-cut mtDNA. Cyan arrow, expected size (270 bp) of the amplification product of upstream site PCR 1; magenta arrow, expected product size (350 bp) for downstream site PCR 1; green arrow, expected amplicon size (192 bp) for upstream site PCR 2; orange arrow, expected amplicon size (288 bp) for downstream site PCR 2; line-30, line Nt-JF1006-30; WT, wild-type control; H2O, water control; M, DNA size marker. One of two similar experiments with similar results is shown. (c) Sequencing chromatograms for the products of PCR 2. The chromatograms show the DNA sequence obtained from sequencing the PCR products marked by the green (upstream site) and orange (downstream site) arrows, respectively, in panel (b). For comparison, the sequences of the adapter oligonucleotide duplex and the nad9 TALEN target site are also given (boxed). Black arrows indicate the direction of the sequencing reactions.
Extended Data Fig. 4
Extended Data Fig. 4. Tests for presence of HA- and FLAG-TALEN arms, and analysis of nad9 expression in a subset of Nt-JF1004, Nt-JF1005 and Nt-JF1006 lines.
(a) Extension of the analyses shown in Fig. 1c to a larger set of plants. See legend to Fig. 1c for details. (b) Analyses of the same plants as shown in (a) by amplification of full-length nad9 cDNA with primers oJF311 and oJF748 (yielding a product of 769 bp, indicated by the green arrowhead; left panel) for subsequent analysis by Sanger sequencing, and partial nad9 cDNA with primers oJF496 and oJF748 (465 bp, indicated by the green arrowhead; right panel) and full-length atp9 cDNA with primers oJF1145 and oJF748 (568 bp, purple arrowhead) for semiquantitative analysis of expression strength. Primers for first strand cDNA synthesis were oJF1113 (nad9) and oJF1144 (atp9). Sequencing analyses showed all full-length nad9 RT-PCR products to be fully edited and free of mutations. The loading scheme is identical for all five gels. For primer sequences, see Extended Data Table 2. The experiments shown in (a) and (b) were performed once.
Extended Data Fig. 5
Extended Data Fig. 5. Southern blot from Fig. 3c shown with enhanced contrast to better visualize weak hybridization signals.
M, DNA size marker (with the 800 bp marker fragment cross-hybridizing to the probe).
Extended Data Fig. 6
Extended Data Fig. 6. Read coverage across the whole mitochondrial genome in next-generation sequencing experiments.
The mitochondrial genomes of mutant lines D93N-1, E94K-1 and S91N-1 were sequenced. Nucleotide positions [bp] on the x-axis are according to the tobacco mitochondrial reference genome sequence (NC_006581). The y-axis shows the number of reads per position. Upper panel: D93N-1 (black), middle panel: E94K-1 (blue), lower panel: S91N-1 (red). The arrow indicates the position of nad9.
Extended Data Fig. 7
Extended Data Fig. 7. Phenotypes of the full set of nad9 mutant plants.
(a) Photographs taken 33 days after sowing. Plants were raised from seeds, pre-grown for 30 days in a nursery chamber, and then transferred to the greenhouse. Line names indicate the amino acid substitutions in Nad9. Scale bars: 10 cm. Nt-JF1006-30, TALEN control line with wild-type nad9. (b) The same plants as in (a) photographed 61 days after sowing. Scale bars: 20 cm. The images of E94K-1 and the wild type are as in Fig. 4c,d.
Extended Data Fig. 8
Extended Data Fig. 8. Phenotypes of the full set of nad9 mutant lines under high-light conditions (cf. Extended Data Fig. 7).
(a) Photographs taken 40 days after sowing. Plants were raised from seeds, pre-grown for 28 days in a nursery chamber, and then transferred to a growth chamber with a light intensity of 1000 µE m−2 s−1. Scale bars: 10 cm. Nt-JF1006-30, TALEN control line with wild-type nad9. (b) The same plants as in (a) photographed 63 days after sowing. Scale bars: 20 cm.
Extended Data Fig. 9
Extended Data Fig. 9. Characterization of complex I in a set of selected mitochondrial nad9 mutants.
(a) Analysis of complex I accumulation by BN-PAGE and immunoblotting. A replicate gel of the gel shown in Fig. 4a was blotted and hybridized to an anti-CA2 antibody recognizing one of the carbonic anhydrase subunits of complex I. One of two technical replicates with similar results is shown. (b) Quantification of the ECL signal intensities in the immunoblot shown in panel (a). (c) Quantification of Nad9 protein amounts in the nad9 E94K-1 mutant after SDS-PAGE analysis (in a 12% polyacrylamide gel) and immunoblotting. The percentages above the Coomassie-stained gel indicate the relative protein amounts loaded in each lane. The numbers below each panel represent the relative staining intensities (upper panel) and the intensities of the hybridization signals (middle and bottom panels). Quantification was done with the Fiji image processing package. The 100% wild-type sample in lane 8 served as reference. For information about the total number of SDS-PAGE and anti-Nad9 western blot experiments, see Fig. 4. The anti-Cox1 western blot was performed once. Quantifications were done based on the images shown here. Source data
Extended Data Fig. 10
Extended Data Fig. 10. Amino acid sequence alignment of the Nad9 protein from tobacco with homologues from different species of prokaryotes and eukaryotes.
The highly conserved glutamate residue 94 is highlighted in red. Asterisks (*) indicate perfect conservation, colons (:) denote residues belonging to a group of amino acids exhibiting strong similarity, and dots (.) mark residues belonging to a group of amino acids exhibiting weak similarity. For the tobacco Nad9 protein, the (unedited) genomic sequence was used.

References

    1. Maliga P. Plastid transformation in higher plants. Annu. Rev. Plant Biol. 2004;55:289–313. - PubMed
    1. Bock R. Engineering plastid genomes: methods, tools, and applications in basic research and biotechnology. Annu. Rev. Plant Biol. 2015;66:211–241. - PubMed
    1. Ruf S, Kössel H, Bock R. Targeted inactivation of a tobacco intron-containing open reading frame reveals a novel chloroplast-encoded photosystem I-related gene. J. Cell Biol. 1997;139:95–102. - PMC - PubMed
    1. Allison LA, Maliga P. Light-responsive and transcription-enhancing elements regulate the plastid psbD core promoter. EMBO J. 1995;14:3721–3730. - PMC - PubMed
    1. Bock R, Hermann M, Kössel H. In vivo dissection of cis-acting determinants for plastid RNA editing. EMBO J. 1996;15:5052–5059. - PMC - PubMed