. 2022 Mar;6(3):267-275.
doi: 10.1038/s41551-022-00860-y. Epub 2022 Mar 17.

Detection of ovarian cancer via the spectral fingerprinting of quantum-defect-modified carbon nanotubes in serum by machine learning

Affiliations

Detection of ovarian cancer via the spectral fingerprinting of quantum-defect-modified carbon nanotubes in serum by machine learning

Mijin Kim et al. Nat Biomed Eng. 2022 Mar.

Abstract

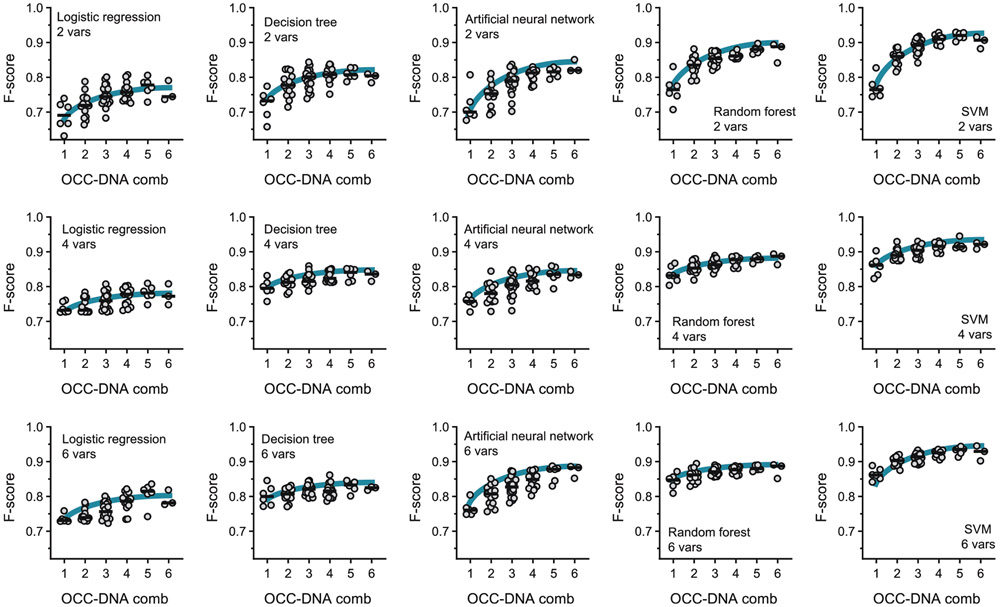
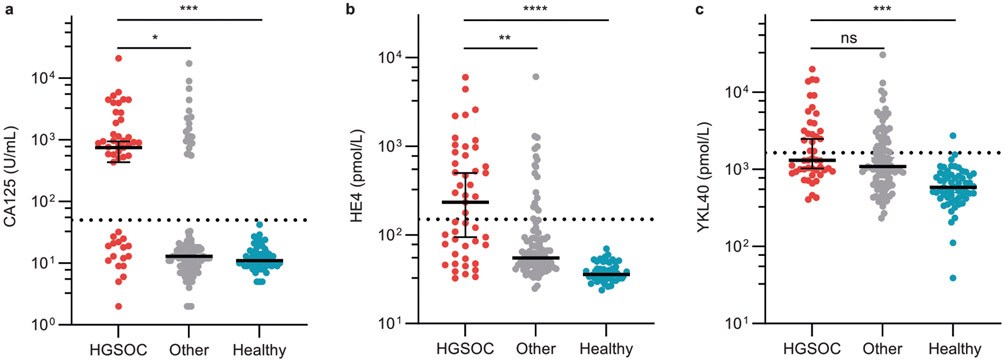
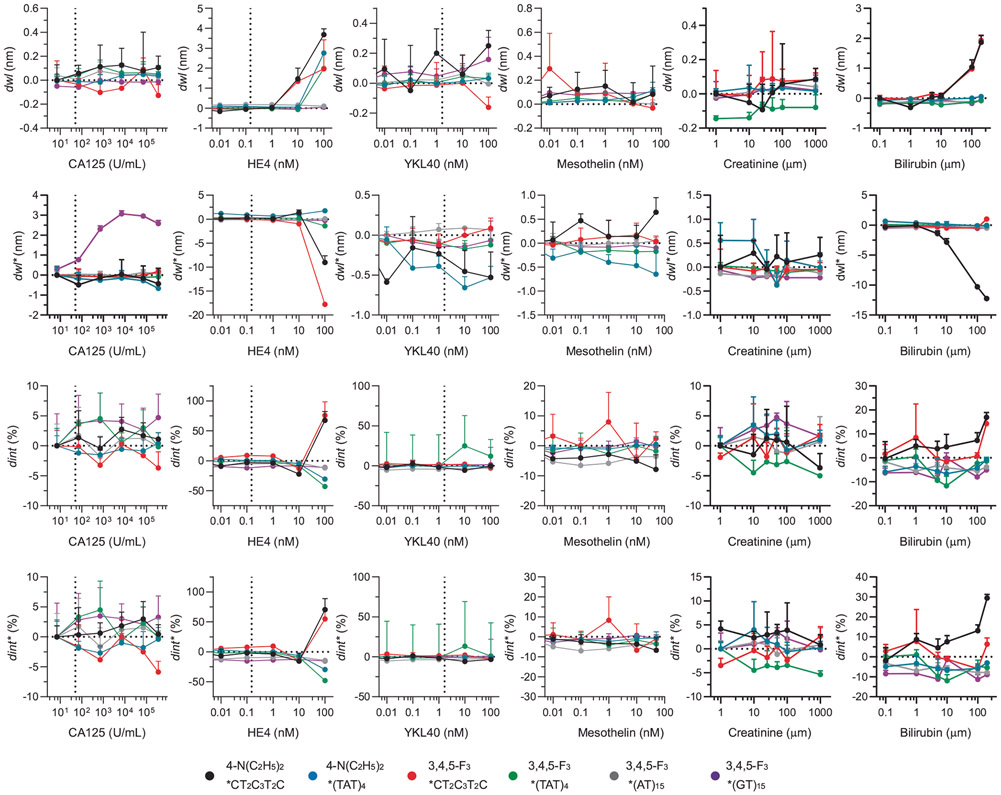
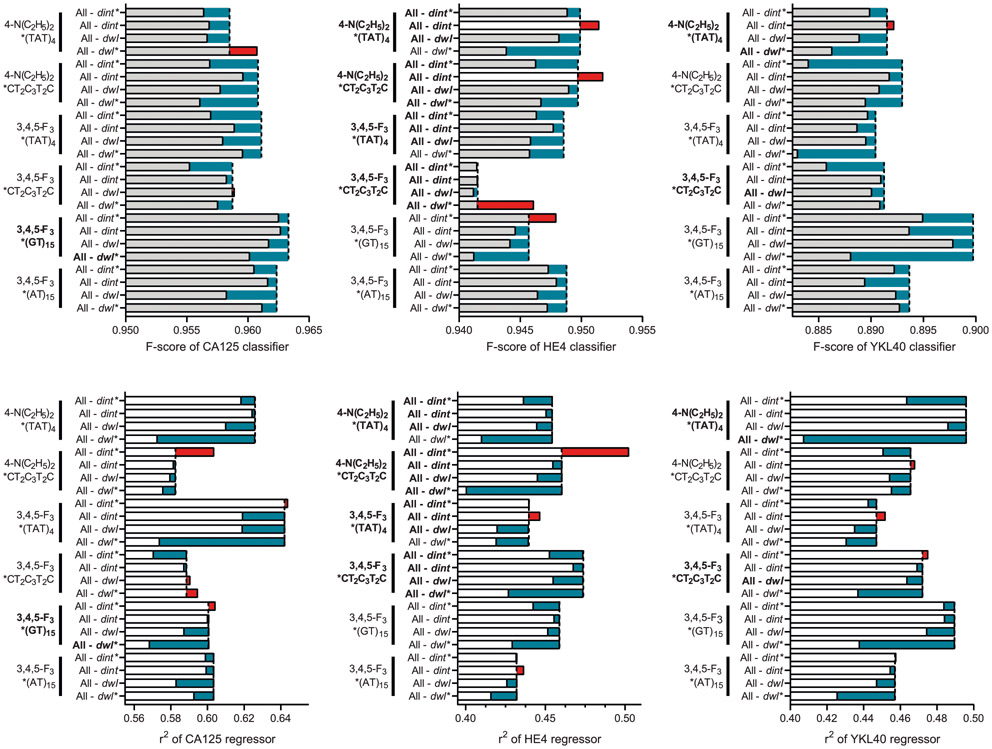
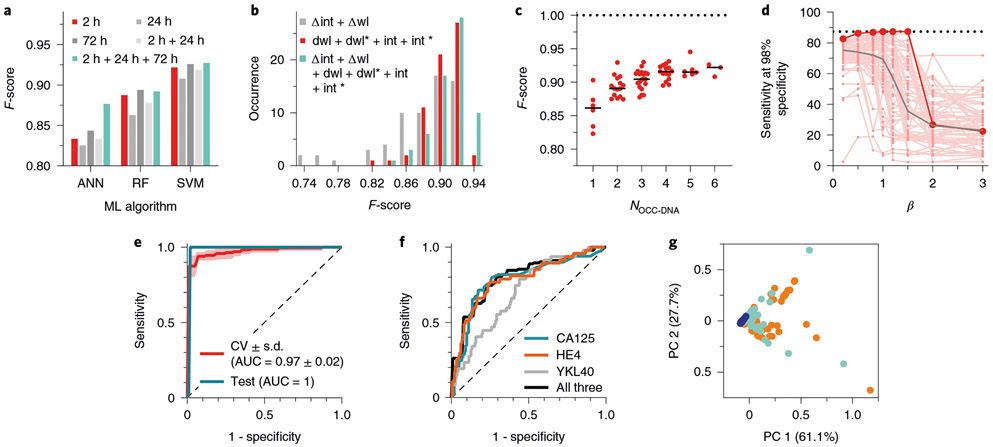
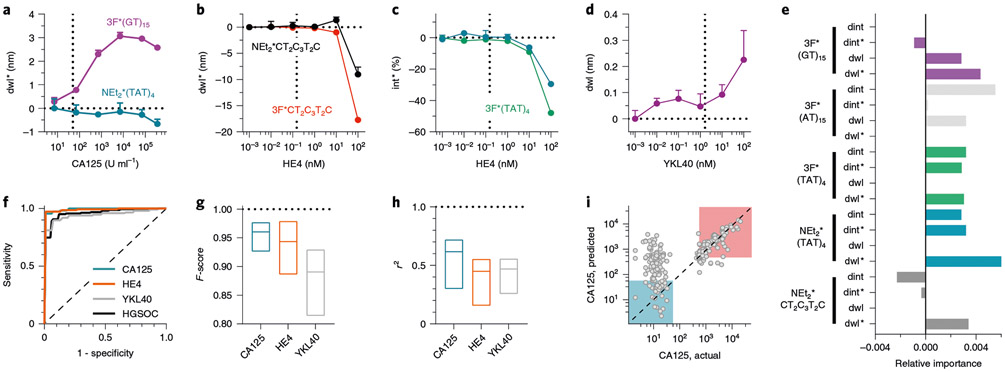
Serum biomarkers are often insufficiently sensitive or specific to facilitate cancer screening or diagnostic testing. In ovarian cancer, the few established serum biomarkers are highly specific, yet insufficiently sensitive to detect early-stage disease and to impact the mortality rates of patients with this cancer. Here we show that a 'disease fingerprint' acquired via machine learning from the spectra of near-infrared fluorescence emissions of an array of carbon nanotubes functionalized with quantum defects detects high-grade serous ovarian carcinoma in serum samples from symptomatic individuals with 87% sensitivity at 98% specificity (compared with 84% sensitivity at 98% specificity for the current best clinical screening test, which uses measurements of cancer antigen 125 and transvaginal ultrasonography). We used 269 serum samples to train and validate several machine-learning classifiers for the discrimination of patients with ovarian cancer from those with other diseases and from healthy individuals. The predictive values of the best classifier could not be attained via known protein biomarkers, suggesting that the array of nanotube sensors responds to unidentified serum biomarkers.


Figures

Extended Data Fig. 1 ∣
Extended Data Fig. 1 ∣. Spectral responses of OCC-DNAs to a small set of HGSOC and benign serum samples.
Four spectral parameters –intensity and wavelength changes of the E11 and E11 peaks– were extracted from fluorescence spectra of four serum samples in each group. Each sample was measured in triplicate. Horizontal lines denote the median. Six OCC-DNA nanosensors, with p-values of the spectroscopic features lower than 0.10, were selected for the sensor array.
Extended Data Fig. 2 ∣
Extended Data Fig. 2 ∣. Spectral responses of the nanosensor array to training and validation sets of patient serum samples (Nsa = 215).
Four spectral parameters, a, dint, b, dint*, c, dwl, and d, dwl*, were extracted from fluorescence spectra of the sensor array after 2-hour serum incubation. Each sample was measured in triplicate.
Extended Data Fig. 3 ∣
Extended Data Fig. 3 ∣. Averaged F-scores of optimized machine learning models with 10-fold validation.
The classification was divided as HGSOC versus other gynecologic diseases and benign groups. The blue line is the logarithmic regression of the median F-score.
Extended Data Fig. 4 ∣
Extended Data Fig. 4 ∣. Assessment of medications as potential interferents to nanosensor prediction.
a, Fraction of medication dose for HGSOC and other disease patients. b, Chronic conditions, and prevalence thereof, in patients measured in this study. Comorbidity was identified based on the patients’ medication information. c, Anti-cancer drugs or prescription drugs whose occurrence differed by 0.1 or higher between HGSOC and other disease groups.
Extended Data Fig. 5 ∣
Extended Data Fig. 5 ∣. Serum levels of known ovarian cancer biomarkers in the model study population.
a, CA125, b, HE4, and c, YKL40. The serum protein levels were quantified by automated immunoassay. Dotted lines indicate the clinical reference of each biomarker for HGSOC diagnosis. The error bars denote median ± 95% CI.
Extended Data Fig. 6 ∣
Extended Data Fig. 6 ∣. Response of OCC-DNA nanosensors to protein HGSOC biomarkers, creatinine, and bilirubin in 20% fetal bovine serum.
The fluorescence spectra were obtained 2 hours after the incubation. Vertical dashed lines indicate the clinical reference of each serum biomarker for HGSOC screening.
Extended Data Fig. 7 ∣
Extended Data Fig. 7 ∣. Relative feature importance of each spectroscopic variable in the HGSOC binary classification models.
a, Feature importance of each spectral parameter, used to train the SVM models, of all OCC-DNA sensors in the arrays tested in this work. Solid lines indicate the median feature importance. b, Correlation of averaged F-score with the averaged feature importance of each spectroscopic variable. Vertical dashed lines indicate F-score when all four spectroscopic variables (dint, dint*, dwl, and dwl*) of the OCC-DNA were included as feature vectors in the model development.
Extended Data Fig. 8 ∣
Extended Data Fig. 8 ∣. Correlation of F-score and r2 of the biomarker prediction models with the relative feature importance of each spectroscopic variable.
For the binary classification models (top rows), samples were divided into two groups–abnormal vs. normal levels of serum biomarkers–based on the clinical references (CA125: 50 U/mL, HE4: 150 pM, YKL40: 1650 pM) and assessed the prediction accuracy of abnormal levels of each biomarker. Feature importance of the prediction models shows which spectral parameters most impacted the model performance using an ablation study. Biomarker dependent variables that were identified in Extended Data Fig. 4 are highlighted in bold. Vertical dashed lines indicate F-score when all four spectroscopic variables (dint, dint*, dwl, and dwl*) of the OCC-DNA were included as feature vectors in the model development.
Fig. 1 ∣
Fig. 1 ∣. OCC-DNA nanosensor array.
a, Molecular model of an OCC-DNA nanosensor element. Shown is an ss(GT)15 DNA-wrapped (6,5)-SWCNT with 3,4,5-trifluoroaryl OCC. b, Construction of an OCC-DNA nanosensor array from OCC and ssDNA components.
Fig. 2 ∣
Fig. 2 ∣. Spectroscopic responses of OCC-DNA sensors to patient serum samples.
a, Representative fluorescence spectra of the ss(GT)15-wrapped 3,4,5-trifluoroaryl OCC sensor, 3F*(GT)15, in PBS (grey), 20 v/v% serum from an HGSOC patient (orange) and serum from a healthy individual (blue). b, Spectral responses of the 3F*(GT)15 sensor to cancer and healthy individuals’ serum samples. Four spectral parameters—intensity and wavelength of the E11 and E11 peaks (int, int*, wl and wl*) were extracted from fluorescence spectra of 4 serum samples for each group. Data points represent the mean value of the spectroscopic variables. Each sample was measured in triplicate. Horizontal lines denote the median. Statistical significance was calculated via Welch’s t-test. c, E11 intensity change (dint) of each OCC-DNA sensor in response to 215 serum samples from individuals with HGSOC and other diseases, as well as healthy individuals at 2 h incubation. d, PCA of sensor responses to HGSOC (orange), other diseases (light blue) and healthy samples (blue). Source data.
Fig. 3 ∣
Fig. 3 ∣. Optimization of machine learning algorithms for HGSOC classification.
a, Comparison of F-scores of HGSOC identification with ANN, RF and SVM machine learning (ML) models, using sensor data collected with different serum incubation times. b, Distribution of F-scores obtained using data with different numbers of spectral variables: 2 variables (Δwl + Δint) vs 4 variables (dwl + dwl* + dint + dint*) vs 6 variables (dwl + dwl* + dint + dint* + Δwl + Δint). c, F-scores obtained with different numbers of OCC-DNA nanosensor types, via SVM. Dotted line indicates the upper limit of the F-score. The horizontal line is to guide the eye to the F-score of 1. d, Sensitivities of all possible sensor array combinations, composed of up to 6 OCC-DNAs, at 98% specificity, as a function of β in Fβ scoring via SVM. Small red dots denote sensitivities of each nanosensor array at varying β. Large red dots denote the overall best-performing nanosensor combination. The horizontal dashed line is the highest sensitivity at 98% specificity of the best-performing nanosensor combination at β=1. The grey line is the median of sensitivities for all optimized nanosensor arrays. e, Best ROC curves for binary classification of HGSOC, showing both cross-validated training set (CV) and test/validation set (Test). The shaded area is the standard deviation of 10-fold validation. AUC is the area under the curve. The dashed diagonal line is a ROC curve with no discrimination. f, ROC curves of HGSOC classification using individual serum biomarkers (CA125, blue; HE4, orange; YKL40, grey) and logistic regression of their combination (black). The dashed diagonal line is a ROC curve with no discrimination. g, PCA plot of three disease states: HGSOC (orange), other diseases (light blue) and healthy patients (blue), calculated using conventional serum measurements of CA125, HE4 and YKL40 levels from 215 patient sera. Source data.
Fig. 4 ∣
Fig. 4 ∣. Known serum biomarkers make up part of the disease fingerprint in the nanosensor array response.
a-d, Representative spectral responses of OCC-DNA in 20% FBS at increasing concentration of CA125 (a), HE4 (b,c) and YKL40 (d). Mean±s.d., n = 3 technical replicates. e, Feature importance analysis of the binary SVM model. f, ROC curves of binary biomarker classification (normal vs above clinical reference) using SVM of the OCC-DNA sensor responses. The dashed diagonal line indicates a ROC curve with no discrimination. g, F-score ranges of SVM classifications of HGSOC biomarkers or disease state. The line in each box indicates the median. h, r2 ranges of biomarker SVR. The line in each box indicates the median. The horizontal dotted line is to guide the eye to the F-score or r2 of 1. i, Serum CA125 levels predicted by SVR against immunoassay results. The prediction models were trained by the fluorescence response of NEt2*(TAT)4, 3F*(TAT)4 and 3F*(AT)15. The highlighted squares classify normal (<50 U ml−1, blue) and high CA125 (>250 U ml−1, red) groups. Source data. The dashed diagonal line represents where actual and predicted CA125 levels are the same.

References

    1. Bray F et al. Global cancer statistics 2018: GLOBOCAN estimates of incidence and mortality worldwide for 36 cancers in 185 countries. CA Cancer J. Clin 68, 394–424 (2018). - PubMed
    1. Siegel RL, Miller KD & Jemal A Cancer statistics, 2020. CA Cancer J. Clin 70, 7–30 (2020). - PubMed
    1. Blyuss O et al. Comparison of longitudinal CA125 algorithms as a first-line screen for ovarian cancer in the general population. Clin. Cancer Res 24, 4726 (2018). - PMC - PubMed
    1. Cramer DW et al. Ovarian cancer biomarker performance in prostate, lung, colorectal, and ovarian cancer screening trial specimens. Cancer Prev. Res 4, 365 (2011). - PMC - PubMed
    1. Dupont J et al. Early detection and prognosis of ovarian cancer using serum YKL-40. J. Clin. Oncol 22, 3330–3339 (2004). - PubMed

Publication types