. 2022 Apr;23(4):632-642.
doi: 10.1038/s41590-022-01152-y. Epub 2022 Mar 17.

Type I interferon transcriptional network regulates expression of coinhibitory receptors in human T cells

Affiliations

Type I interferon transcriptional network regulates expression of coinhibitory receptors in human T cells

Tomokazu S Sumida et al. Nat Immunol. 2022 Apr.

Abstract

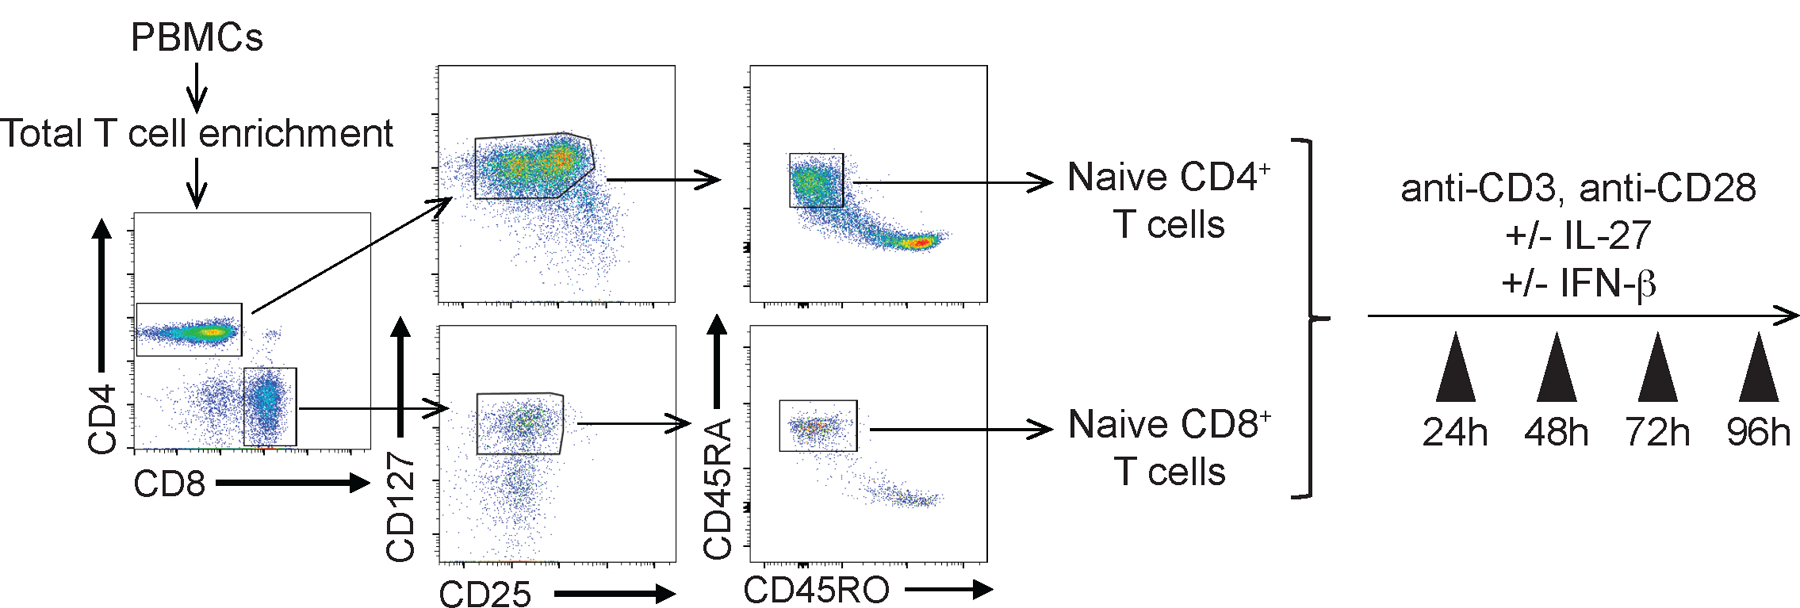
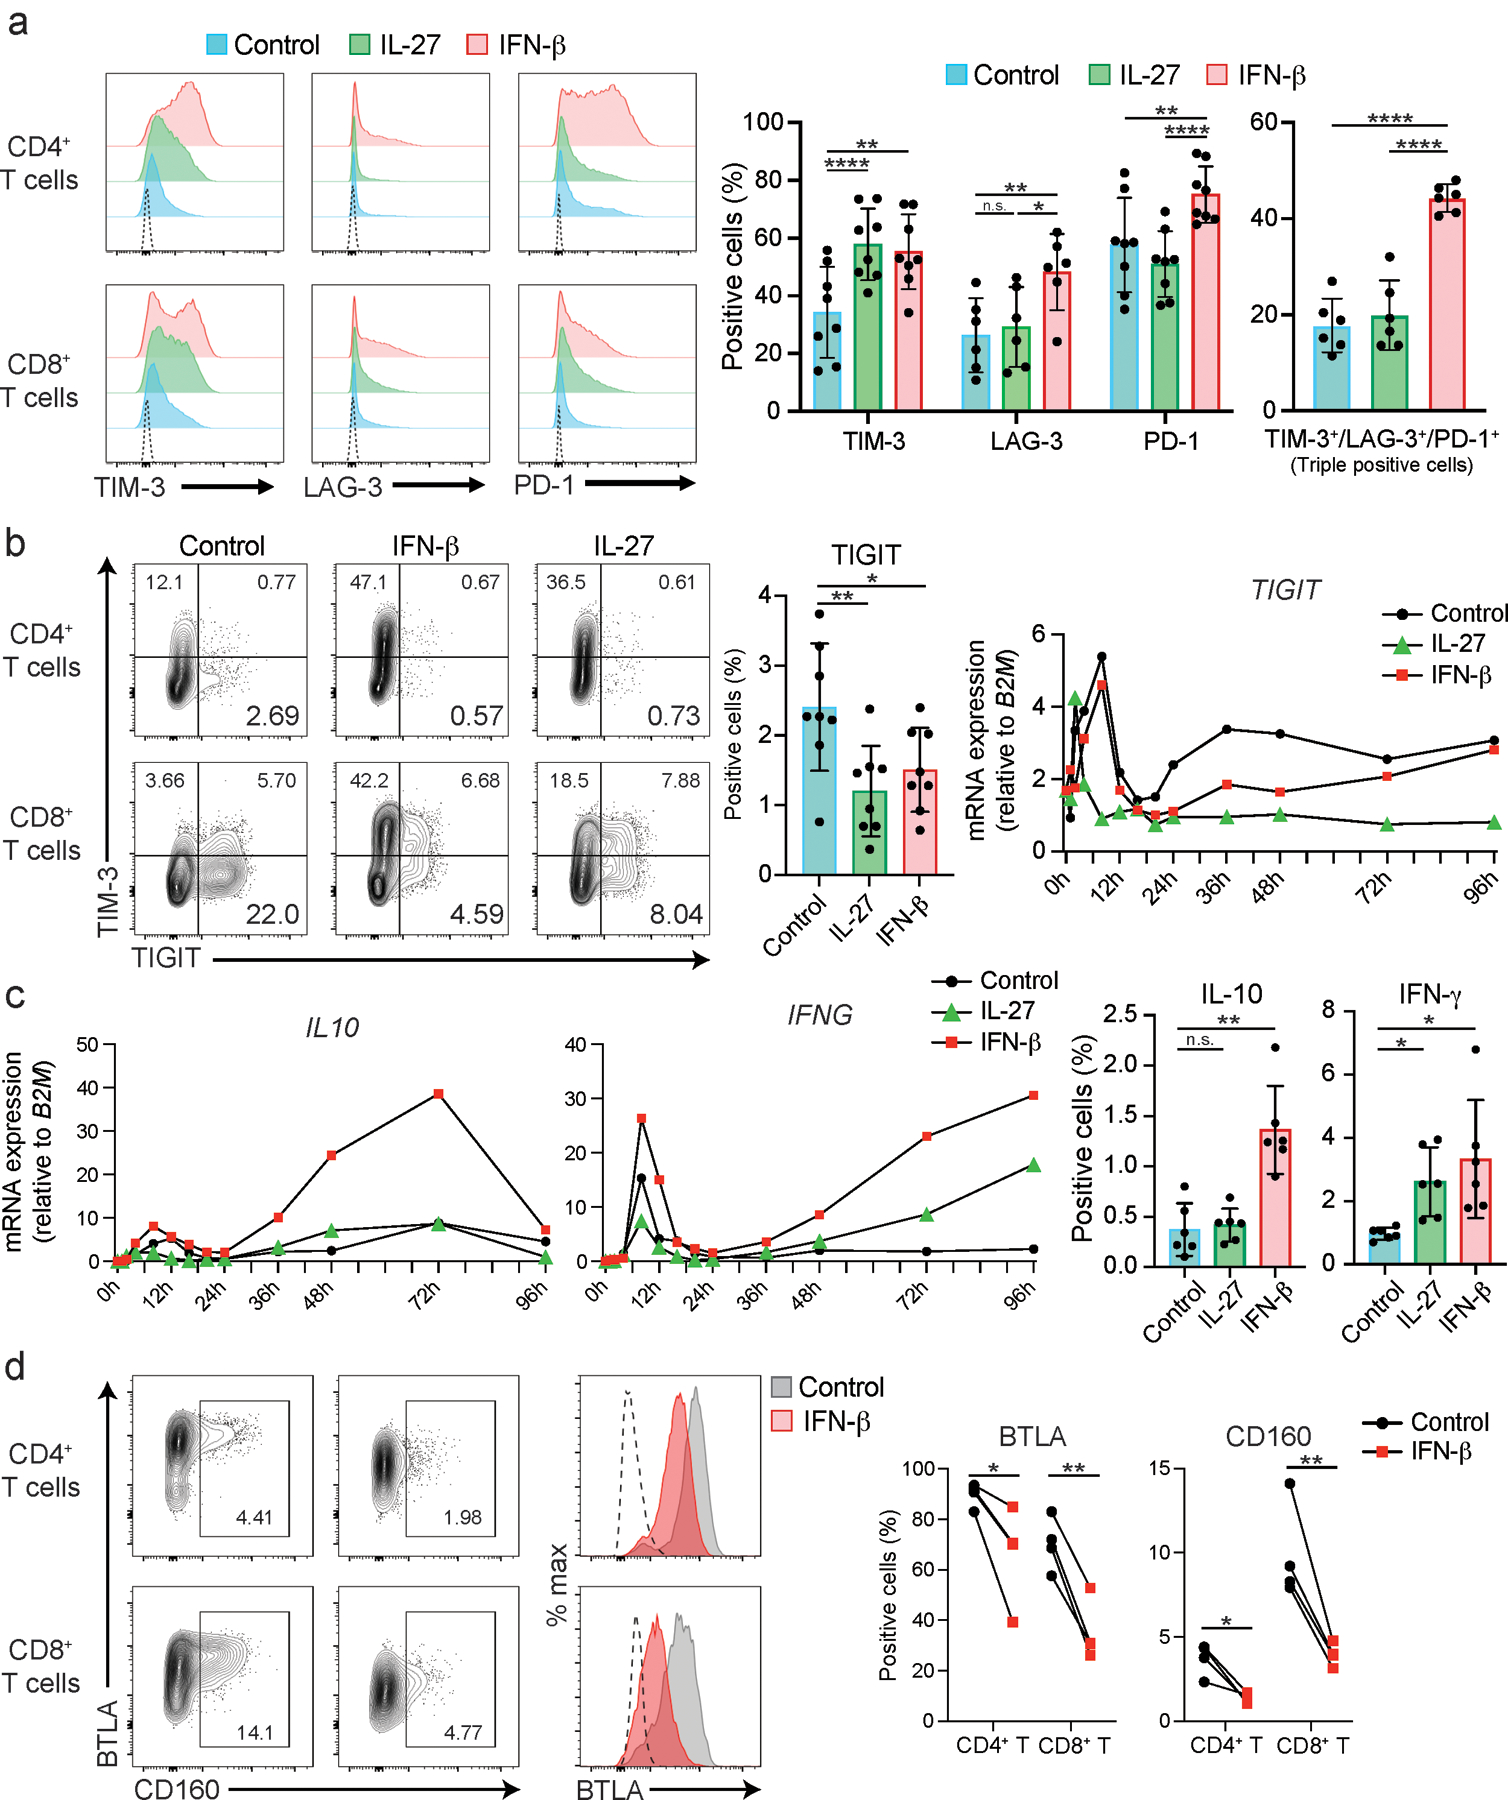
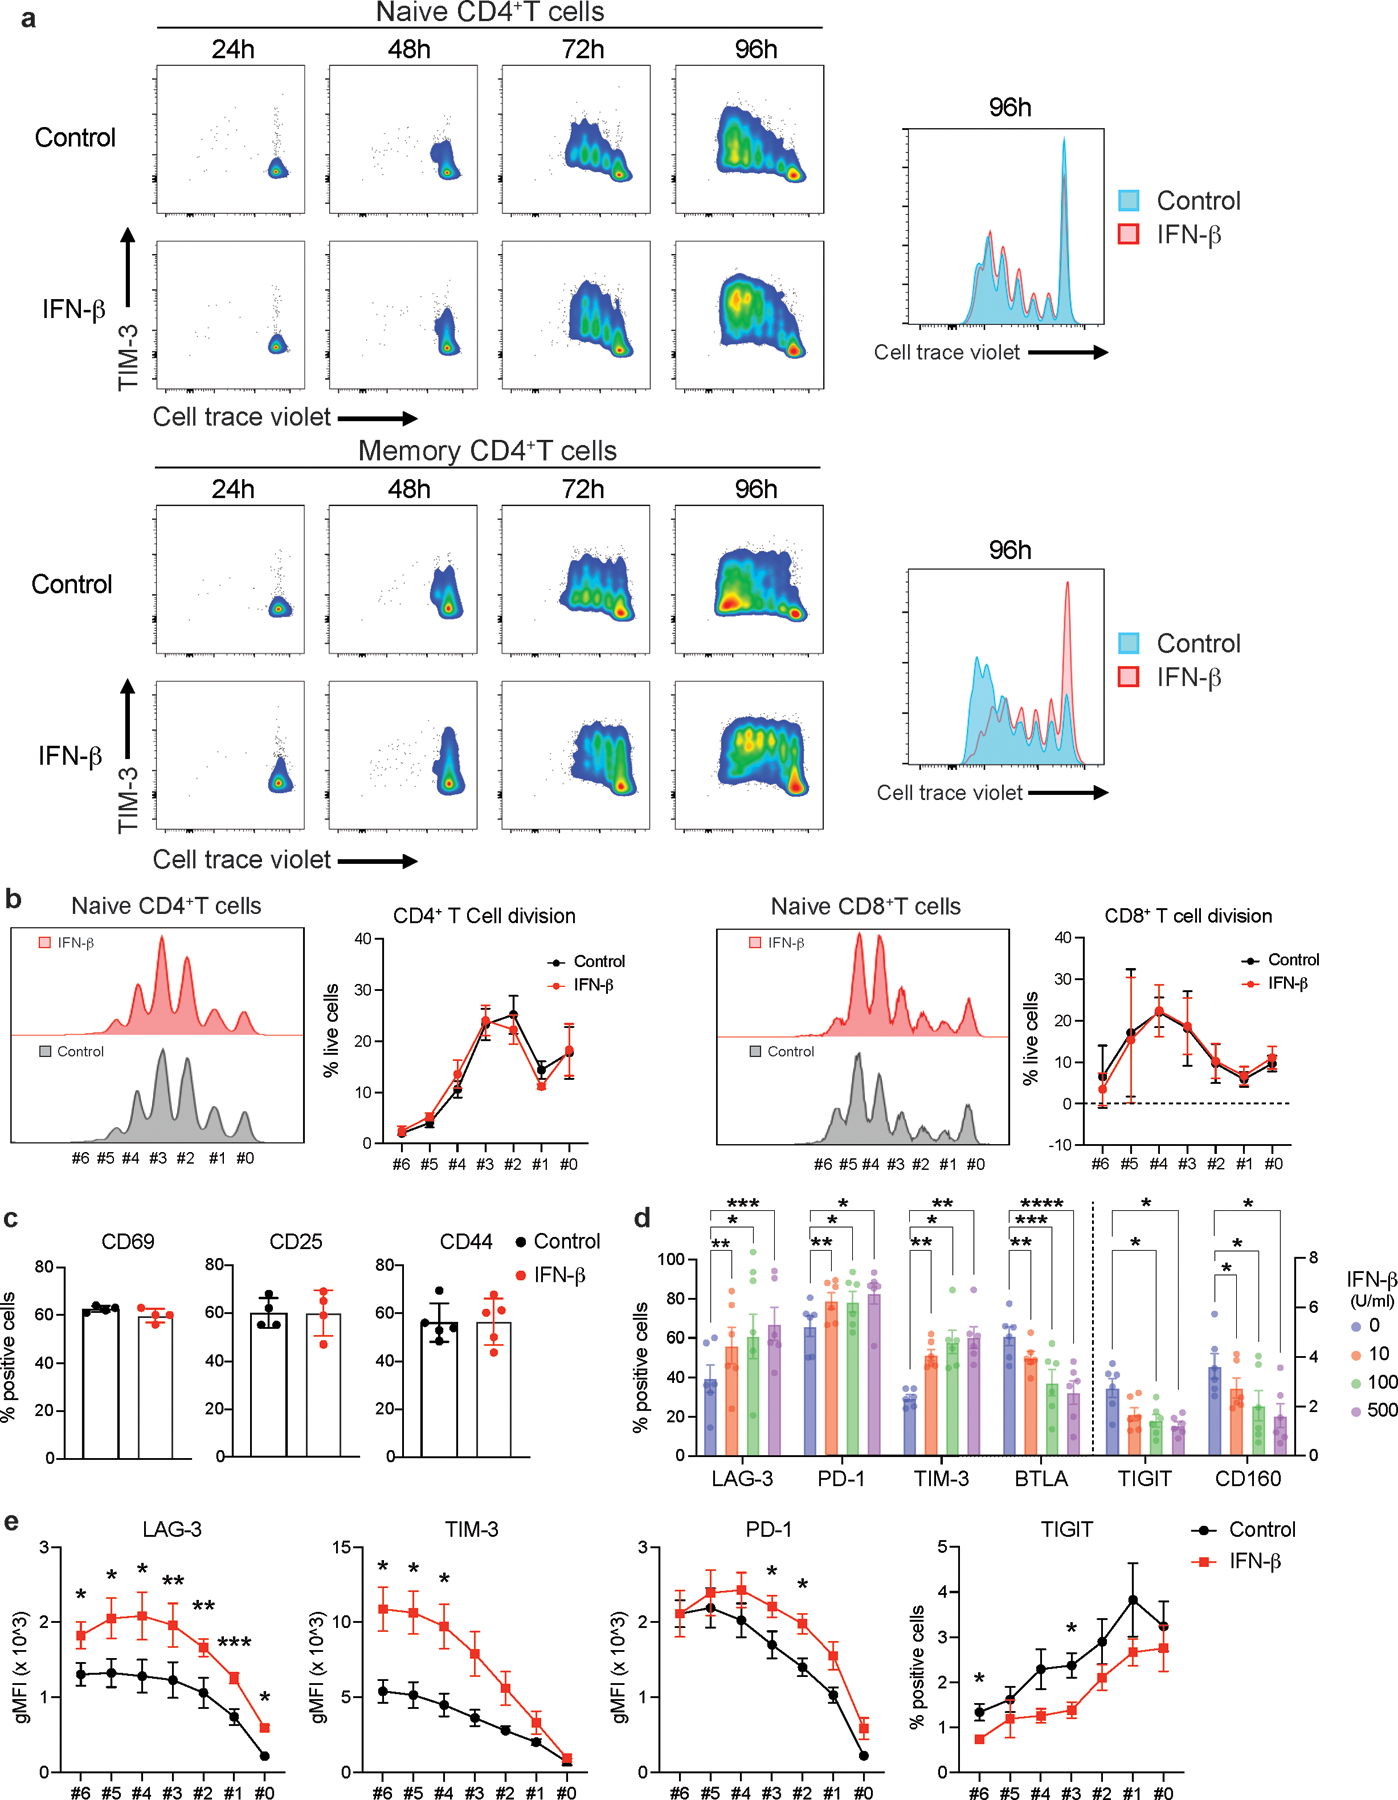
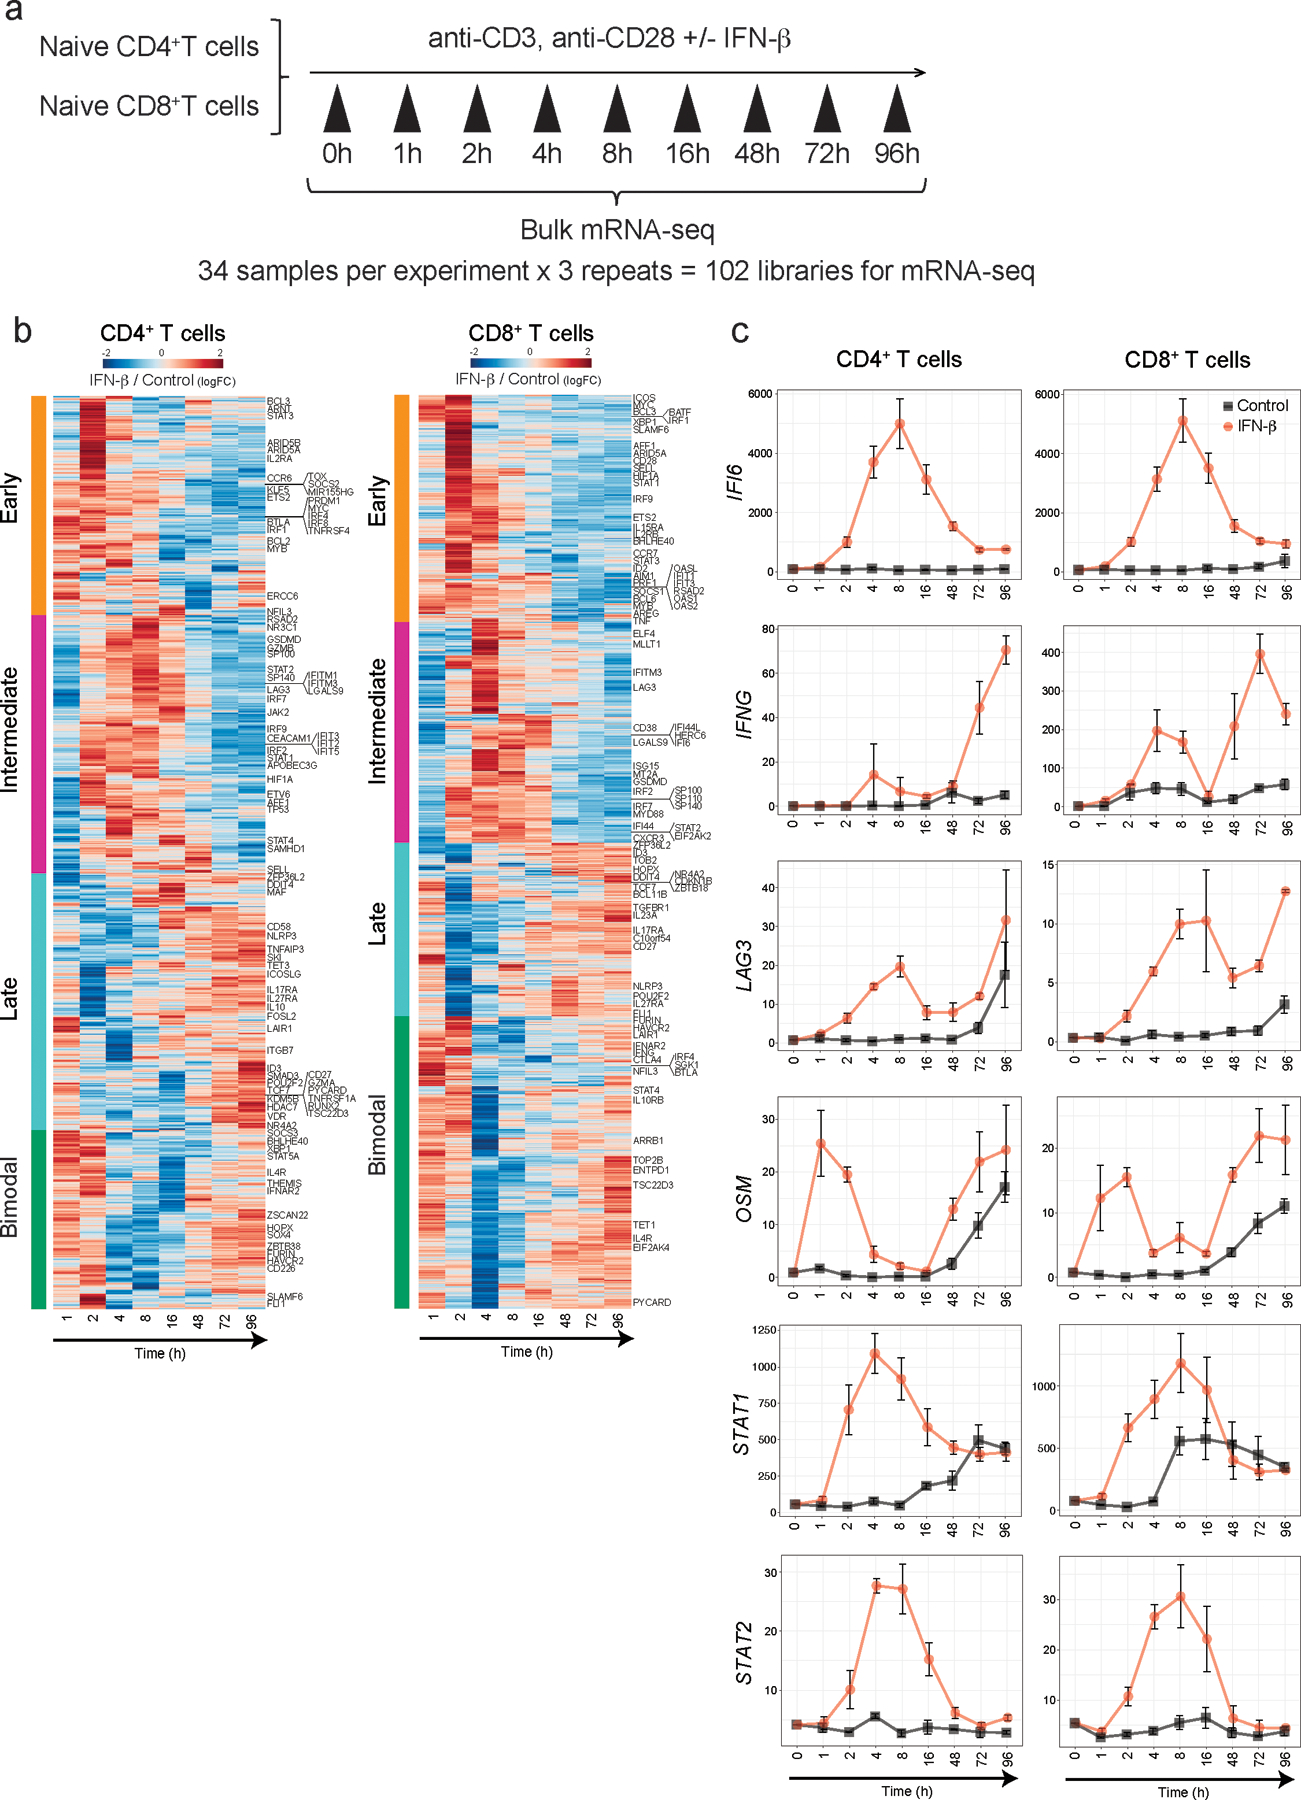
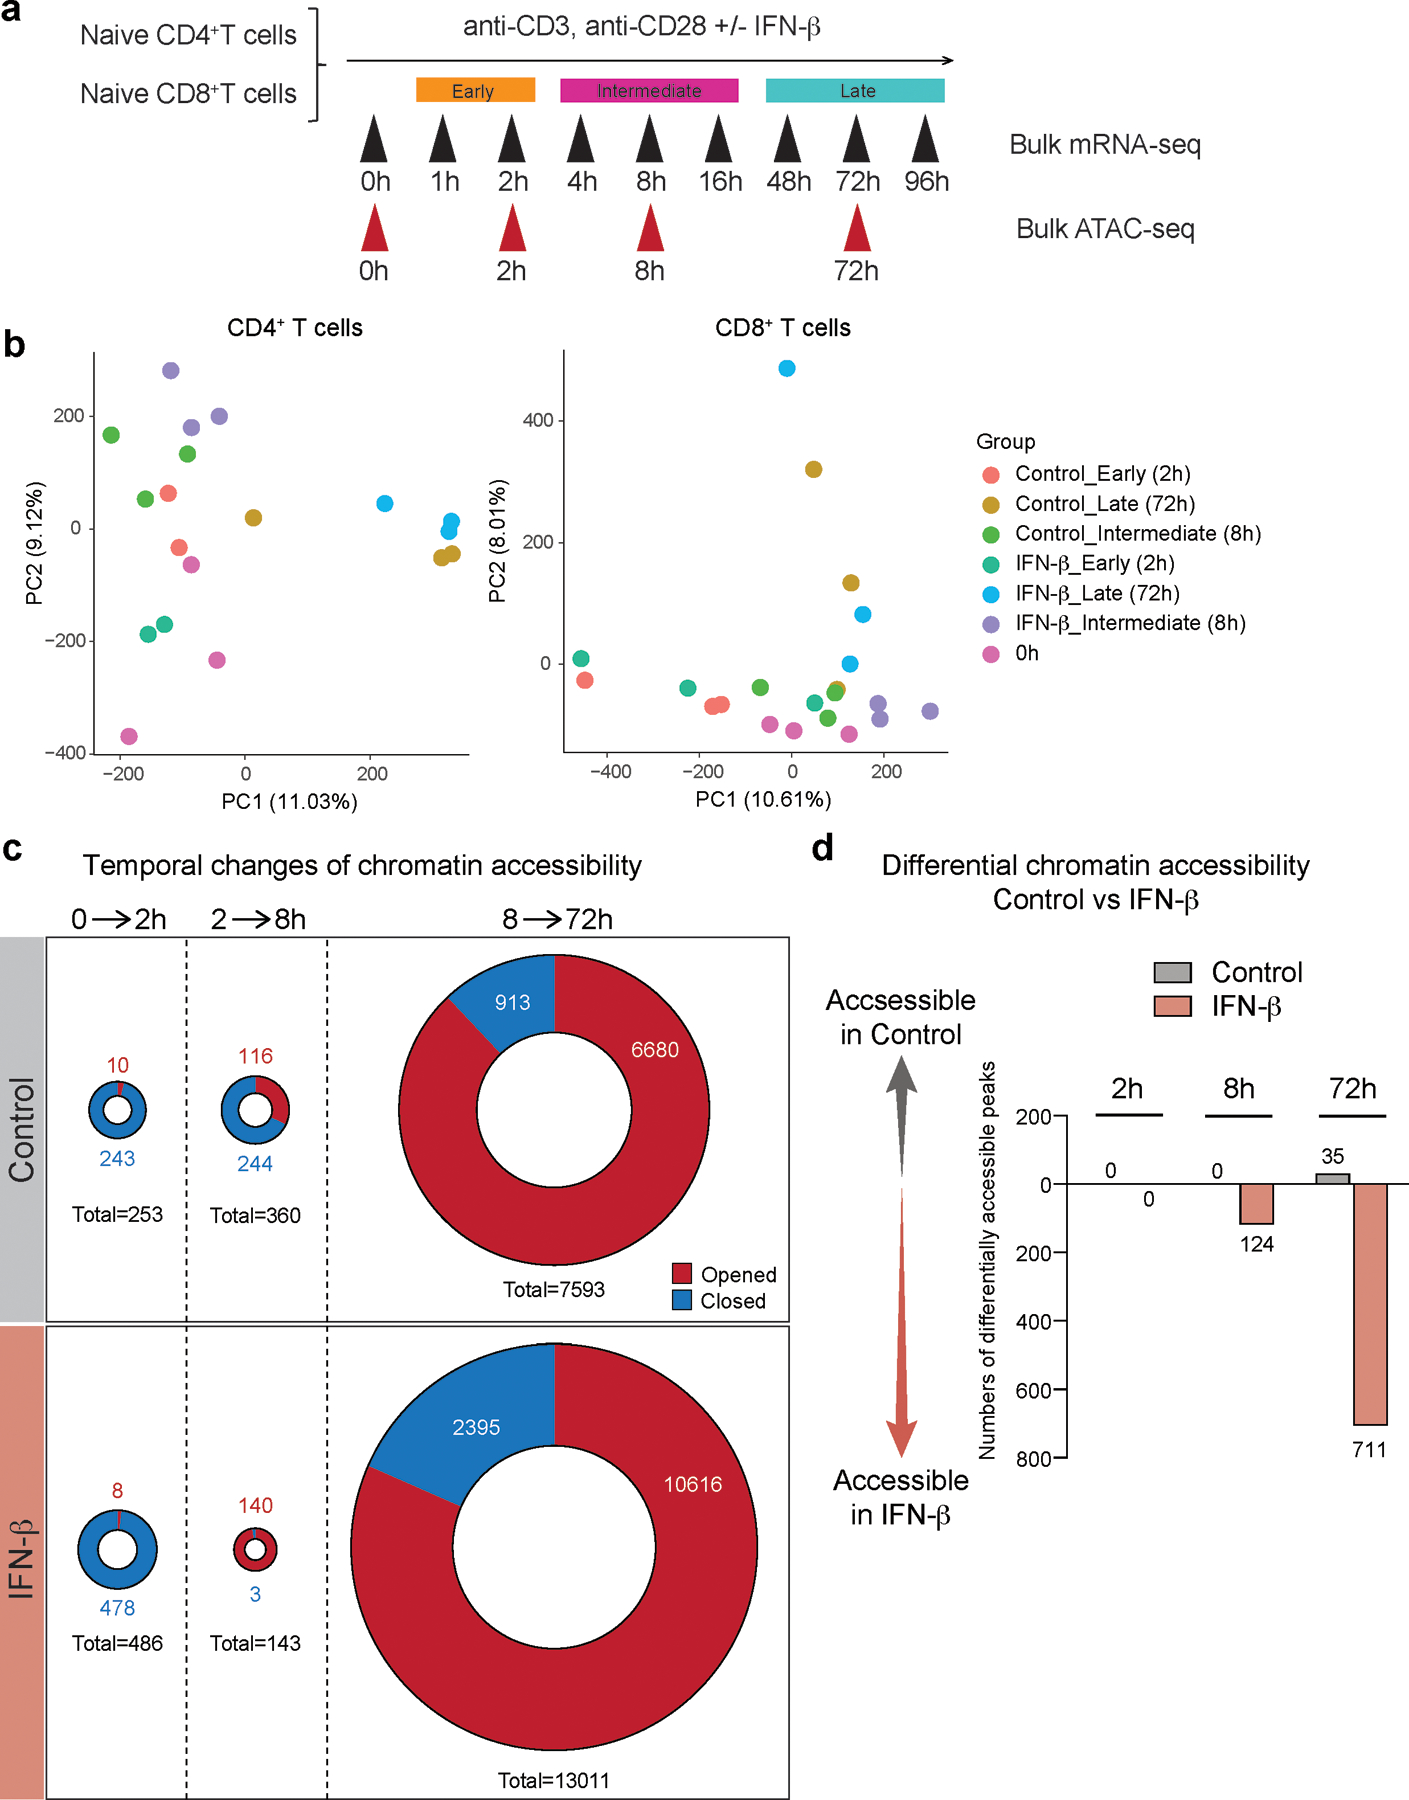
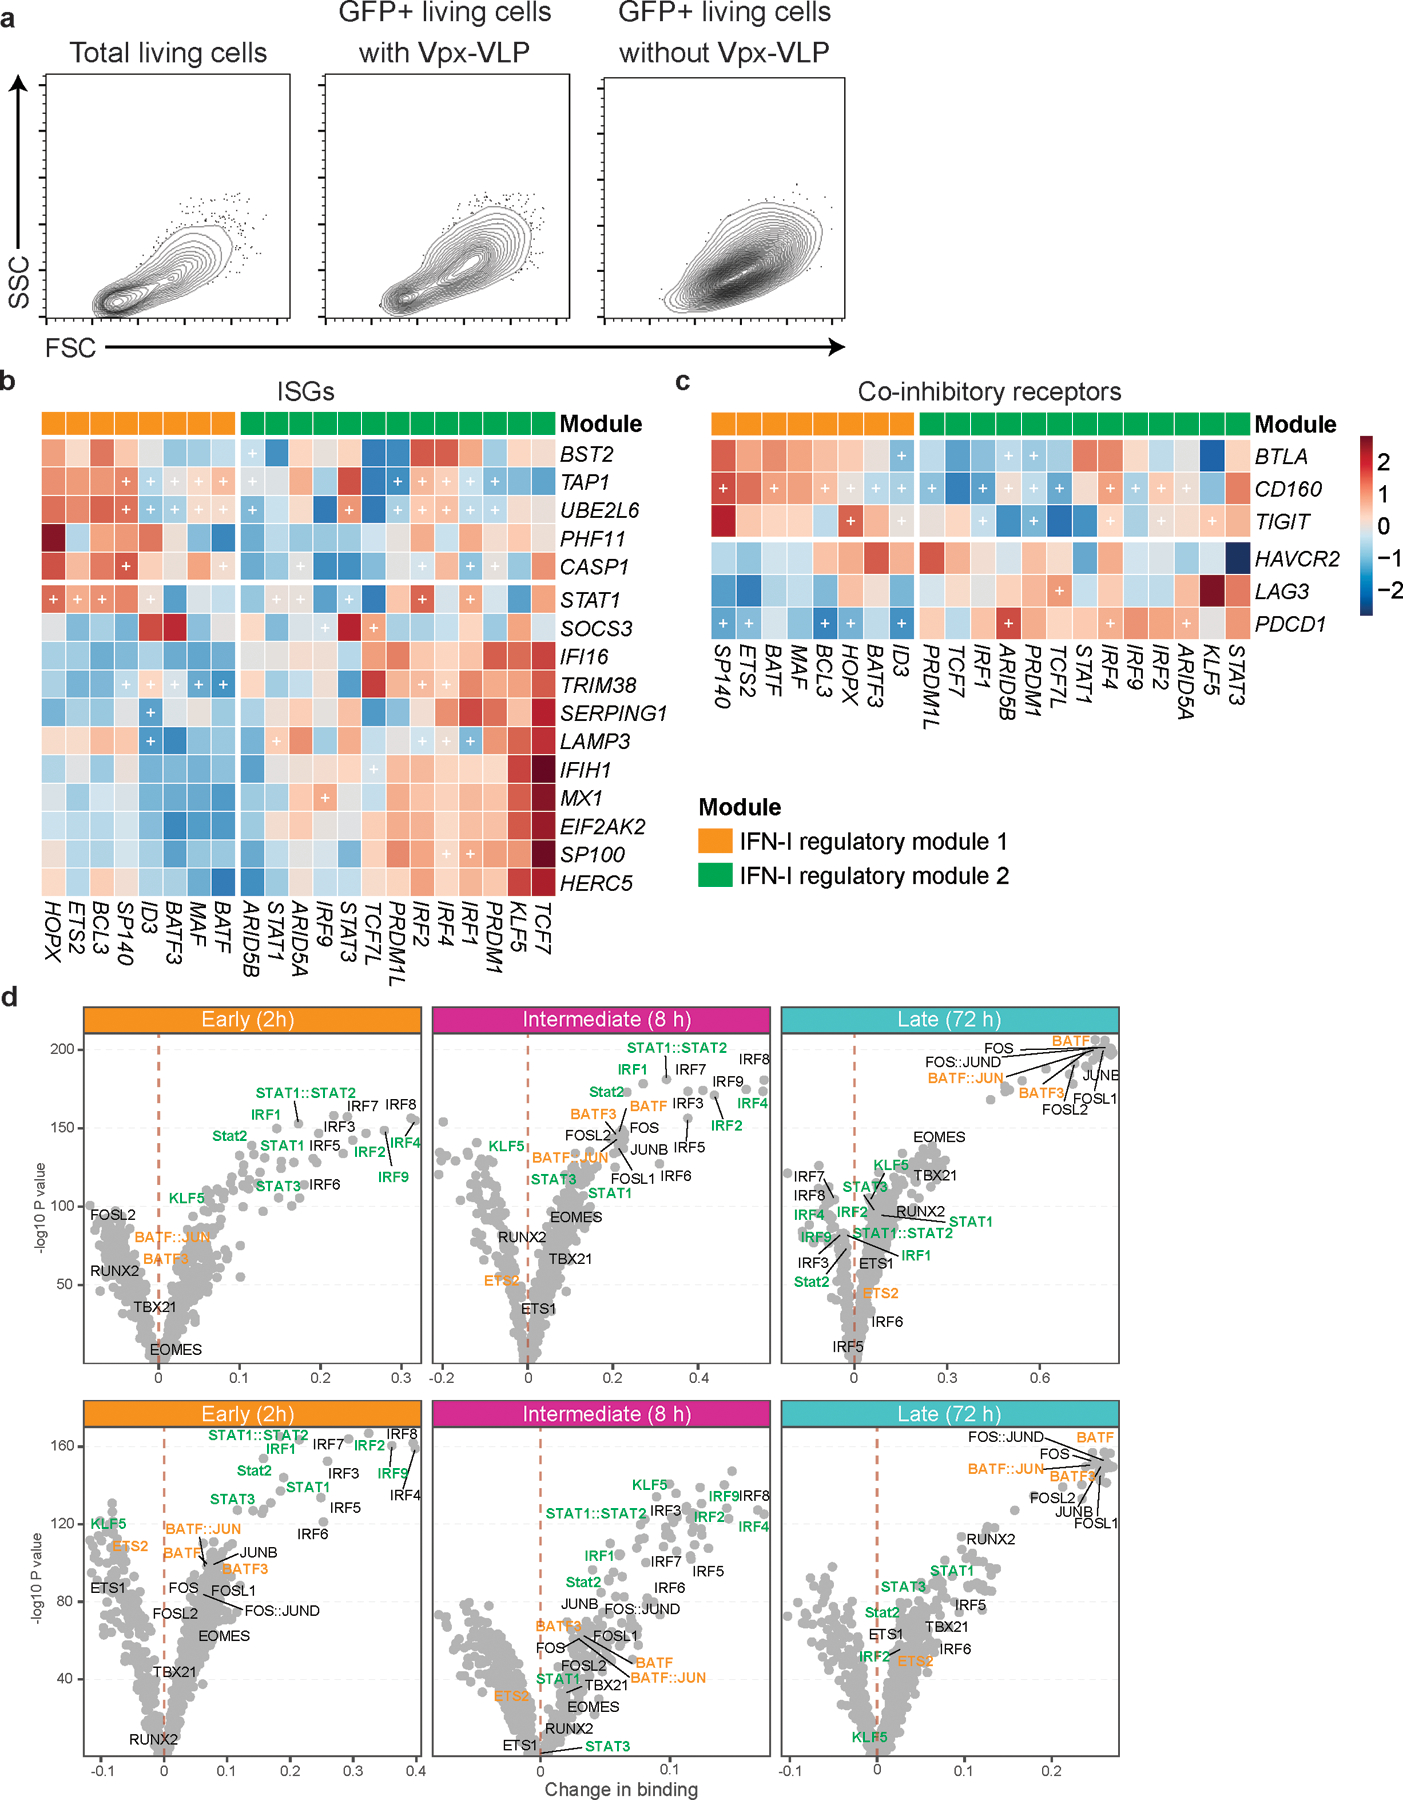
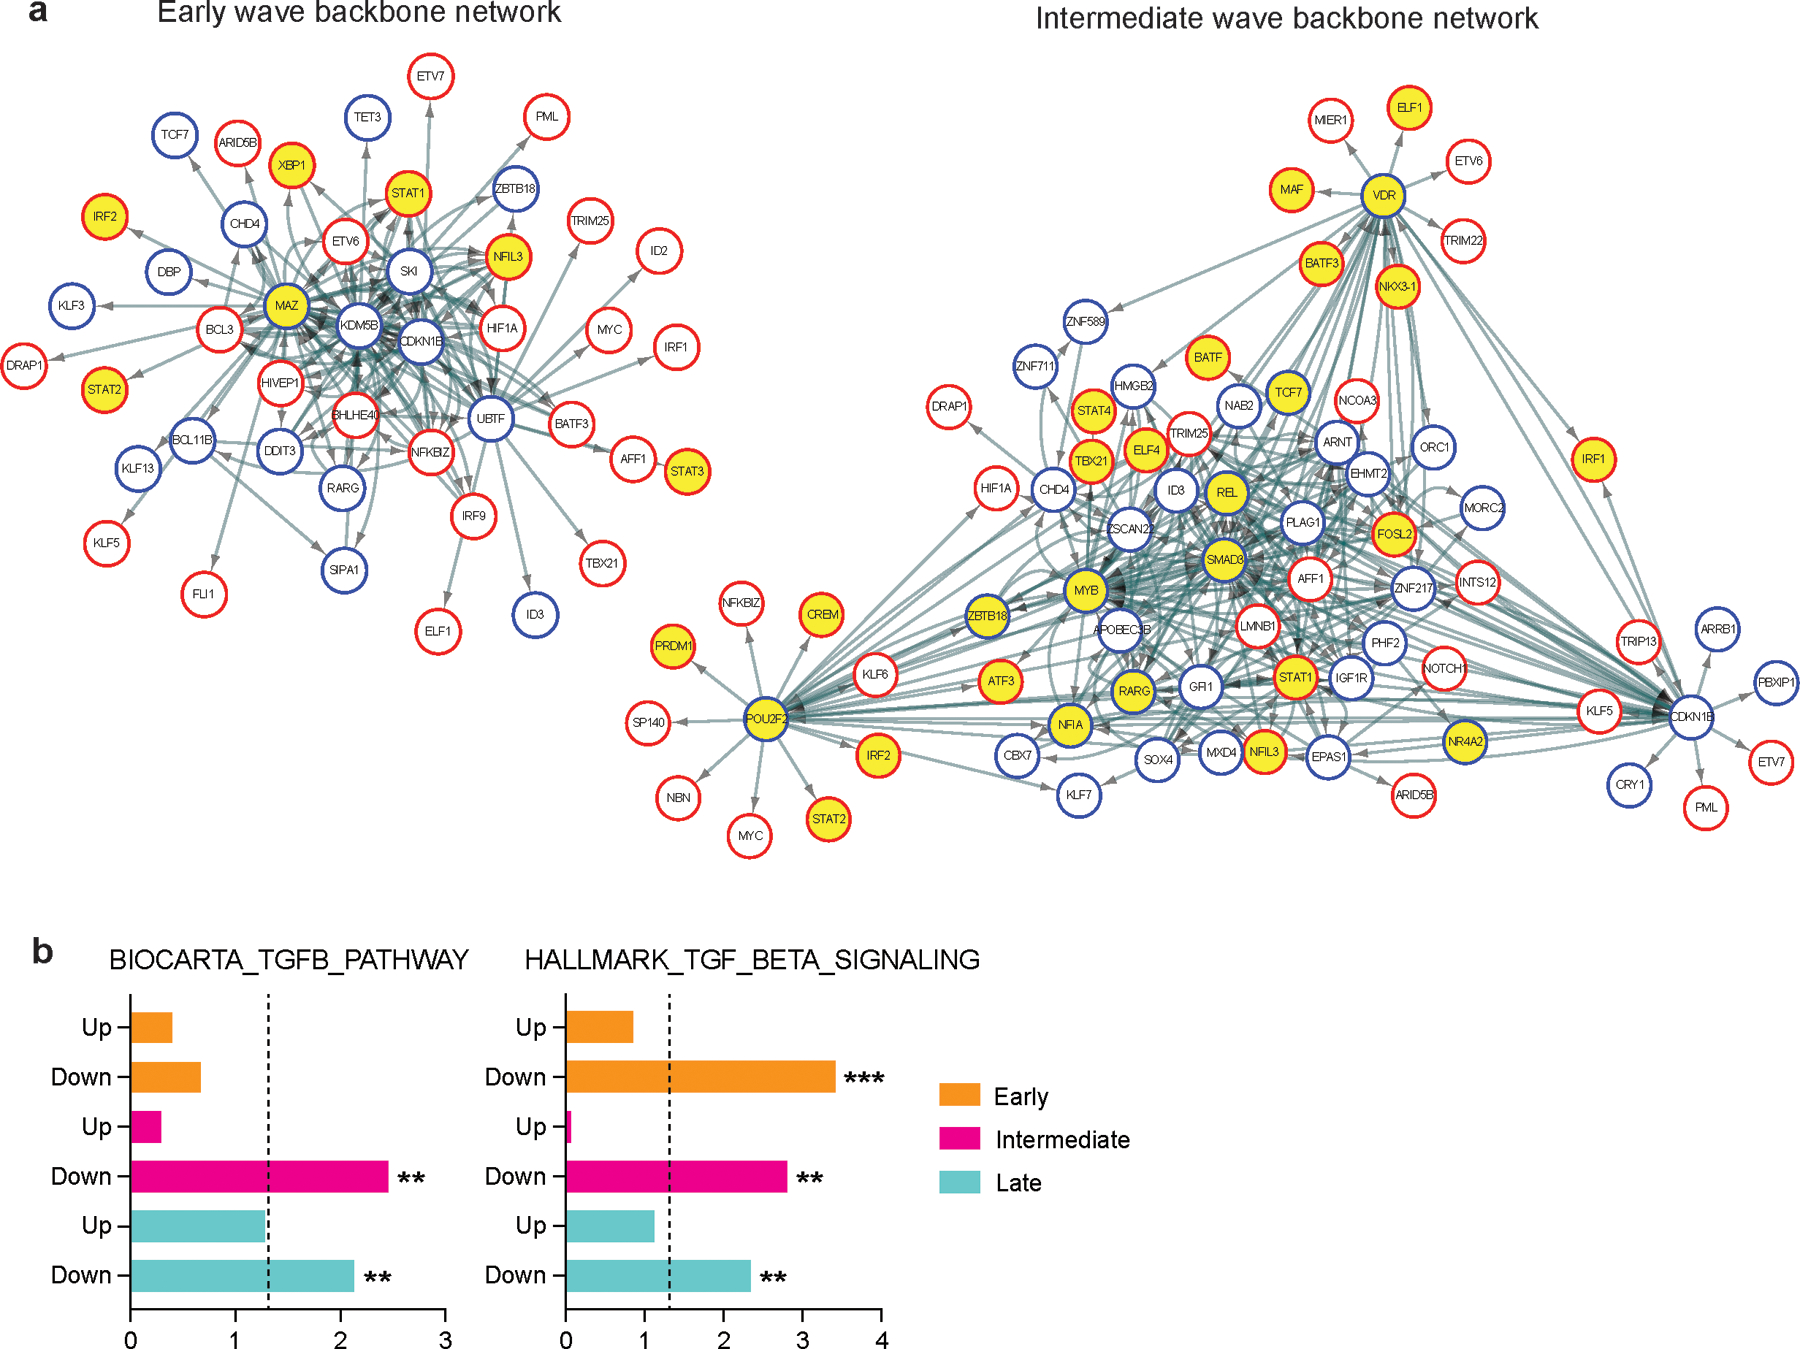
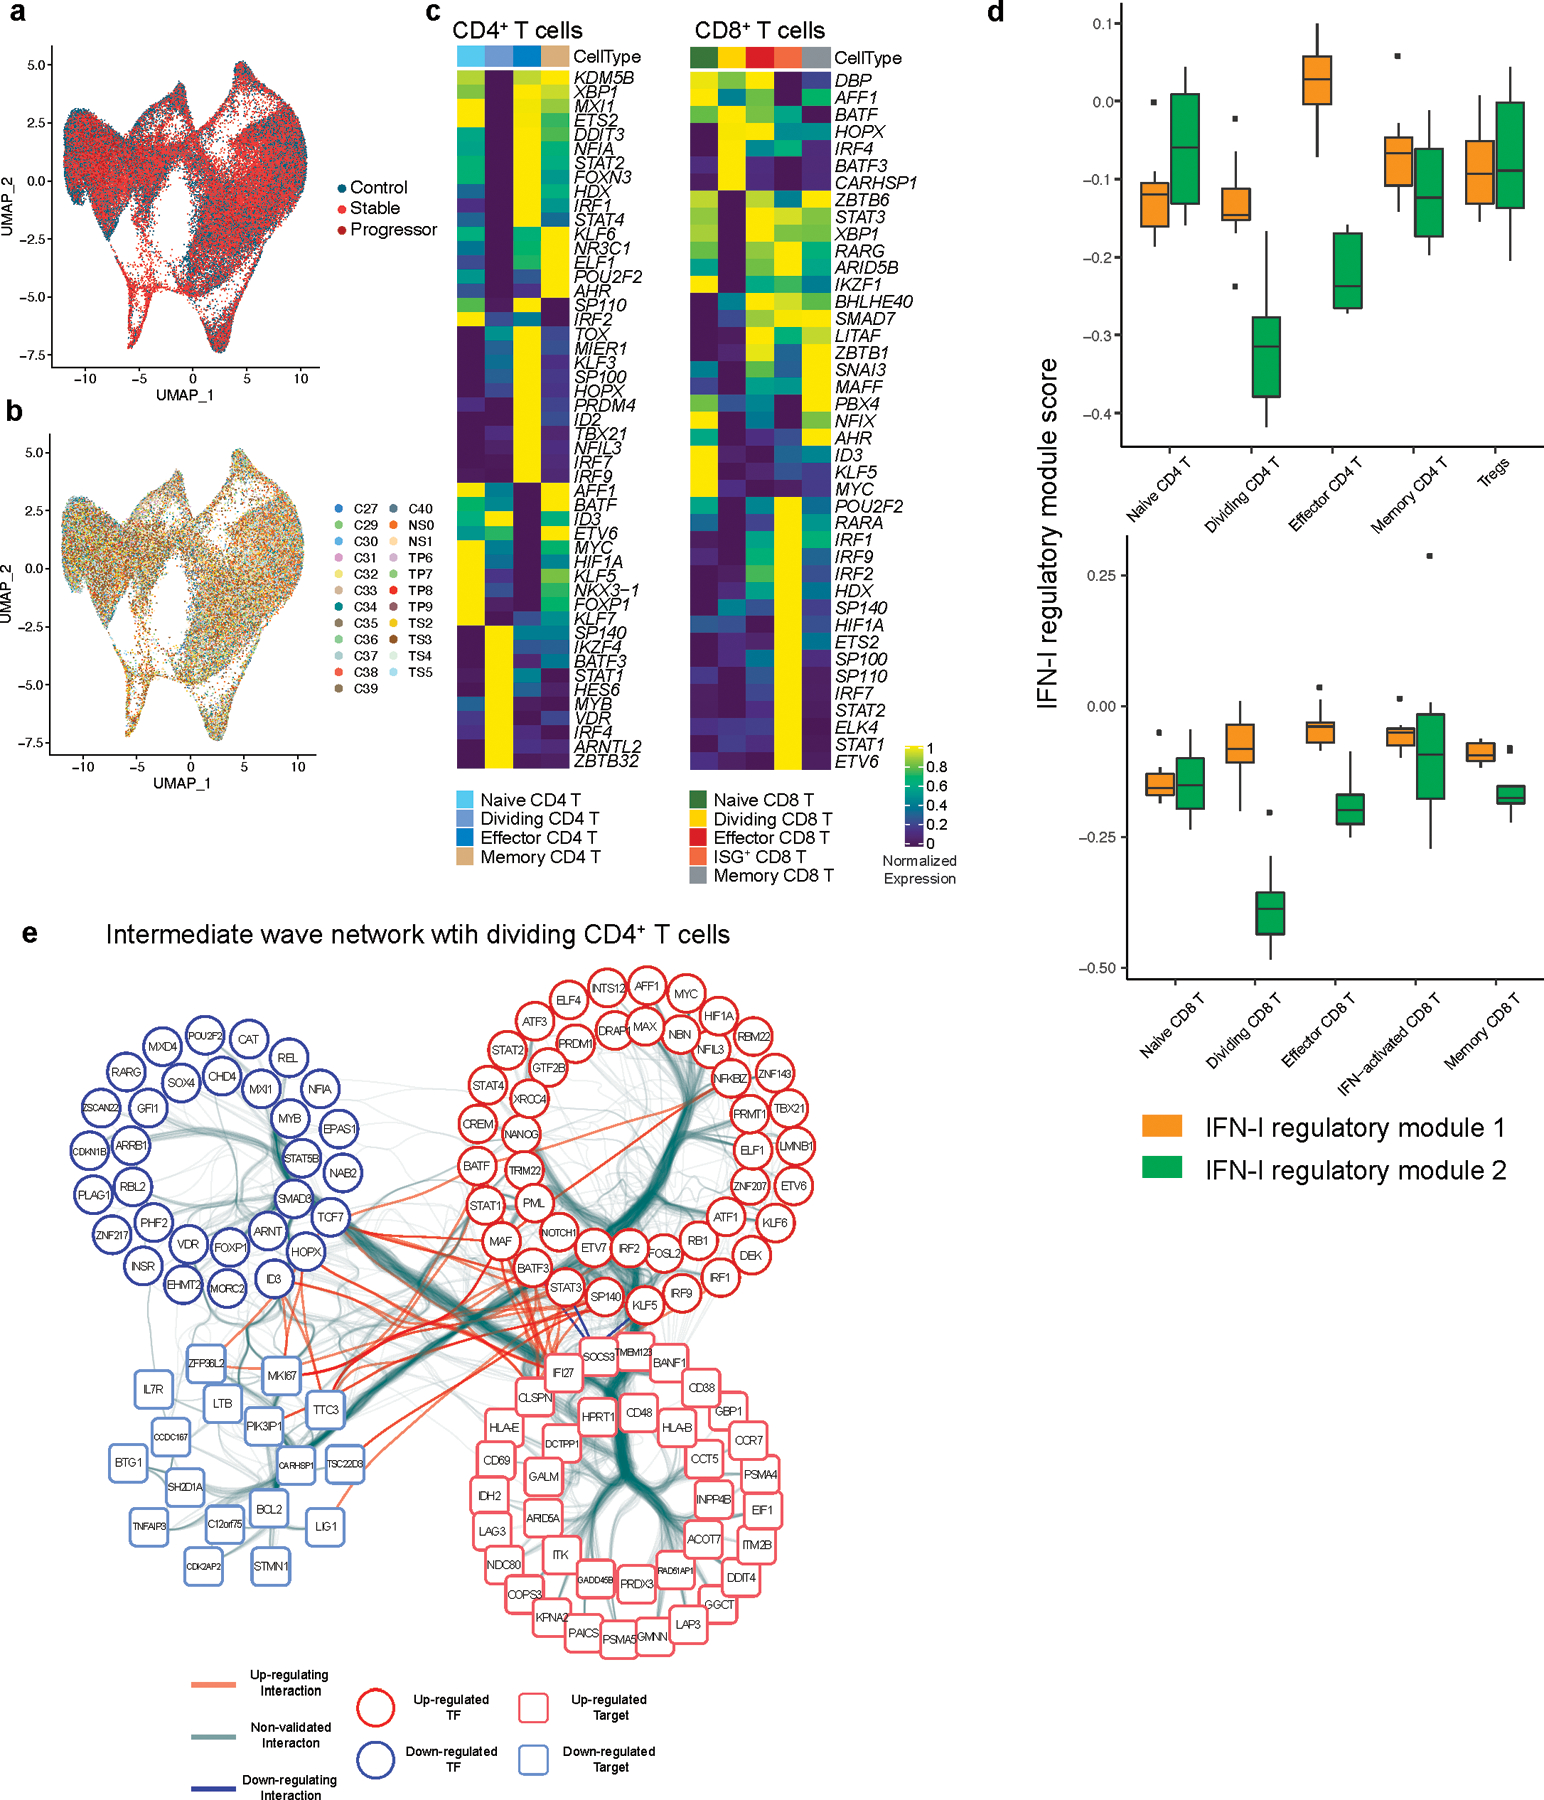
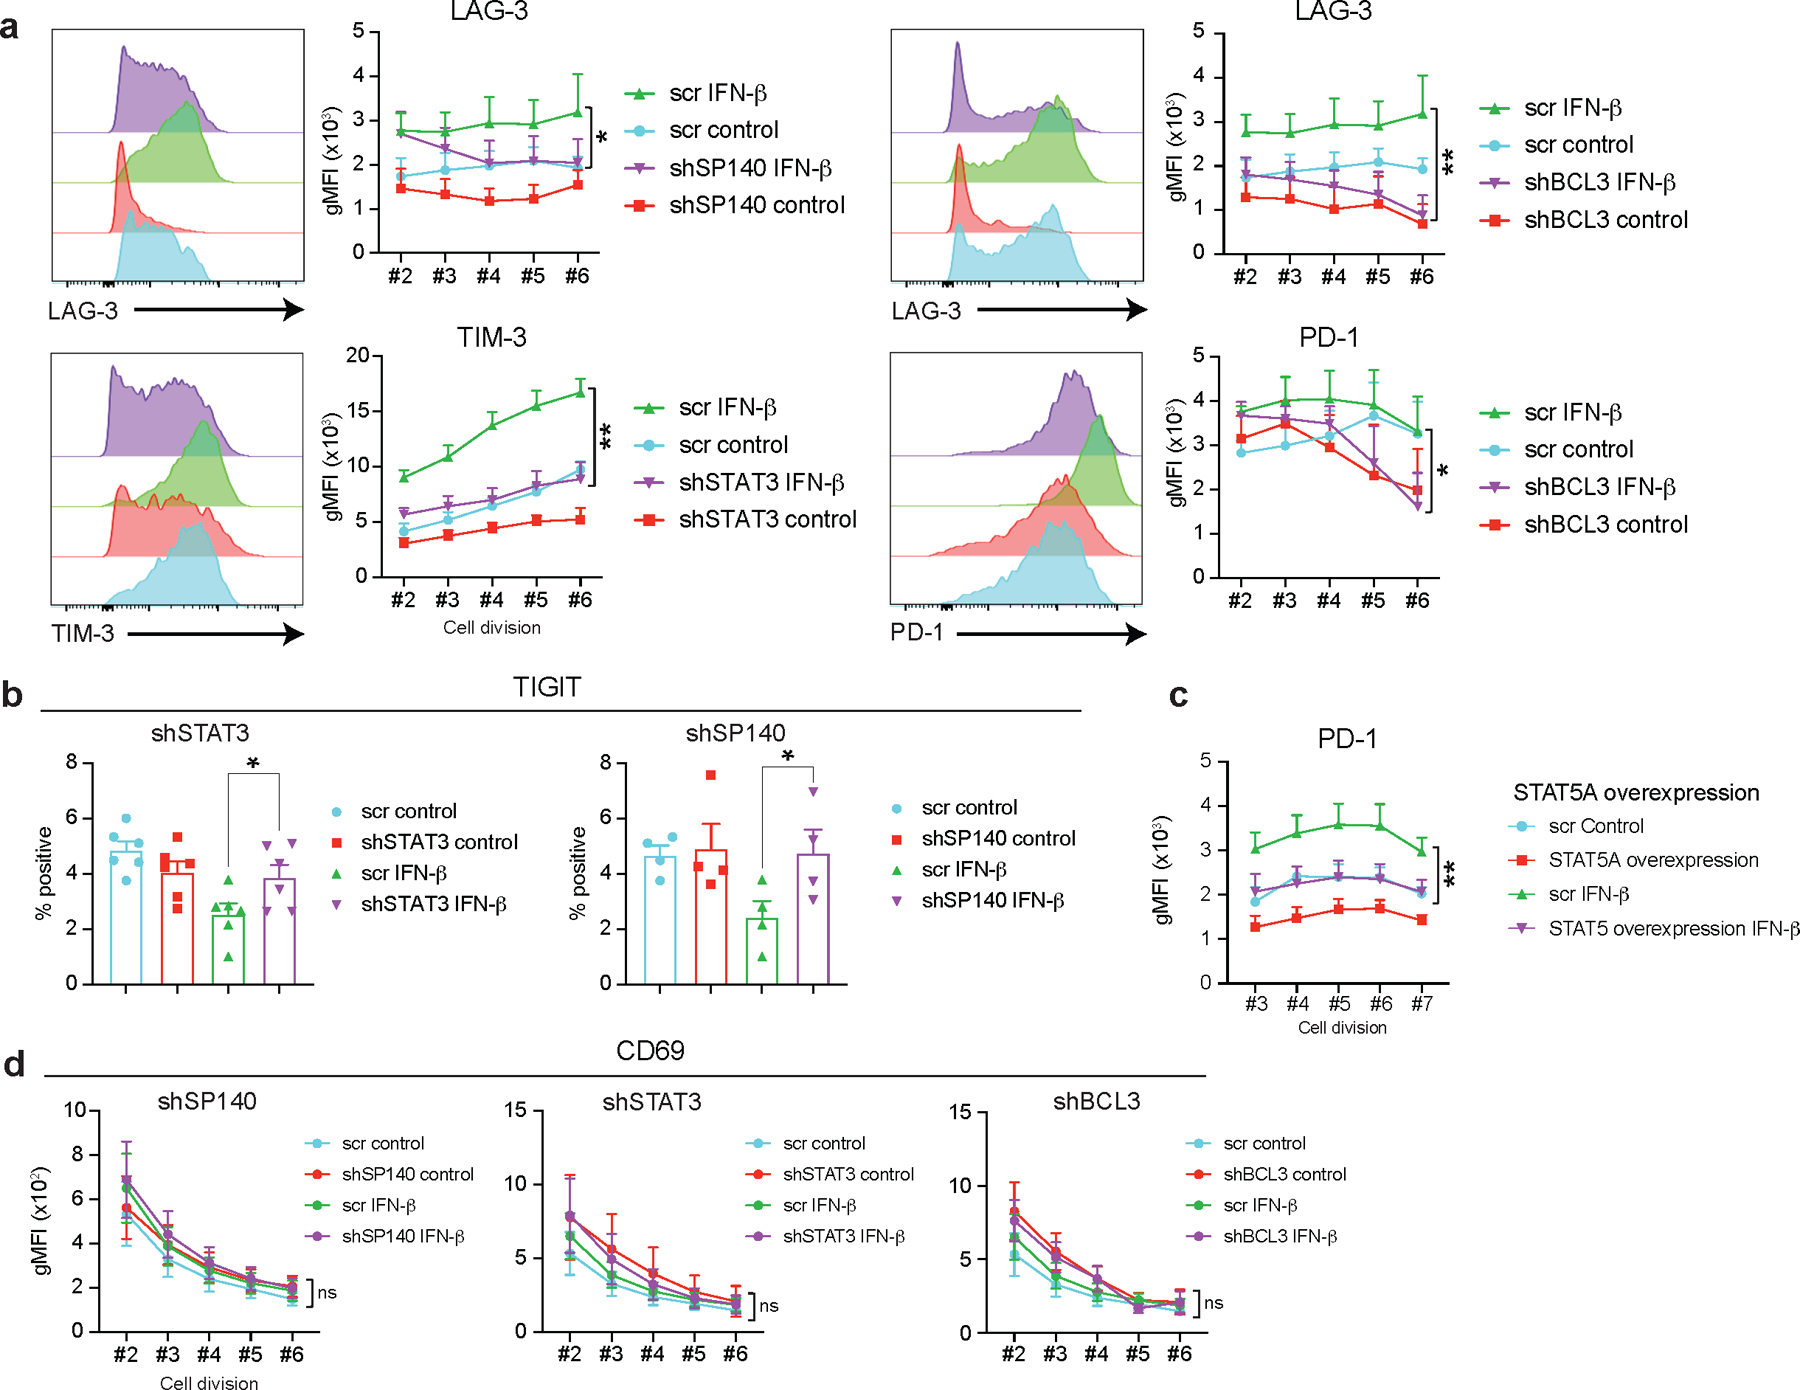
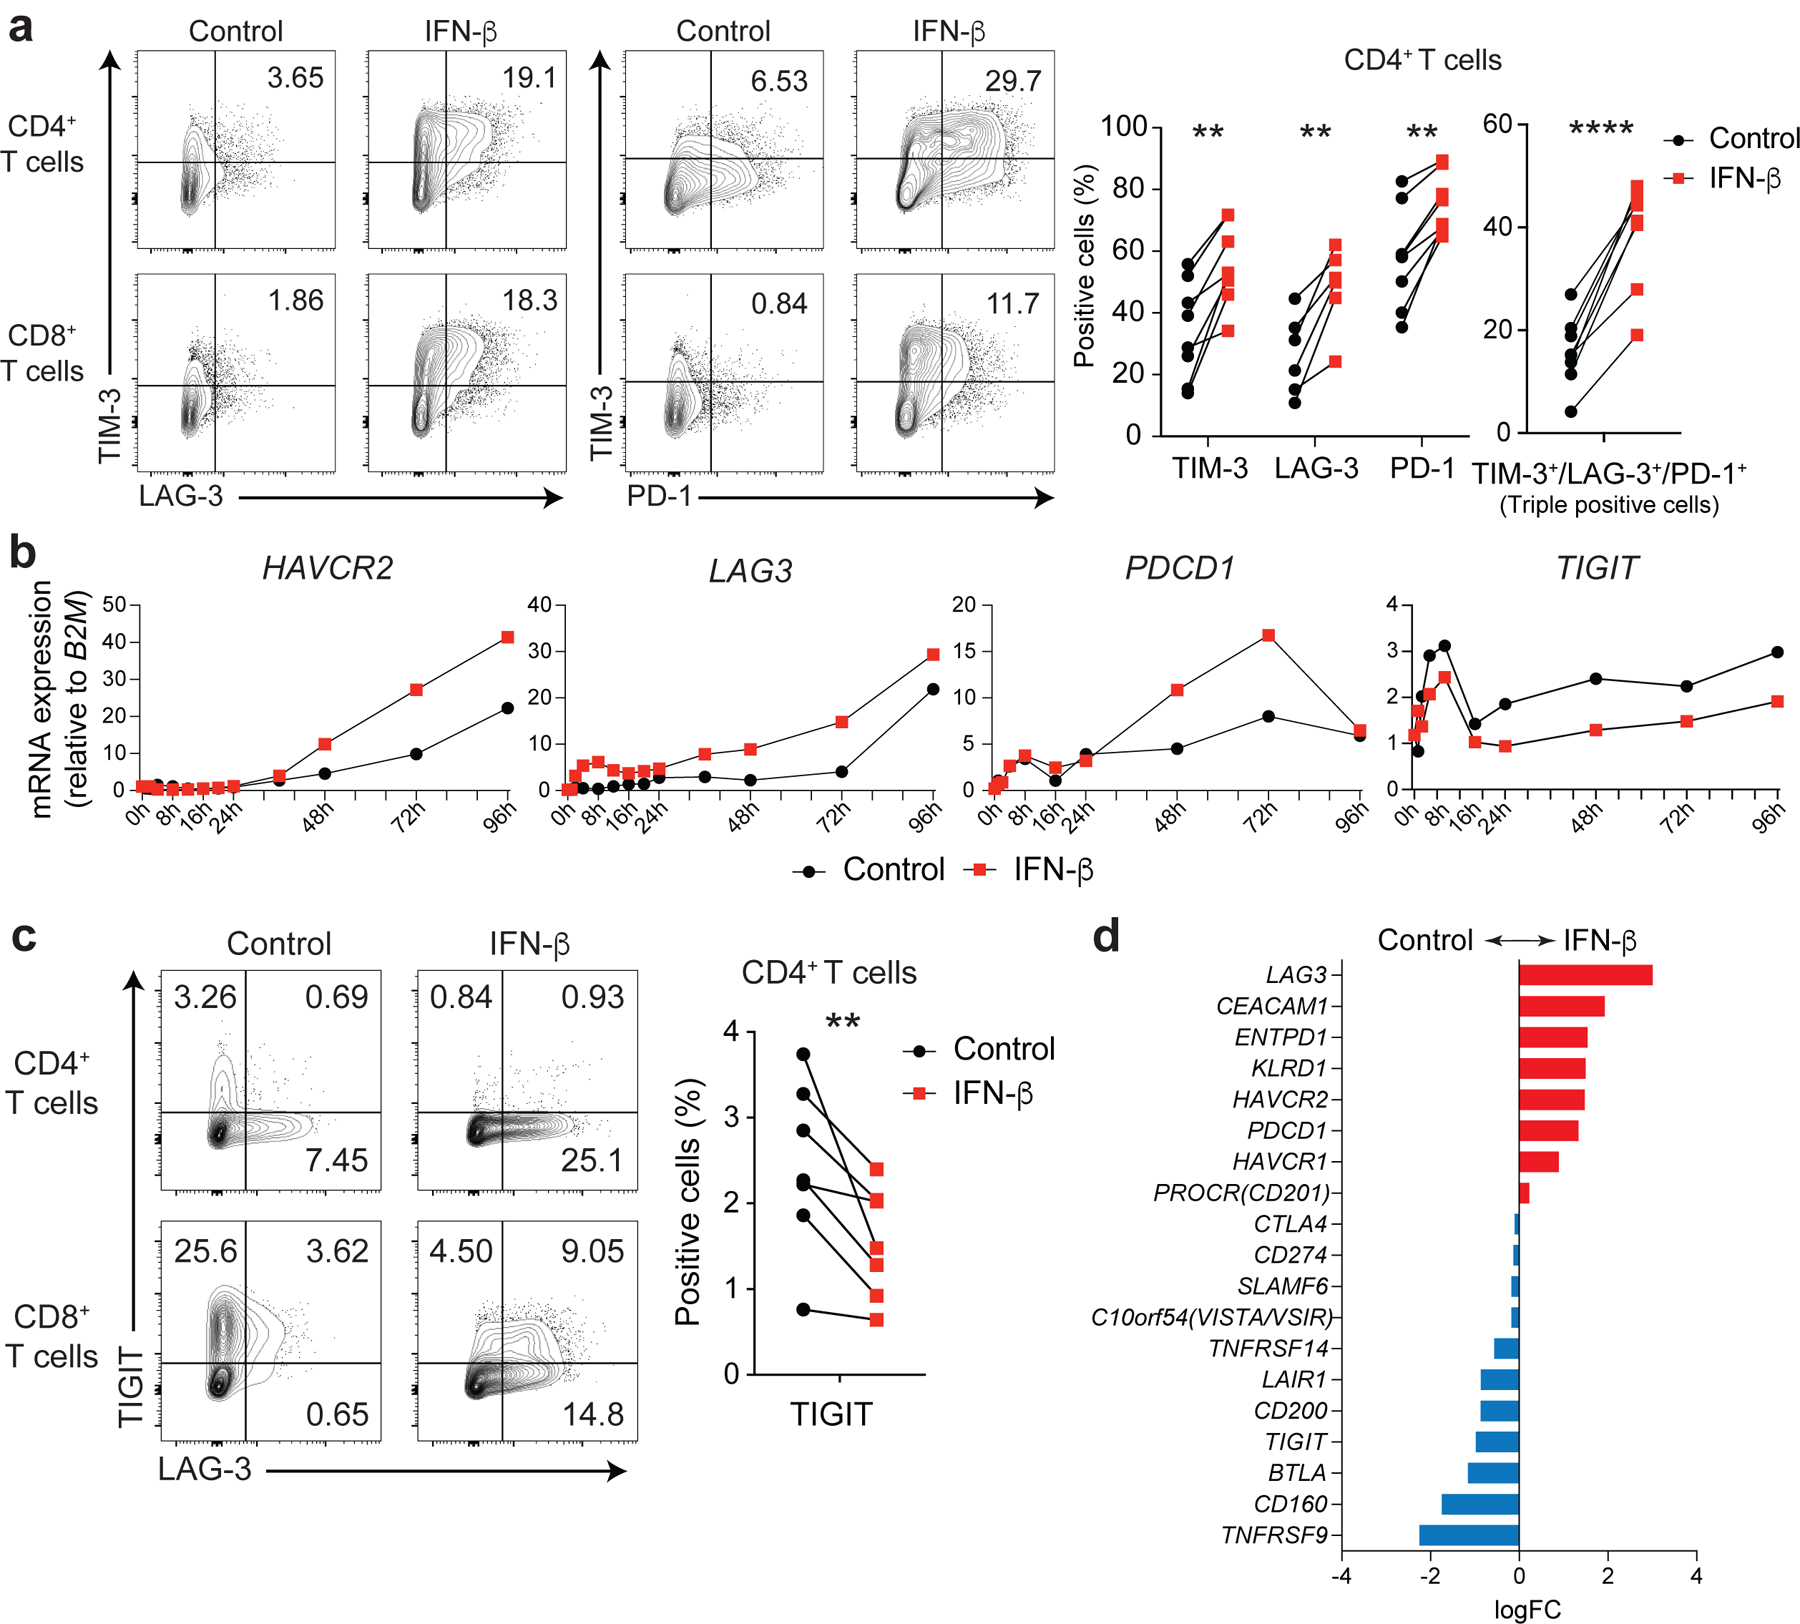
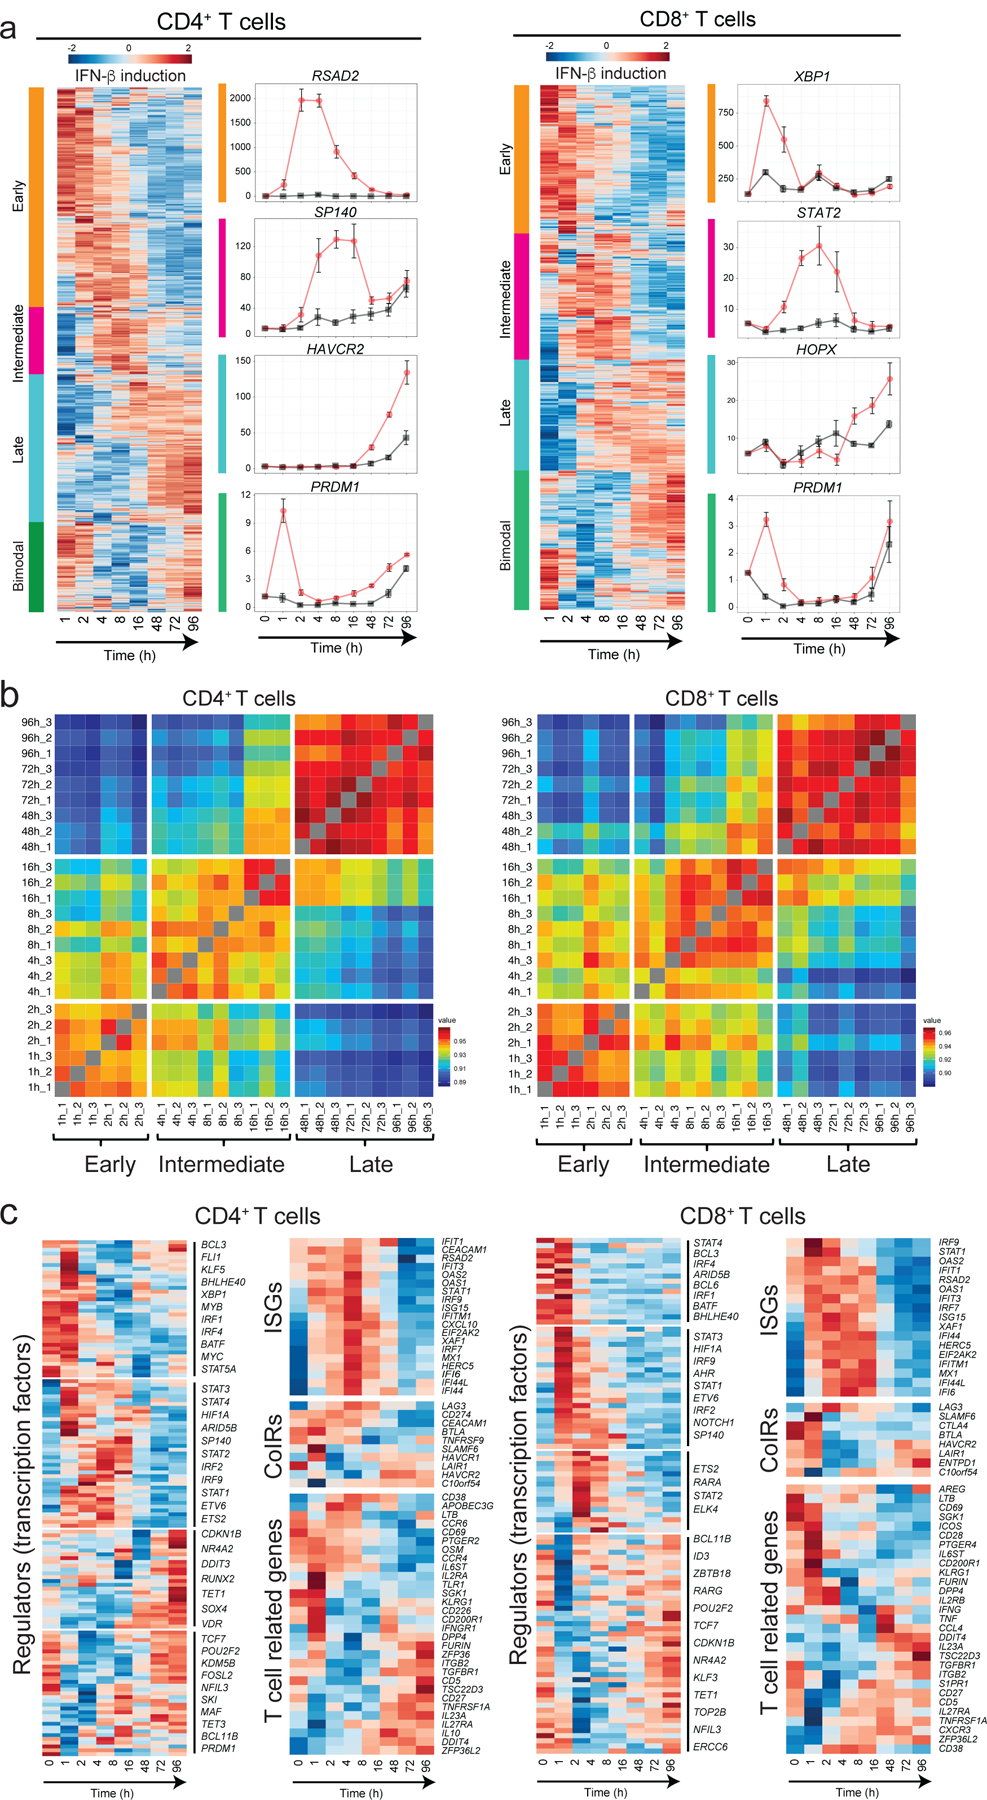
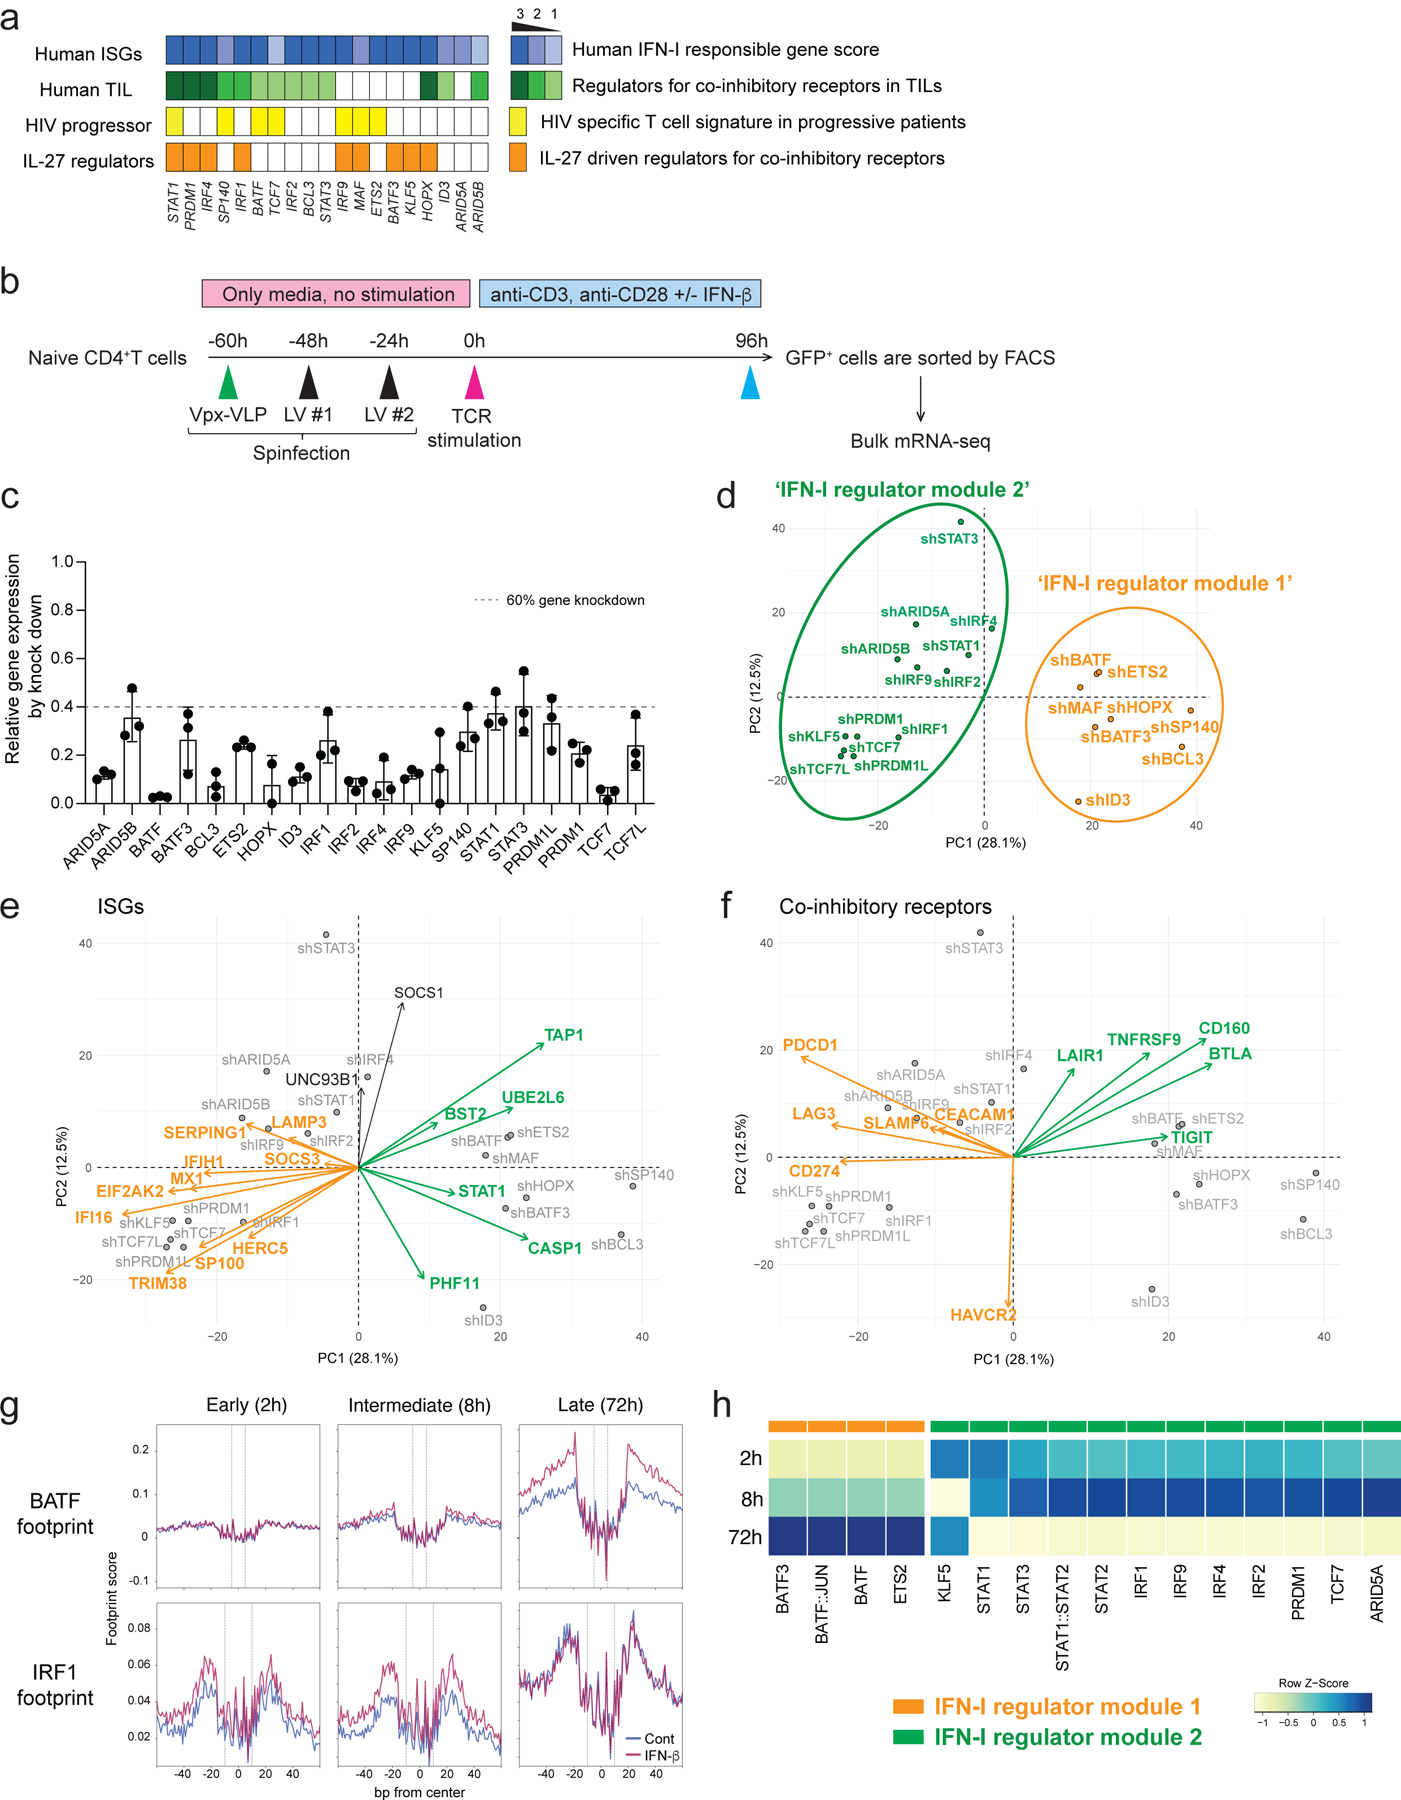
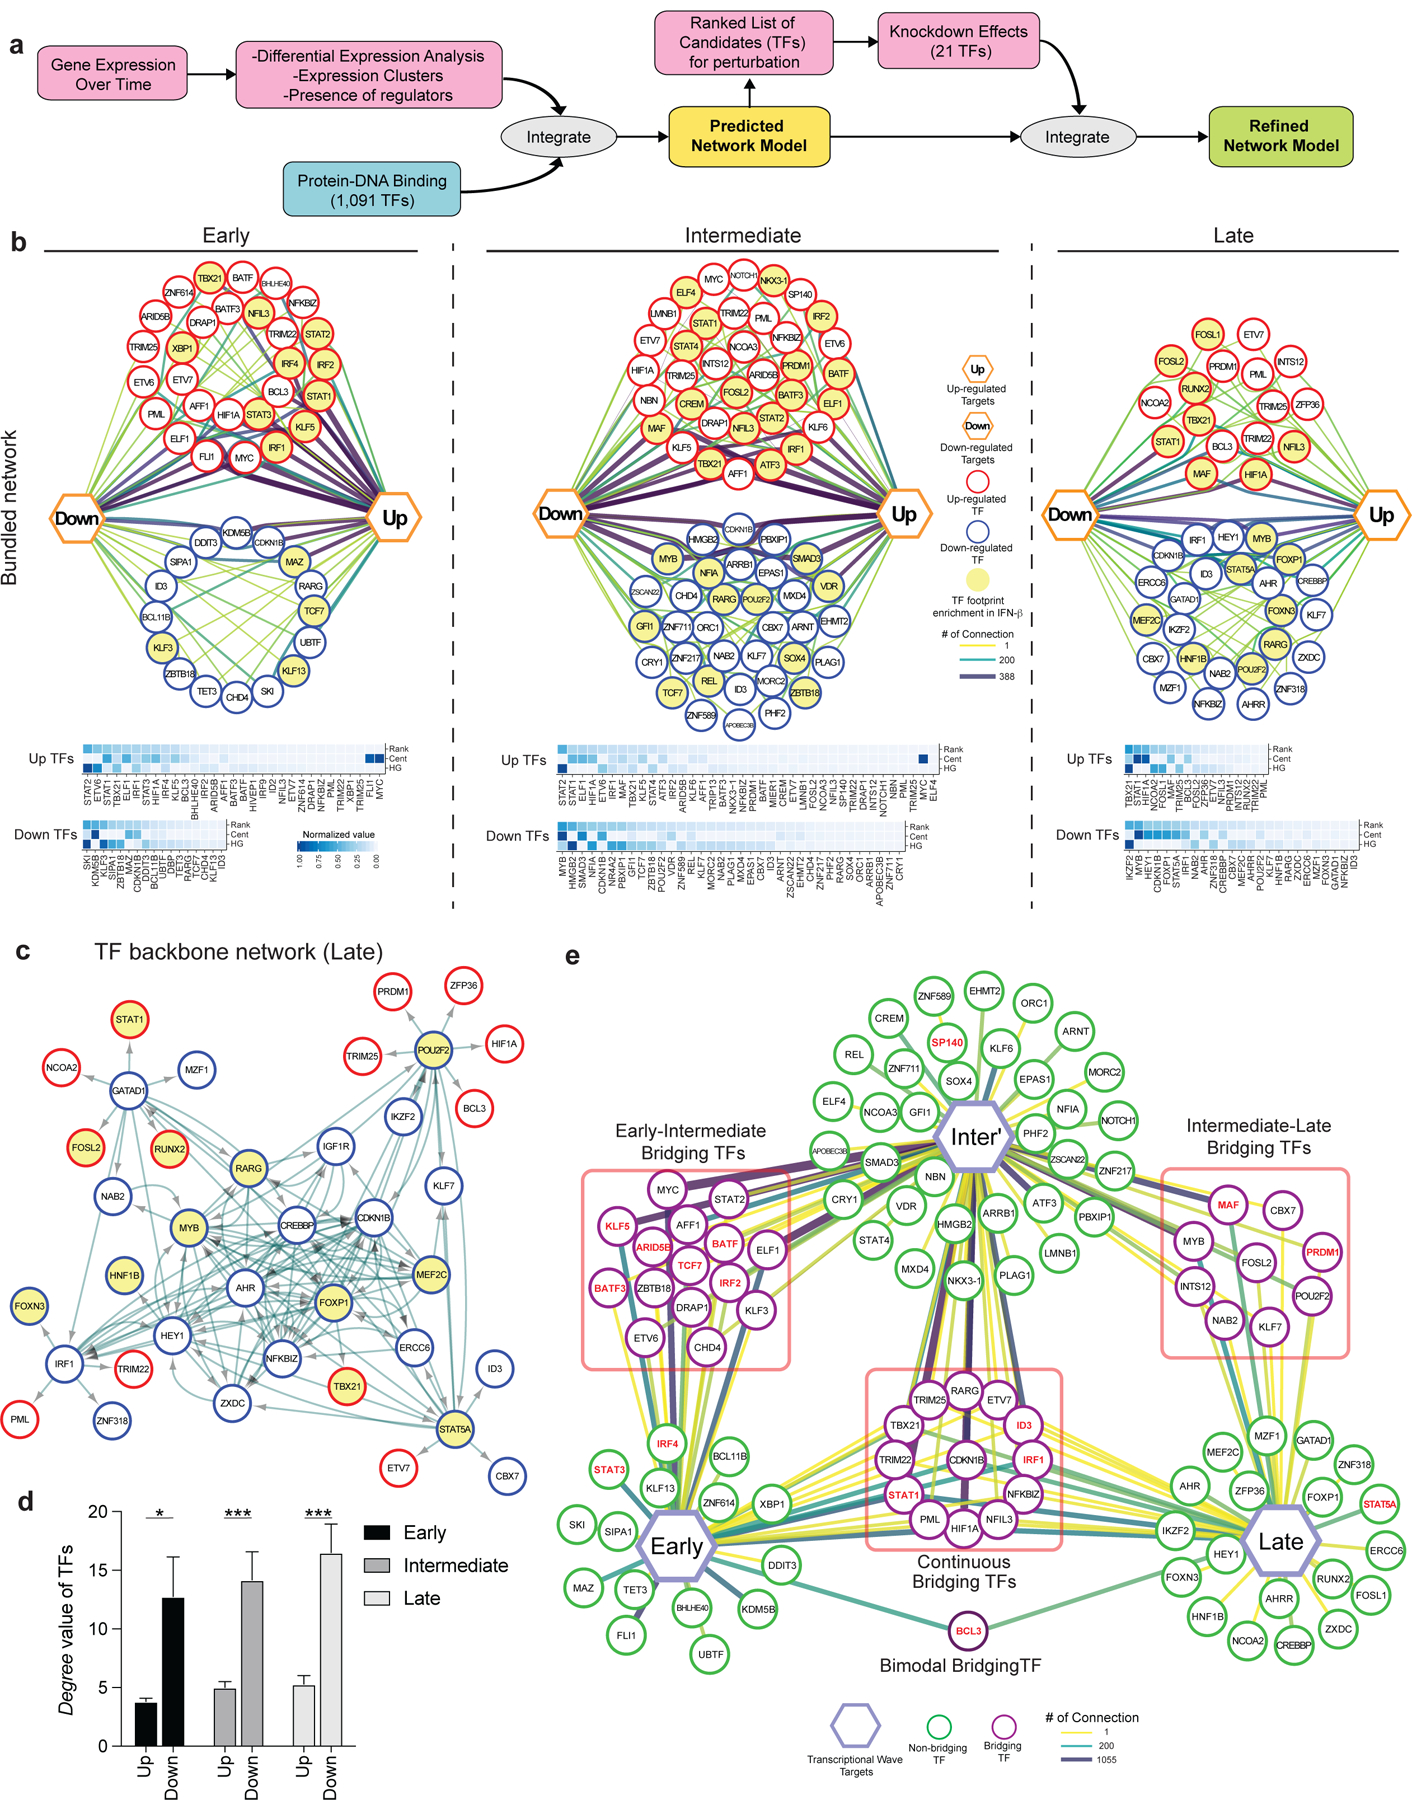
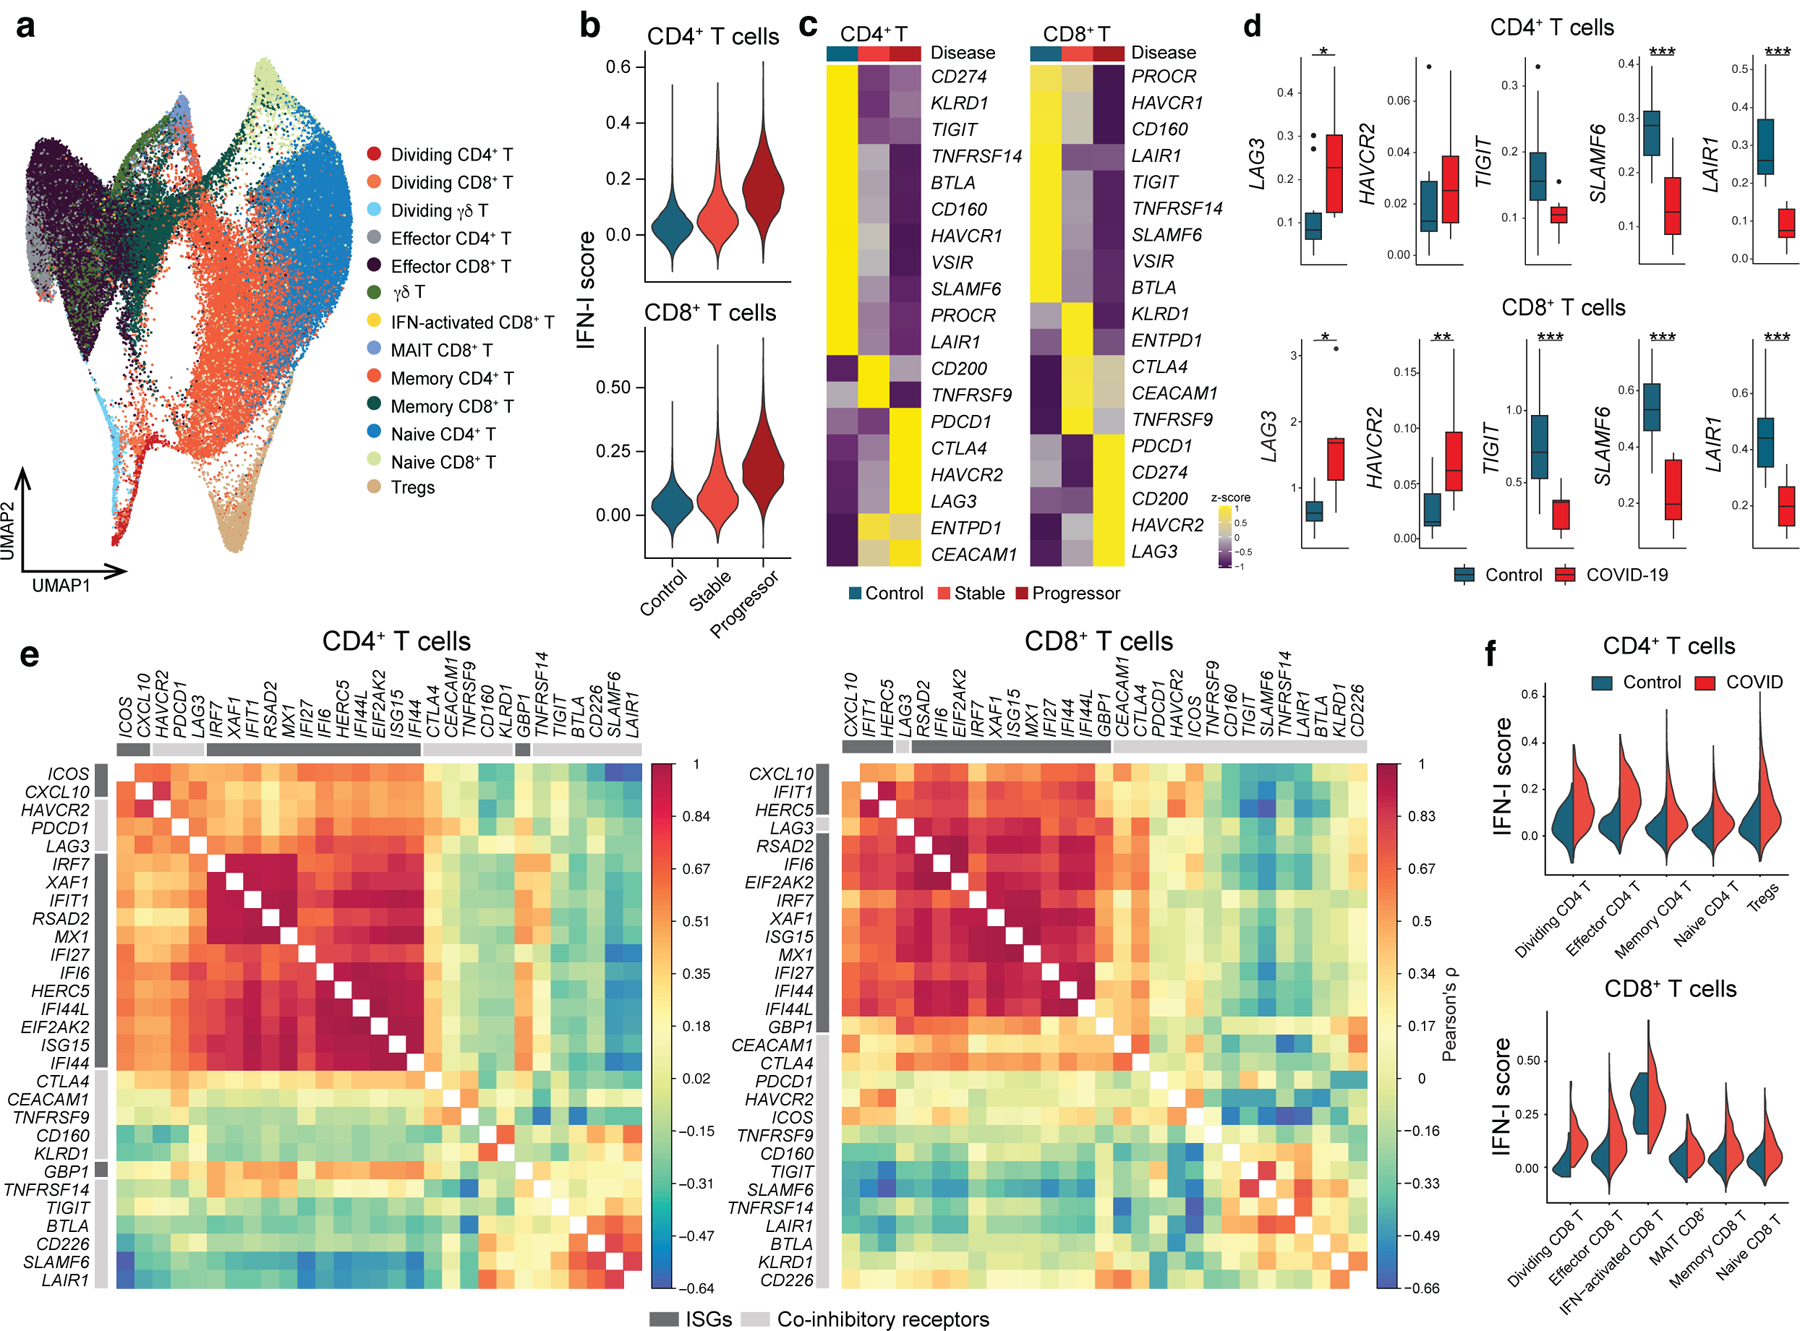
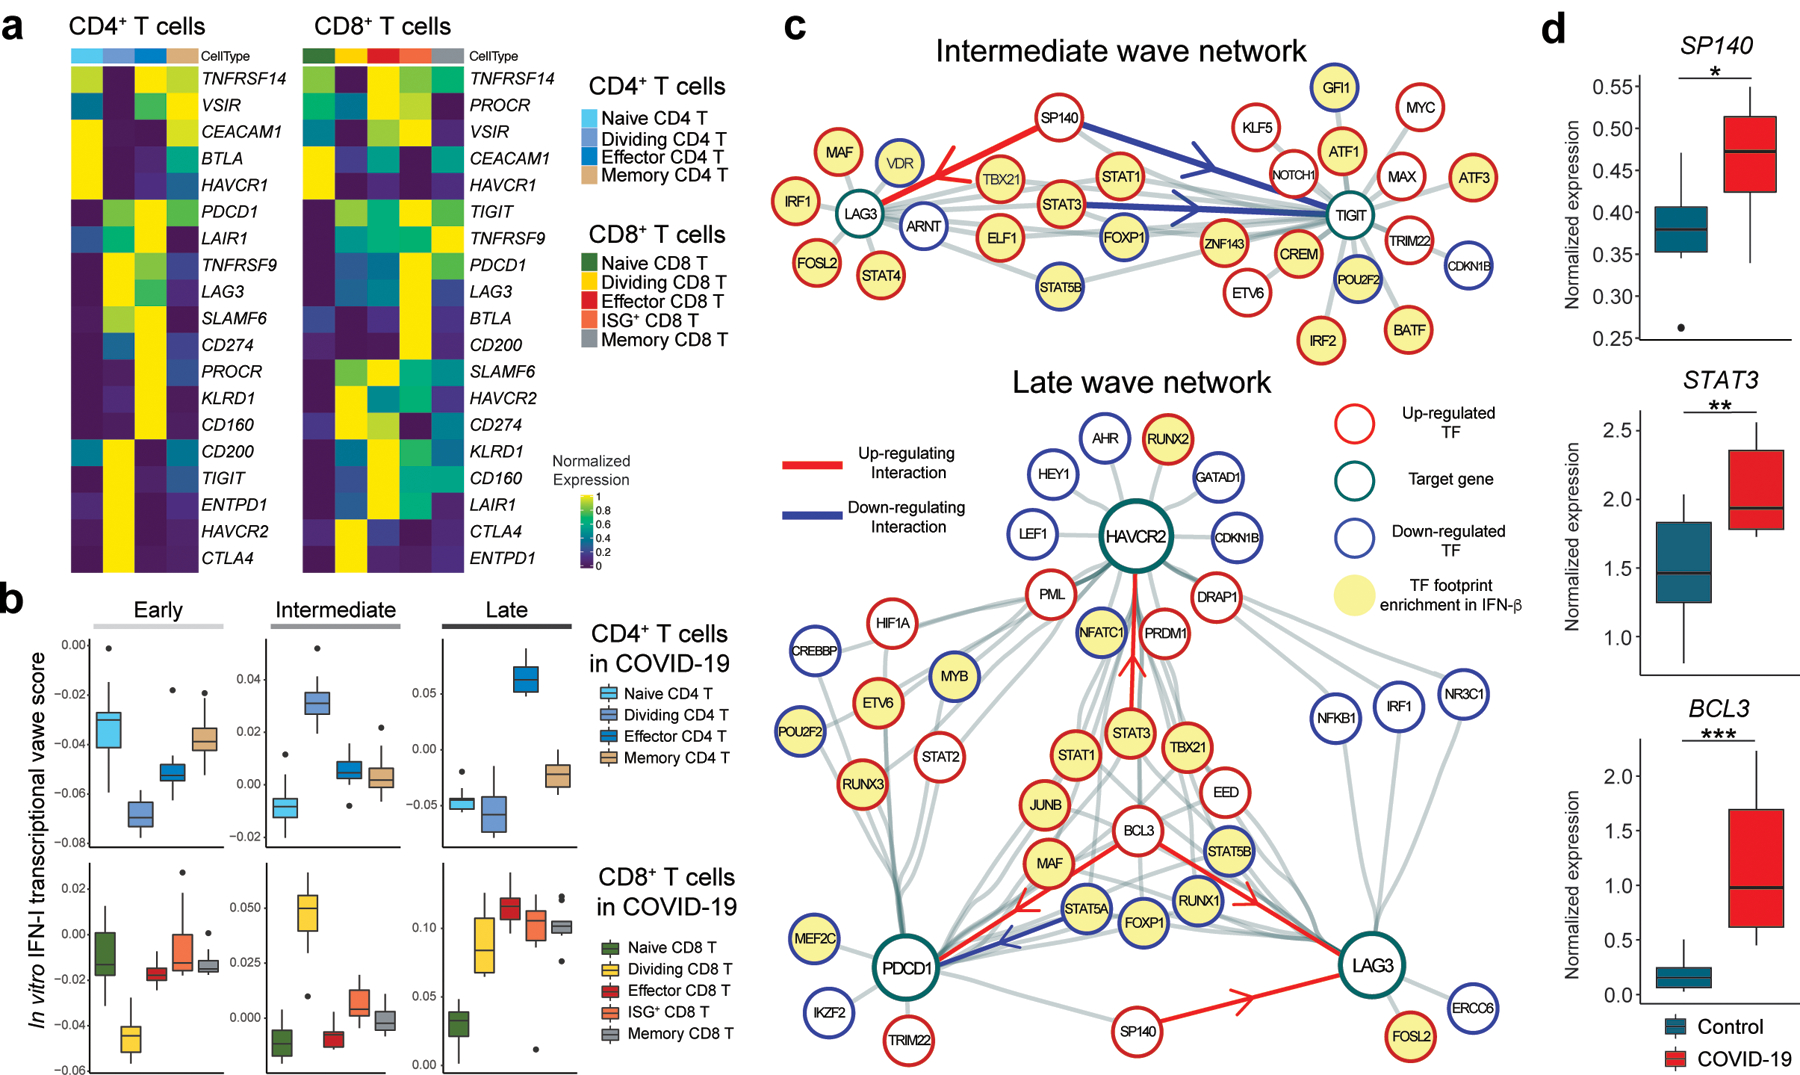
Although inhibition of T cell coinhibitory receptors has revolutionized cancer therapy, the mechanisms governing their expression on human T cells have not been elucidated. In the present study, we show that type 1 interferon (IFN-I) regulates coinhibitory receptor expression on human T cells, inducing PD-1/TIM-3/LAG-3 while inhibiting TIGIT expression. High-temporal-resolution mRNA profiling of IFN-I responses established the dynamic regulatory networks uncovering three temporal transcriptional waves. Perturbation of key transcription factors (TFs) and TF footprint analysis revealed two regulator modules with different temporal kinetics that control expression of coinhibitory receptors and IFN-I response genes, with SP140 highlighted as one of the key regulators that differentiates LAG-3 and TIGIT expression. Finally, we found that the dynamic IFN-I response in vitro closely mirrored T cell features in acute SARS-CoV-2 infection. The identification of unique TFs controlling coinhibitory receptor expression under IFN-I response may provide targets for enhancement of immunotherapy in cancer, infectious diseases and autoimmunity.


Conflict of interest statement

Competing interests

D.A.H. has received research funding from Bristol-Myers Squibb, Sanofi, and Genentech. He has been a consultant for Bristol Myers Squibb, Compass Therapeutics, EMD Serono, Genentech, and Sanofi Genzyme over the last three years. Further information regarding funding is available on: https://openpaymentsdata.cms.gov/physician/166753/. V.K.K. has an ownership interest and is a member of the SAB for Tizona Therapeutics. V.K.K. is also a co-founder and has an ownership interest and a member of SAB in Celsius Therapeutics and Bicara Therapeutics. V.K.K.’s interests were reviewed and managed by the Brigham and Women’s Hospital and Partners Healthcare in accordance with their conflict of interest policies. N.K. served as a consultant to Biogen Idec, Boehringer Ingelheim, Third Rock, Pliant, Samumed, NuMedii, Theravance, LifeMax, Three Lake Partners, Optikira, Astra Zeneca over the last 3 years, reports Equity in Pliant and a grant from Veracyte and non-financial support from MiRagen and Astra Zeneca. Has IP on novel biomarkers and therapeutics in IPF licensed to Biotech. The remaining authors declare no competing interests.

Figures

Extended Data Fig. 1
Extended Data Fig. 1. FACS gating strategy for isolating naïve CD4+ and CD8+ T cells and schematic experimental workflow
Representative gating strategy for sorting naïve CD4+ and CD8+ T cells are shown. FACS isolated cells were immediately plated on 96 well round bottom plates coated with anti-CD3 (2 μg/ml) and soluble anti-CD28 (1 μg/ml) in the absence or presence of human IL-27 (100 ng/ml) or IFN-β (500 U/ml).
Extended Data Fig. 2
Extended Data Fig. 2. IFN-β differently regulates co-inhibitory receptors in human T cells
a, Representative histograms of surface expression of TIM-3, LAG-3, and PD-1 assessed by flow cytometry at 72–96 hours after stimulation. Dotted lines represent isotype control staining. Percent single positive cells for TIM-3, LAG-3, and PD-1 (middle) and triple positive cells (right) are shown (n = 6–8; biologically independent samples). *p < 0.05, **p < 0.01, ****p < 0.0001. b, Representative contour plots of flow cytometry analysis for TIM-3 and TIGIT expression in naïve CD4+ and CD8+ T cells (left). Cells were treated as Extended Data 1 and analyzed at 72 hours of culture. Percent TIGIT positive cells in naïve CD4+ T are shown (n = 8; biologically independent samples). *p < 0.05, **p < 0.01. (middle). qPCR analysis of TIGIT expression over the time course (13 time points from 0 to 96 hours). Each dot represents the average expression of two independent individuals’ data. ****p < 0.0001. c, qPCR analysis of IL10 and IFNG expression over the time course (13 time points from 0 to 96 hours). Each dot represents the average expression of two independent individuals’ data (left). IL-10 and IFN-γ production assessed by intracellular staining (right). Cells are treated as in a, and cytokines are stained intracellularly. Cytokine positive cells are detected by flow cytometry (n = 6; biologically independent samples). d, Representative contour plots of flow cytometry analysis for CD160 and BTLA expression and overlayed histogram for BTLA expression in naïve CD4+ and CD8+ T cells (left). Cells were treated as outlined in b and analyzed at 72 hours of culture. Percent positive cells for CD160 and BTLA in naïve CD4+ T are shown (n = 8; biologically independent samples) (right). *p < 0.05, **p < 0.01. Repeated-measures one-way ANOVA with Tukey’s multiple comparisons test (a-c), and paired student’s t-test (d).
Extended Data Fig. 3
Extended Data Fig. 3. The impact of IFN-β on co-inhibitory receptors is not associated with T cell activation
a, Representative plots for T cell proliferation assay using cell trace violet dye. Naive and memory CD4+ T cells were stimulated with anti-CD3 and anti-CD28 in the absence or presence of IFN-β. TIM-3 expression and cellular proliferation were assessed at 24, 48, 72, and 96 hours after stimulation. Overlayed histogram for control and IFN-β condition were shown at right. b, Frequency of living cells at each cellular division state was calculated in naïve CD4+ T cells (left) and naïve CD8+ T cells (right) at 96 hours. There is no statistical difference observed between control vs IFN-β condition (n=5; biologically independent samples). c, T cell activation markers (CD44, CD25, CD69) were quantified by flow cytometry in naïve CD4+ T cells at 96 hours. There is no statistical difference observed between control vs IFN-β condition (n=4–5; biologically independent samples). d, Dose dependent effects of IFN-β on co-inhibitory receptors assessed by flow cytometry (n=6; biologically independent samples). *p < 0.05, **p < 0.01, ***p < 0.001, ****p < 0.0001. Two-way ANOVA with Dunnett’s multiple comparisons test. e, LAG-3, PD-1, TIM-3, and TIGIT expressions were assessed by flow cytometry at each cellular division state (n=4; biologically independent samples). *p < 0.05, **p < 0.01, ***p < 0.001. Paired t test at each time point. Data was represented with mean +/− SEM.
Extended Data Fig. 4
Extended Data Fig. 4. Dynamic transcriptomic changes by IFN-β in human T cells
a, Schematic experimental setup for high temporal resolution transcriptional profiling. b, Heatmap showing log fold change of DE gene expression between IFN-β and control Th0 condition at each timepoints for naive CD4+ (left) and CD8+ T cells (right). Genes are clustered based on the three transcriptional wave or bi-modal pattern. c, Line plots for IFI6, IFNG, LAG3, OSM, STAT1, and STAT2 expression in naive CD4+ (left) and CD8+ T cells (right).
Extended Data Fig. 5
Extended Data Fig. 5. Dynamic changes of chromatin accessibility by IFN-β in human T cells
a, Schematic experimental setup for ATAC-seq experiment. b, PCA plots based on ATAC-seq peaks. Each dot represents one sample demonstrating the difference between the control and IFN-β groups, and the four different time points (0h, 2h, 8h, 72h). c, Pie charts depicting the differential chromatin accessibility between two time points, for both control and IFN-β treatment. The red or blue colored areas represent the numbers of opened or closed ATAC peaks compared to earlier time point, respectively. d, Bar plots describing the differential accessibility between IFN-β treatment and control at each time points.
Extended Data Fig. 6
Extended Data Fig. 6. Two IFN-I regulatory modules govern both transcriptional and epigenetic changes during IFN-I response
a, Contour plots for total living cells and backgating analysis for GFP positive cells. Primary naïve CD4+ T cells were transduced with scramble shRNA control LV with or without Vpx-VLPs pre-transduction. Cells are collected at 96 hours after starting stimulation and analyzed by flow cytometry. b, c, Heatmaps showing the effect of TFs perturbation under IFN-β stimulation on ISGs (b) and co-inhibitory receptors (c). Values in the heatmap were normalized by subtractions of log10 fold change of scramble shRNA control over perturbed expression. The “+” sign indicates a statistically significant effect with an adjusted P.value < 0.05 (details in Methods). d, Volcano plots depicting differential TF binding activity against the −log10(p value) (both provided by TOBIAS) of all investigated TF motifs; each dot represents one motif. Positive binding activity represents more enrichment in IFN-β treatment compared to control. The motifs for IFN-I regulator module 1 and IFN-I regulator module 2 were highlighted in orange and green, respectively.
Extended Data Fig. 7
Extended Data Fig. 7. Backbone network analysis identify downregulated TGF-β signature during IFN-I response
a, Directed TF backbone networks at the early and intermediate waves. The regulation and interaction of each DETFs at each transcriptional wave were depicted. TF footprints enriched in IFN-β condition were highlighted in yellow. b, ssGSEA for TGF-β signaling pathways with upregulated TFs (Up) and downregulated TFs (Down) at each transcriptional wave. Adjusted p values are shown and the dotted line indicates a threshold of significance defined by adjusted p value = 0.05. **p < 0.01, ***p < 0.001. Data was represented with mean +/− SEM.
Extended Data Fig. 8
Extended Data Fig. 8. IFN-I regulator expression profiles in T cells from COVID-19
a, b, UMAP representation of T cells from healthy control samples (n = 13; biologically independent samples) and COVID-19 samples (n = 18; biologically independent samples) color coded by a, disease conditions and b, each individual. Cells from the same individual were labeled as one subject code, which resulted in 10 individual codes shown in b. c, Heatmap showing the expression of DETFs for CD4+ and CD8+ T cells in each T cell subset. d, IFN-I regulator module 1 and 2 scores for CD4+ and CD8+ T cells across sub cell types. e, Bundled regulatory network showing interactions between regulators at intermediate phase and transcriptional signature of dividing CD4+ T cells in COVID-19. Regulators at the intermediate phase are marked with circles (red; upregulated TFs, blue; downregulated TFs), and genes that are differentially expressed in dividing CD4+ T cells in COVID-19 were marked with squares (light red; upregulated DEGs, light blue; downregulated DEGs).
Extended Data Fig. 9
Extended Data Fig. 9. Validation of key IFN-I regulators controlling co-inhibitory receptors in human T cells
a, Co-inhibitory receptor expression was assessed at each cellular division state (division #2–6) under each TF gene knockdown performed as well as in Figure 3. The effects of each gene perturbation over GFP control vector (GFP) treated with IFN-β were determined by repeated-measures two-way ANOVA with Fisher’s LSD test. The statistical significance between GFP control vector with IFN-β (GFP + IFN-β) vs gene knockdown with IFN-β (shRNA + IFN-β) condition was shown. *p < 0.05, **p < 0.01. b, Frequency of TIGIT positive cells was determined in perturbation for SP140 and STAT3 (n=4; biologically independent samples). *p < 0.05. c, STAT5A was overexpressed on human primary naïve CD4+ T cells and PD-1 expression was shown at each cellular division state (division #3–7). Repeated-measures two-way ANOVA with Fisher’s LSD test was applied and the comparison between GFP control vector with IFN-β (GFP + IFN-β) vs STAT5A overexpression with IFN-β (STAT5A overexpression + IFN-β) condition was shown (n=6; biologically independent samples). **p < 0.01. d, CD69 expression was assessed at each cellular division state with three TF perturbation experiments (SP140, STAT3, and BCL3) (n=4; biologically independent samples). Statistics were determined as well as in a. ns; not significant. Data was represented with mean +/− SEM.
Figure 1
Figure 1. IFN-β differently regulates LAG-3, TIM-3, PD-1 and TIGIT in human T cells
Effects of IFN-β on LAG-3, TIM-3, PD-1, and TIGIT expression on human naïve CD4+ and CD8+ T cells cultured with anti-CD3/CD28 for 96h in the absence (Control) or with 500 U/ml IFN-β (IFN-β). a, Representative contour plots of flow cytometry analysis on surface LAG-3, TIM-3, and PD-1 (left), quantitative expression for LAG-3, TIM-3, and PD-1 expression on naïve CD4+ T cells (n = 6; biologically independent samples) (middle), quantitative analysis for triple-positive (LAG-3, TIM-3, and PD-1) cells in naïve CD4+ T cells (n = 6; biologically independent samples) (right). b, Gene expression kinetics of LAG3, HAVCR2, PDCD1, and TIGIT quantified by qPCR with 13 timepoints in naïve CD4+ T cells. Average expression values from two subjects are plotted. c, IFN-β induces LAG-3 but suppresses TIGIT expression on human naïve CD4+ and CD8+ T cells. Representative contour plots of flow cytometry analysis (left), quantitative analysis for TIGIT positive cells in naïve CD4+ T cells (n = 8; biologically independent samples) (right). d, Co-inhibitory receptors expression pattern under IFN-β treatment in naïve CD4+ T cells by qPCR (n = 4; biologically independent samples). Red and blue bars represent higher expression in IFN-β treatment and Control conditions, respectively. Data was represented as mean +/− SD. **p < 0.01, ****p < 0.0001. Paired Student’s t test.
Figure 2
Figure 2. Three waves of dynamic transcriptomic changes by IFN-β in human T cells
a, Gene expression profiles under IFN-β treatment in naïve CD4+ and CD8+ T cells. Differential expression of gene levels for eight time points with IFN-β stimulation (log2(expression)) are shown in heatmap. Based on the expression kinetics, the genes are clustered into four categories: early, intermediate, late, and bimodal (up regulated at early and late phase). Representative individual gene expression kinetics from each cluster are shown (mean+/− SD). b, Correlation matrix of global gene expression representing three transcriptional waves on CD4+ (left) and CD8+ T cells: early (1–2h), intermediate (4–16h), and late (48–96h). Eight timepoints with three replicates are shown. c, Temporal transcriptional profiles of differentially expressed genes for four categories are shown; transcriptional regulators (transcription factors), ISGs, co-inhibitory receptors, and key T cell associated factors for CD4+ (left) and CD8+ T cells.
Figure 3
Figure 3. Perturbation of key transcription factors in quiescent human T cells
a, Characterization of candidate TFs for perturbation. Perturbed TFs are listed based on the overlap between differentially expressed TFs of CD4+ T cells and CD8+ T cells. Human ISG score (top; blue), human TIL co-inhibitory receptors score (green), HIV specific T cell signature genes in progressive patients (yellow), and IL-27 driven co-inhibitory receptor regulators (orange) are shown for each TFs. b, Experimental workflow of Vpx-VLP supported lentiviral shRNA perturbation. Ex vivo isolated naïve CD4 T cells were transduced with Vpx-VLPs, followed by two times of lentiviral particle transduction before starting T cell activation. T cells were stimulated with anti-CD3/CD28 in the absence or presence of IFN-β (500 U/ml) for 96h and GFP positive cells were sorted by FACS. RNAs were extracted from sorted cells and applied for mRNA-seq. Perturbations for all 21 shRNAs are performed with human CD4+ T cells isolated from the same individual as in Figure 2. c, Gene knockdown efficiency is shown as relative expression over scramble shRNA transduced controls. Dotted line represents 60% of gene knockdown. d-f, PCA plots and biplots based on differentially expressed genes by perturbation. d, PCA plot demonstrating the two modules of TF regulators on perturbation with 21 TFs. Characterization of shRNA-based gene knockdown for each TF being plotted. Labels represent perturbed TF gene names. ‘IFN-I regulator module 1’ is colored in green and ‘IFN-I regulator module 2’ is in orange. e, f, PCA biplot showing differential regulation by modules of regulator TFs; e, for ISGs and f, for co-inhibitory receptors. Orange and green arrows (vectors) are highlighting two groups of genes affected inversely by the different modules of TFs. g, Footprint plots for BATF and IRF1 at three time points (2, 8, 72 h). The dashed lines represent the edges of each TF motif. h, A heatmap showing the TF footprint activity of perturbed TFs across three phases.
Figure 4
Figure 4. Transcriptional regulatory network under IFN-I response
a, Overview of regulatory network generation. b, In depth view of the transcriptional regulation at each transcriptional wave. Top row; the representation of regulatory networks highlighting TFs interaction. The thicker and darker an edge is the more TF-target connections it represents. Target genes are represented by up and down hexagons, according to their response to IFN-β. Middle row: heatmaps representing a ranking of the TFs based on their centrality, connectivity and gene-target enrichment in the corresponding regulatory network. ‘Cent’ stands for centrality, which is a parameter that is given to each node, based on the shortest path from the node to the other nodes in the network. It represents how central and connected a node is to the rest of the network. ‘HG’ stands for hyper-geometric, the value in the heatmap is the log10P.value of a hypergeometric enrichment test of target genes of each TF in the network. The rank column is an average of both HG and Cent values, after score rescaling (0–1). c, Directed TF backbone networks at the late wave. The regulation and interaction of each DE TFs at each transcriptional wave were depicted. b,c, Red circles represent up-regulated TFs, blue circles represent down-regulated TFs, and the arrows represent the direction of regulation from TF to TF. TF footprints enriched in IFN-β condition were highlighted in yellow. d, Bar plot show the mean level of the degree of connectivity values for either up or down regulated DE TFs. p values were calculated by an independent two-way t-test. *p < 0.05, ***p < 0.001. e, Dynamics of TFs regulation across the transcriptional waves. Each hexagon represents targets from each transcriptional wave. Green circles represent regulatory TFs which are differentially expressed only in one transcriptional wave they are connected to, while purple circles represent bridging TFs, which are differentially expressed in all transcriptional waves they are connected to. Perturbed TFs in Figure 3 were highlighted in red. The thicker and darker an edge is, the more TF-target connections it represents.
Figure 5
Figure 5. Linked IFN-I response and co-inhibitory receptor expression in T cells in COVID-19
a, UMAP representation of T cells from healthy control samples (n = 13; biologically independent samples) and COVID-19 samples (n = 18; biologically independent samples). 13 subcluster were identified. b, IFN-I score for CD4+ and CD8+ T cells across the three disease conditions. c, Heatmaps for co-inhibitory receptors expression in CD4+ and CD8+ T cells across the three disease conditions. d, Expression of key co-inhibitory receptors between control vs COVID-19 for CD4+ and CD8+ T cells. Average expression per subject for each gene is shown. *p < 0.05, **p < 0.01, ***p < 0.001. Two-sided Kruskal-Wallis test. e, Correlation matrix of ISGs (dark gray) and co-inhibitory receptors (light gray) in CD4+ and CD8+ T cells in COVID-19 patients. f, IFN-I score for subsets of CD4+ and CD8+ T cells between control vs COVID-19.
Figure 6
Figure 6. Integration of IFN-I regulatory network with T cell signature in COVID-19
a, Heatmap showing co-inhibitory receptors expression for subsets of CD4+ and CD8+ T cells in COVID-19. b, Computed three transcriptional waves (early, intermediate, and late) score for the subsets of CD4+ and CD8+ T cells in COVID-19 patients. Scores were calculated based on upregulated DEGs of CD4+ and CD8+ T cells for each transcriptional wave. c, Regulatory relationship between regulators in intermediate phase network for LAG3 and TIGIT (top) and late phase network for LAG3, HAVCR2, and PDCD1 (bottom) are shown. Positive regulation (TF to target) is highlighted in red and negative regulations in blue. TF footprints enriched in IFN-β condition were highlighted in yellow. d, Box plots showing expression of key regulators between control vs COVID-19 for CD4+ T cells. Average expression per subject for each gene is shown. *p < 0.05, **p < 0.01, ***p < 0.001. Two-sided Kruskal-Wallis test.

Update of

References

    1. Chihara N et al. Induction and transcriptional regulation of the co-inhibitory gene module in T cells. Nature 558, 454–459 (2018). - PMC - PubMed
    1. DeLong JH et al. IL-27 and TCR Stimulation Promote T Cell Expression of Multiple Inhibitory Receptors. Immunohorizons 3, 13–25 (2019). - PMC - PubMed
    1. Curtsinger JM, Valenzuela JO, Agarwal P, Lins D & Mescher MF Type I IFNs provide a third signal to CD8 T cells to stimulate clonal expansion and differentiation. J Immunol 174, 4465–4469 (2005). - PubMed
    1. Marrack P, Kappler J & Mitchell T Type I interferons keep activated T cells alive. J Exp Med 189, 521–530 (1999). - PMC - PubMed
    1. Le Bon A et al. Direct stimulation of T cells by type I IFN enhances the CD8+ T cell response during cross-priming. J Immunol 176, 4682–4689 (2006). - PubMed

References associated with the Methods section

    1. Dobin A et al. STAR: ultrafast universal RNA-seq aligner. Bioinformatics 29, 15–21 (2013). - PMC - PubMed
    1. Li B & Dewey CN RSEM: accurate transcript quantification from RNA-Seq data with or without a reference genome. BMC Bioinformatics 12, 323 (2011). - PMC - PubMed
    1. Ly A, Marsman M & Wagenmakers EJ Analytic posteriors for Pearson’s correlation coefficient. Stat Neerl 72, 4–13 (2018). - PMC - PubMed
    1. Bojnordi MN et al. Differentiation of Spermatogonia Stem Cells into Functional Mature Neurons Characterized with Differential Gene Expression. Mol Neurobiol 54, 5676–5682 (2017). - PubMed
    1. Love MI, Huber W & Anders S Moderated estimation of fold change and dispersion for RNA-seq data with DESeq2. Genome Biol 15, 550 (2014). - PMC - PubMed

Publication types