. 2022 Jun 1;28(11):2373-2384.
doi: 10.1158/1078-0432.CCR-21-3429.

First Clinical Results of Fluorescence Lifetime-enhanced Tumor Imaging Using Receptor-targeted Fluorescent Probes

Affiliations

First Clinical Results of Fluorescence Lifetime-enhanced Tumor Imaging Using Receptor-targeted Fluorescent Probes

Rahul Pal et al. Clin Cancer Res. .

Abstract

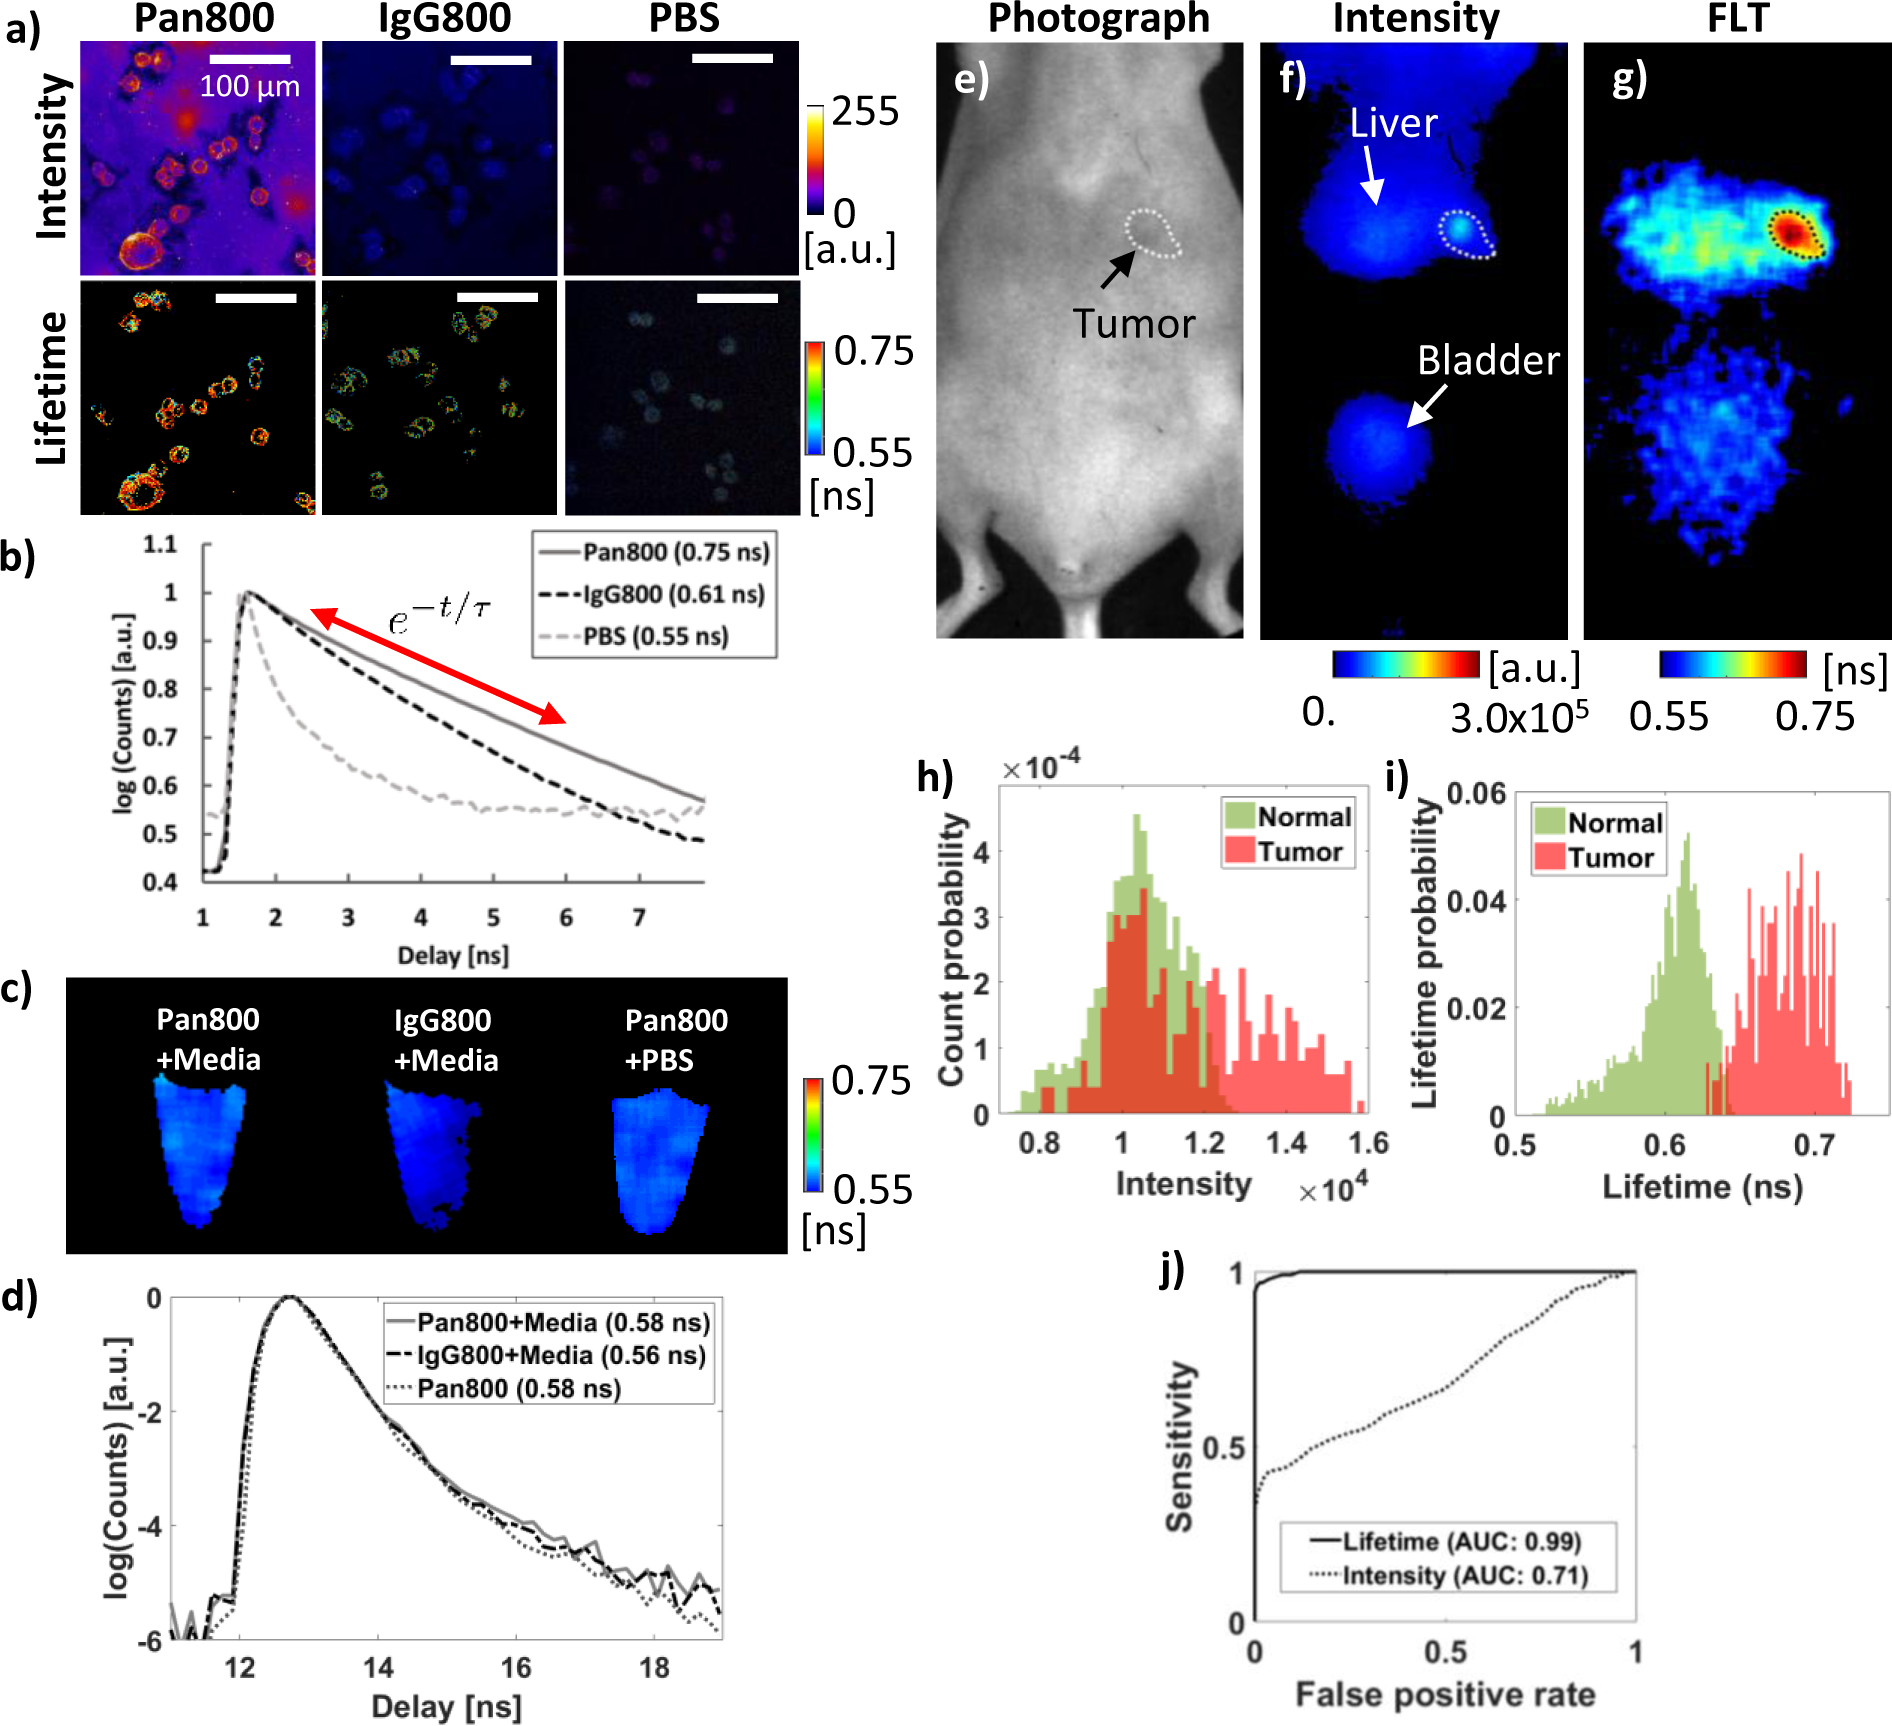
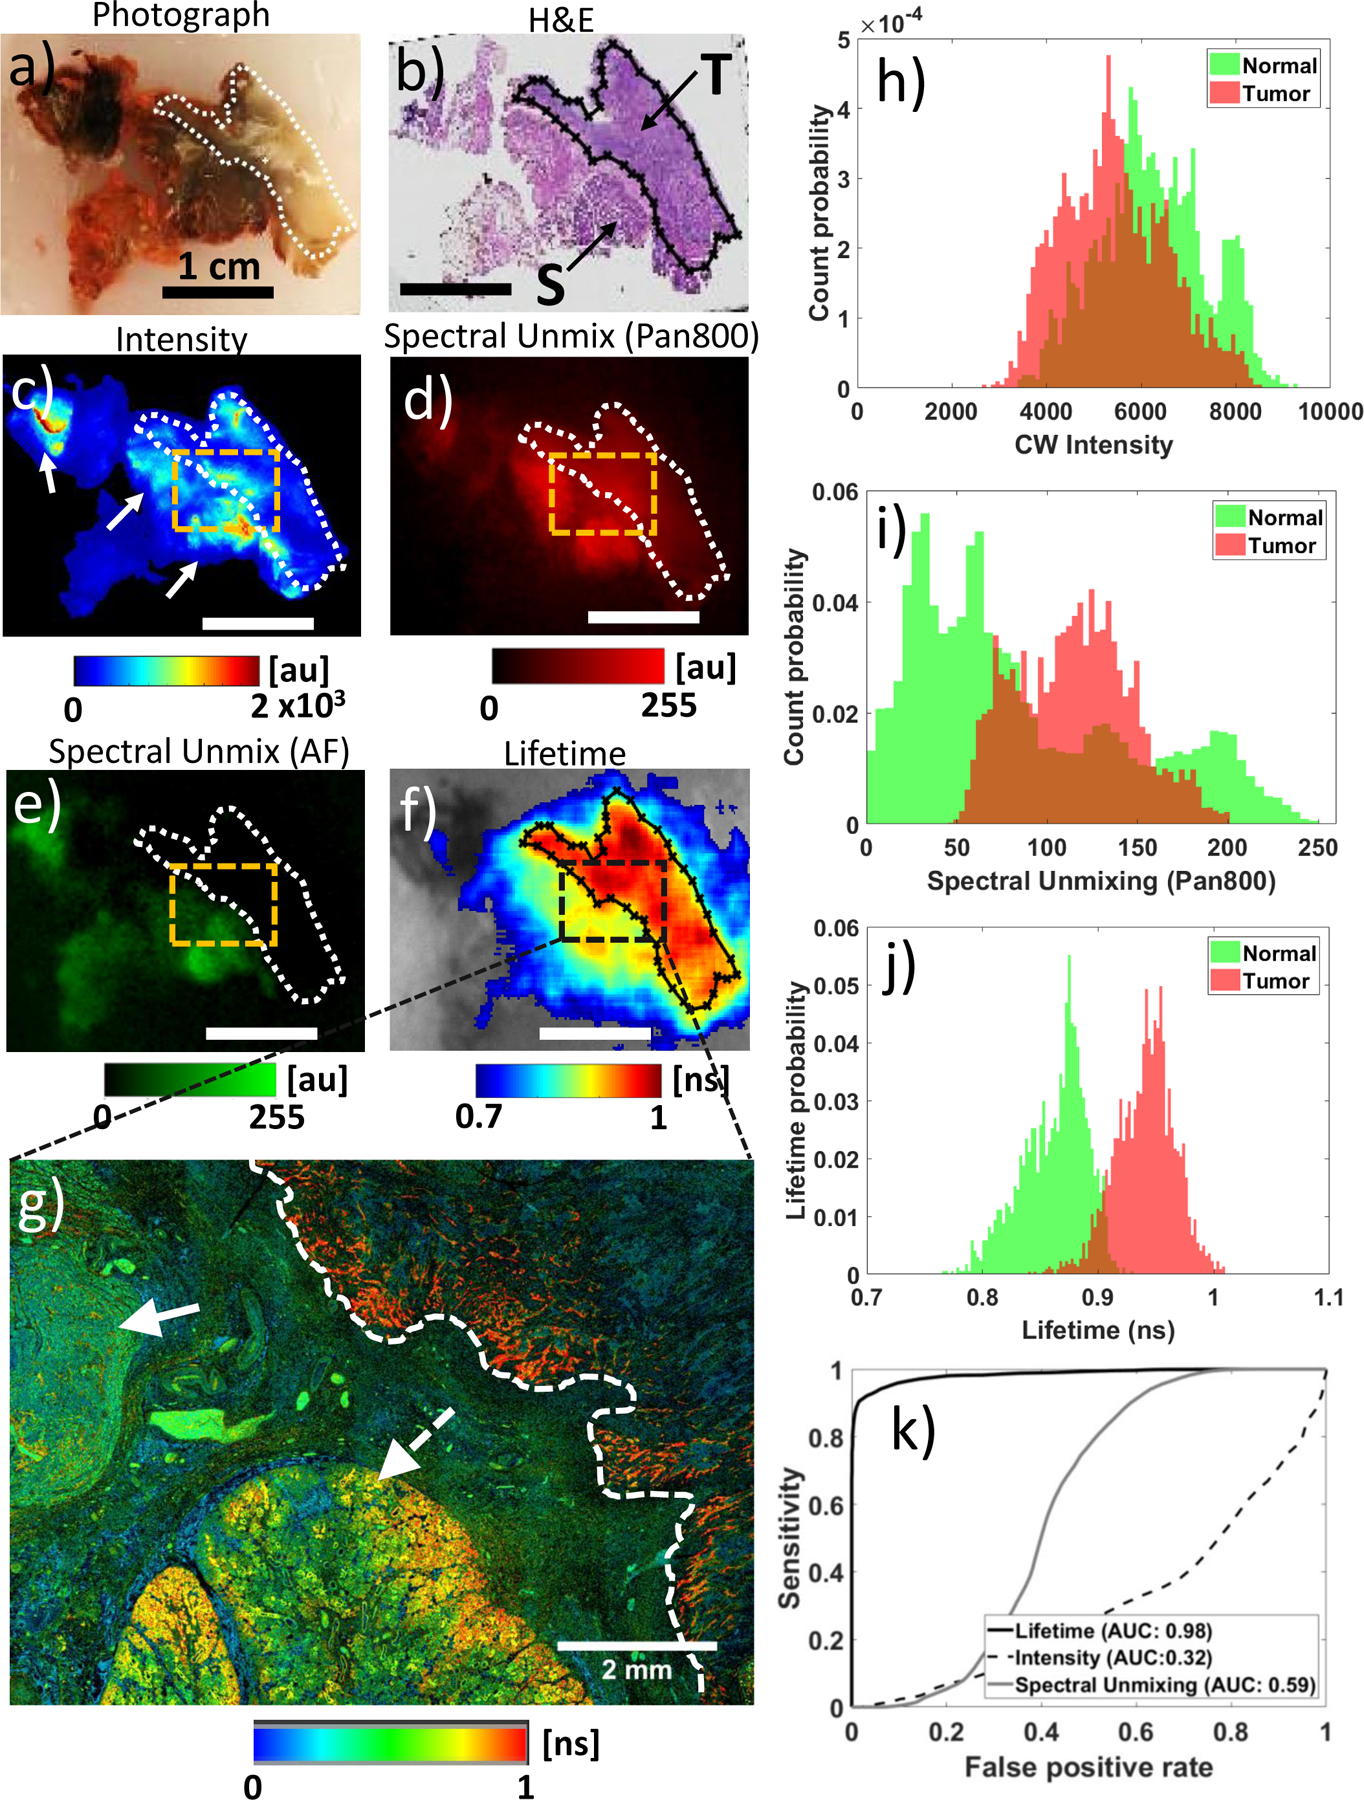
Purpose: Fluorescence molecular imaging, using cancer-targeted near infrared (NIR) fluorescent probes, offers the promise of accurate tumor delineation during surgeries and the detection of cancer specific molecular expression in vivo. However, nonspecific probe accumulation in normal tissue results in poor tumor fluorescence contrast, precluding widespread clinical adoption of novel imaging agents. Here we present the first clinical evidence that fluorescence lifetime (FLT) imaging can provide tumor specificity at the cellular level in patients systemically injected with panitumumab-IRDye800CW, an EGFR-targeted NIR fluorescent probe.

Experimental design: We performed wide-field and microscopic FLT imaging of resection specimens from patients injected with panitumumab-IRDye800CW under an FDA directed clinical trial.

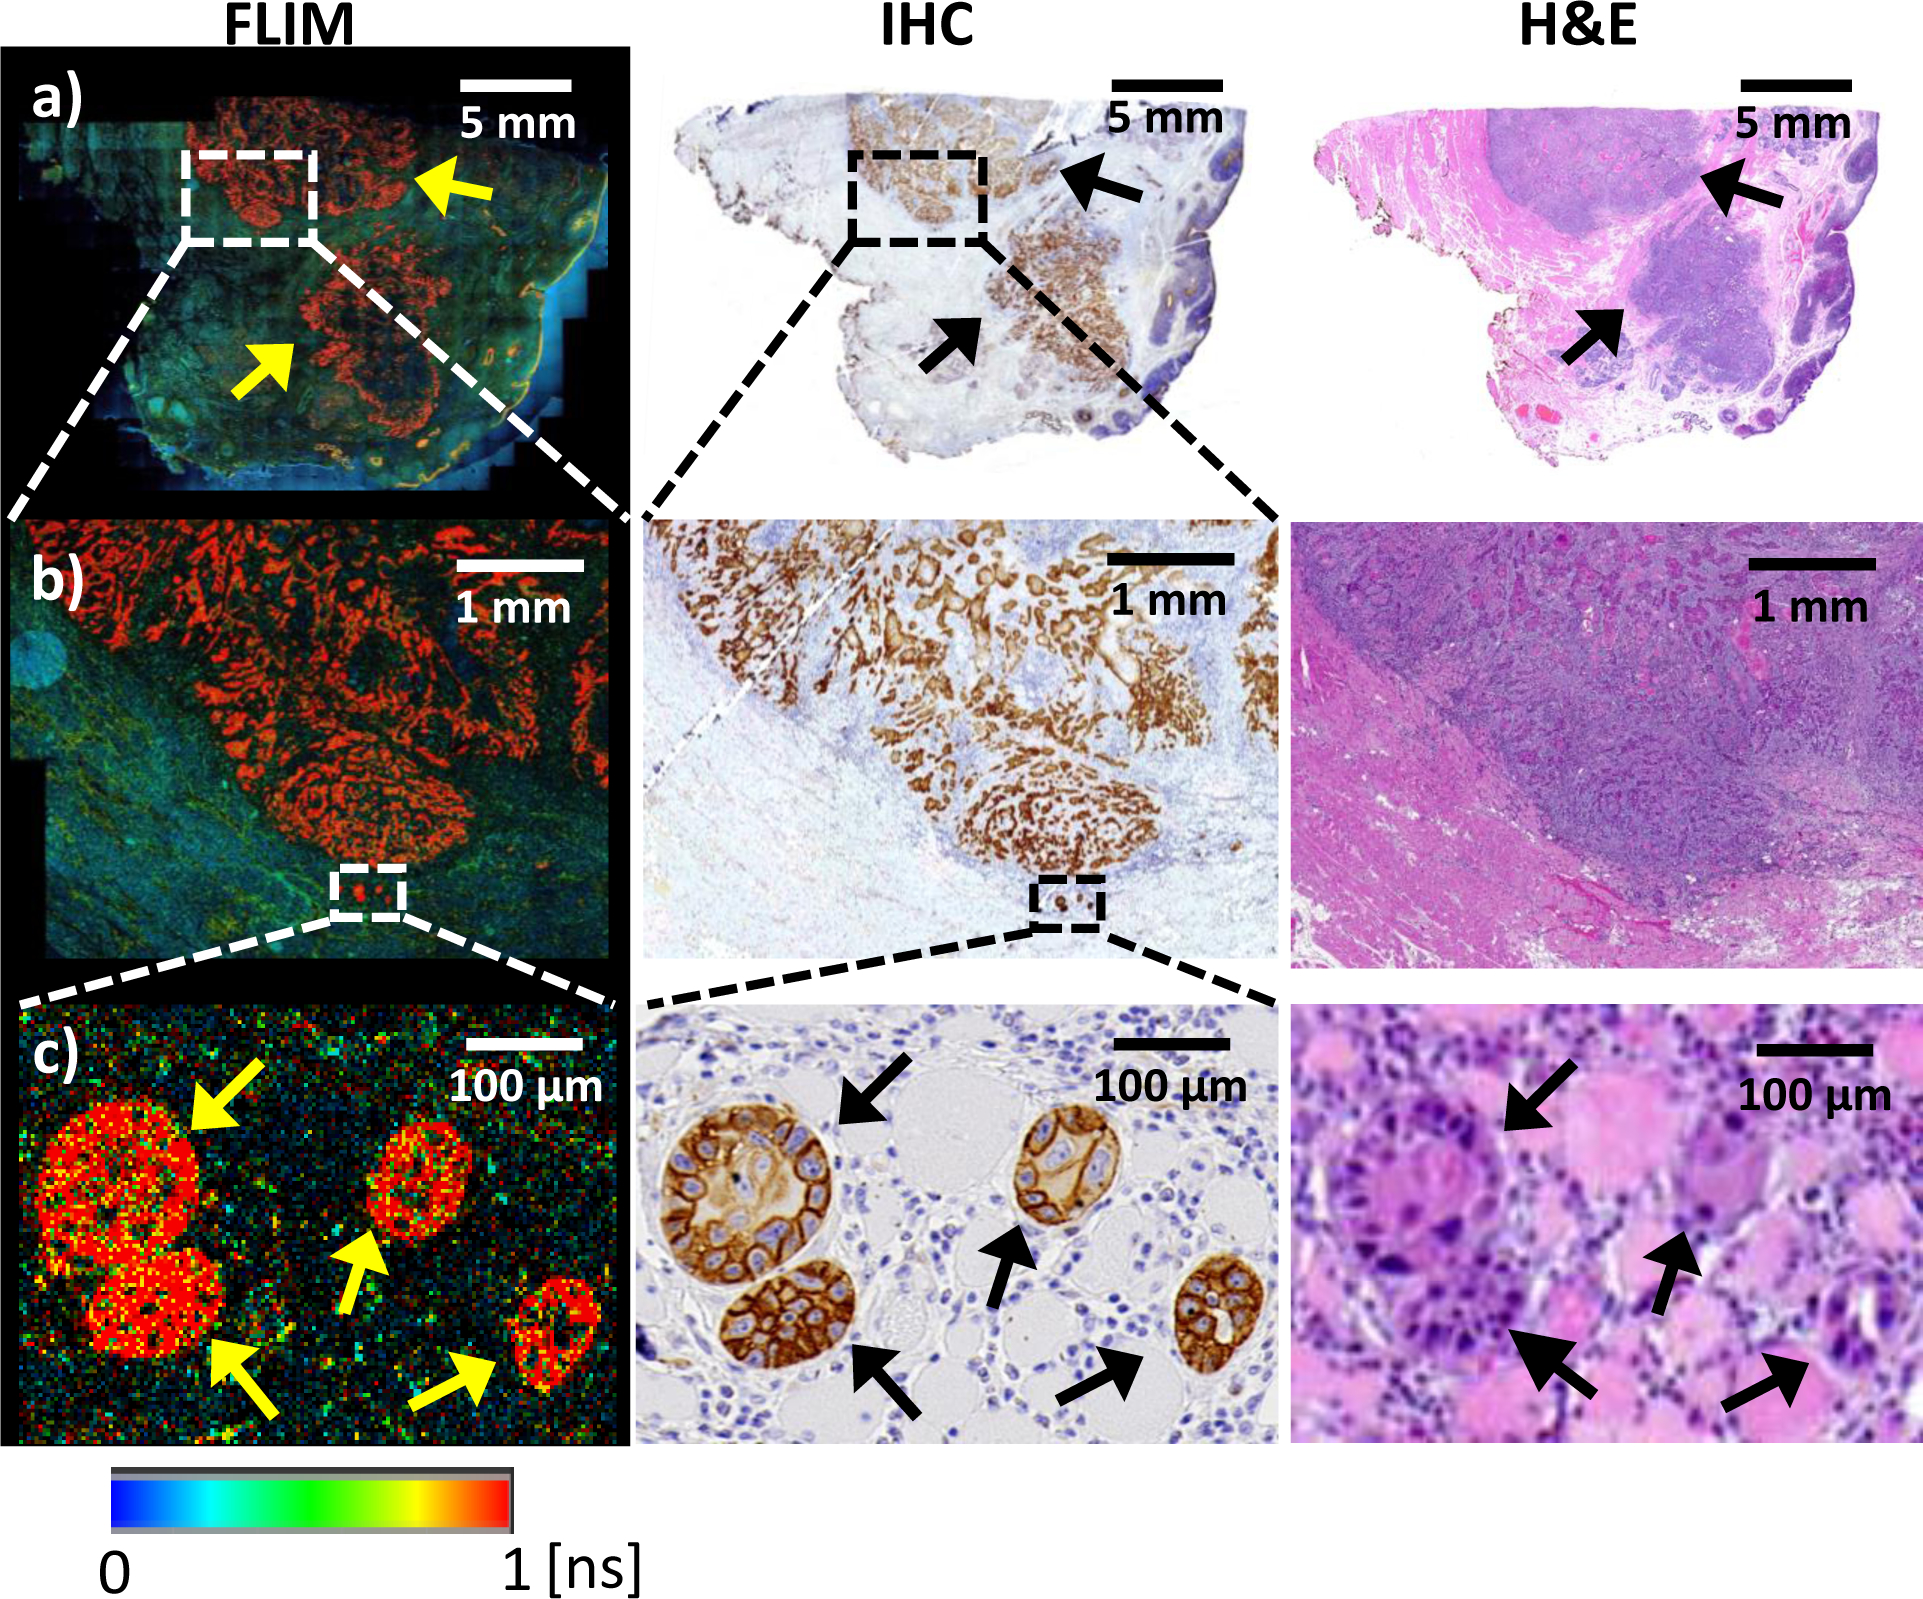
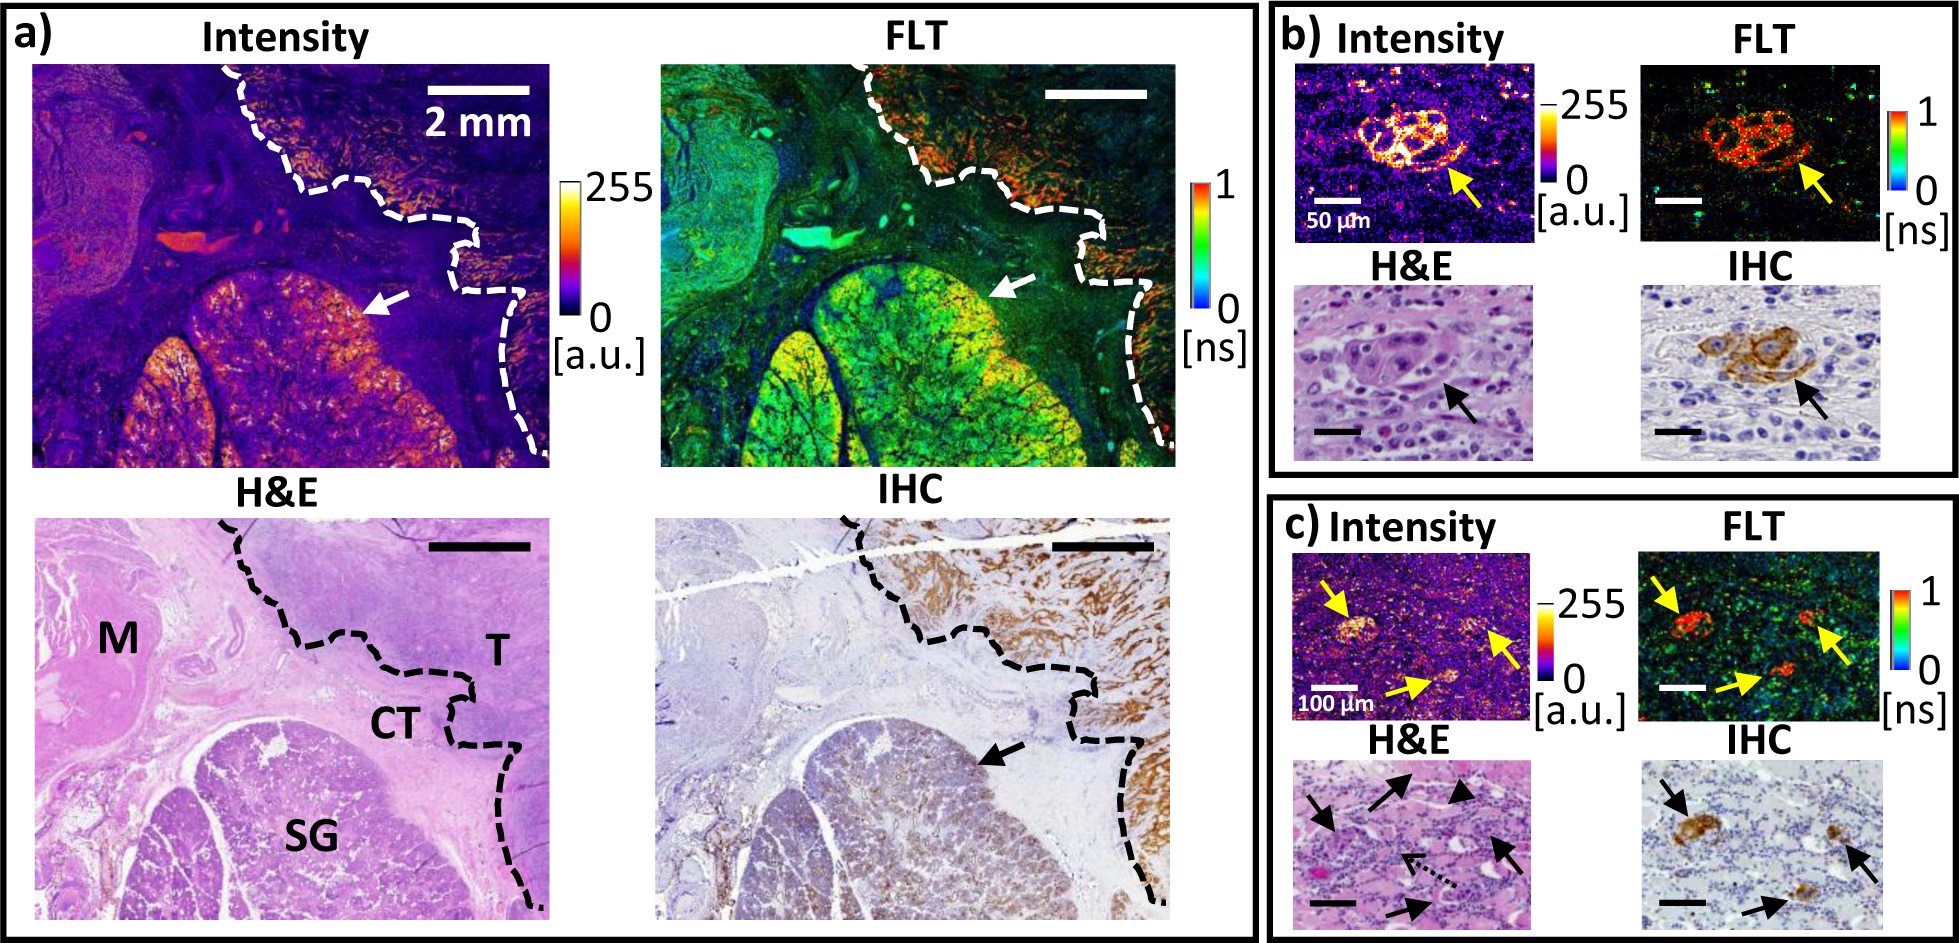
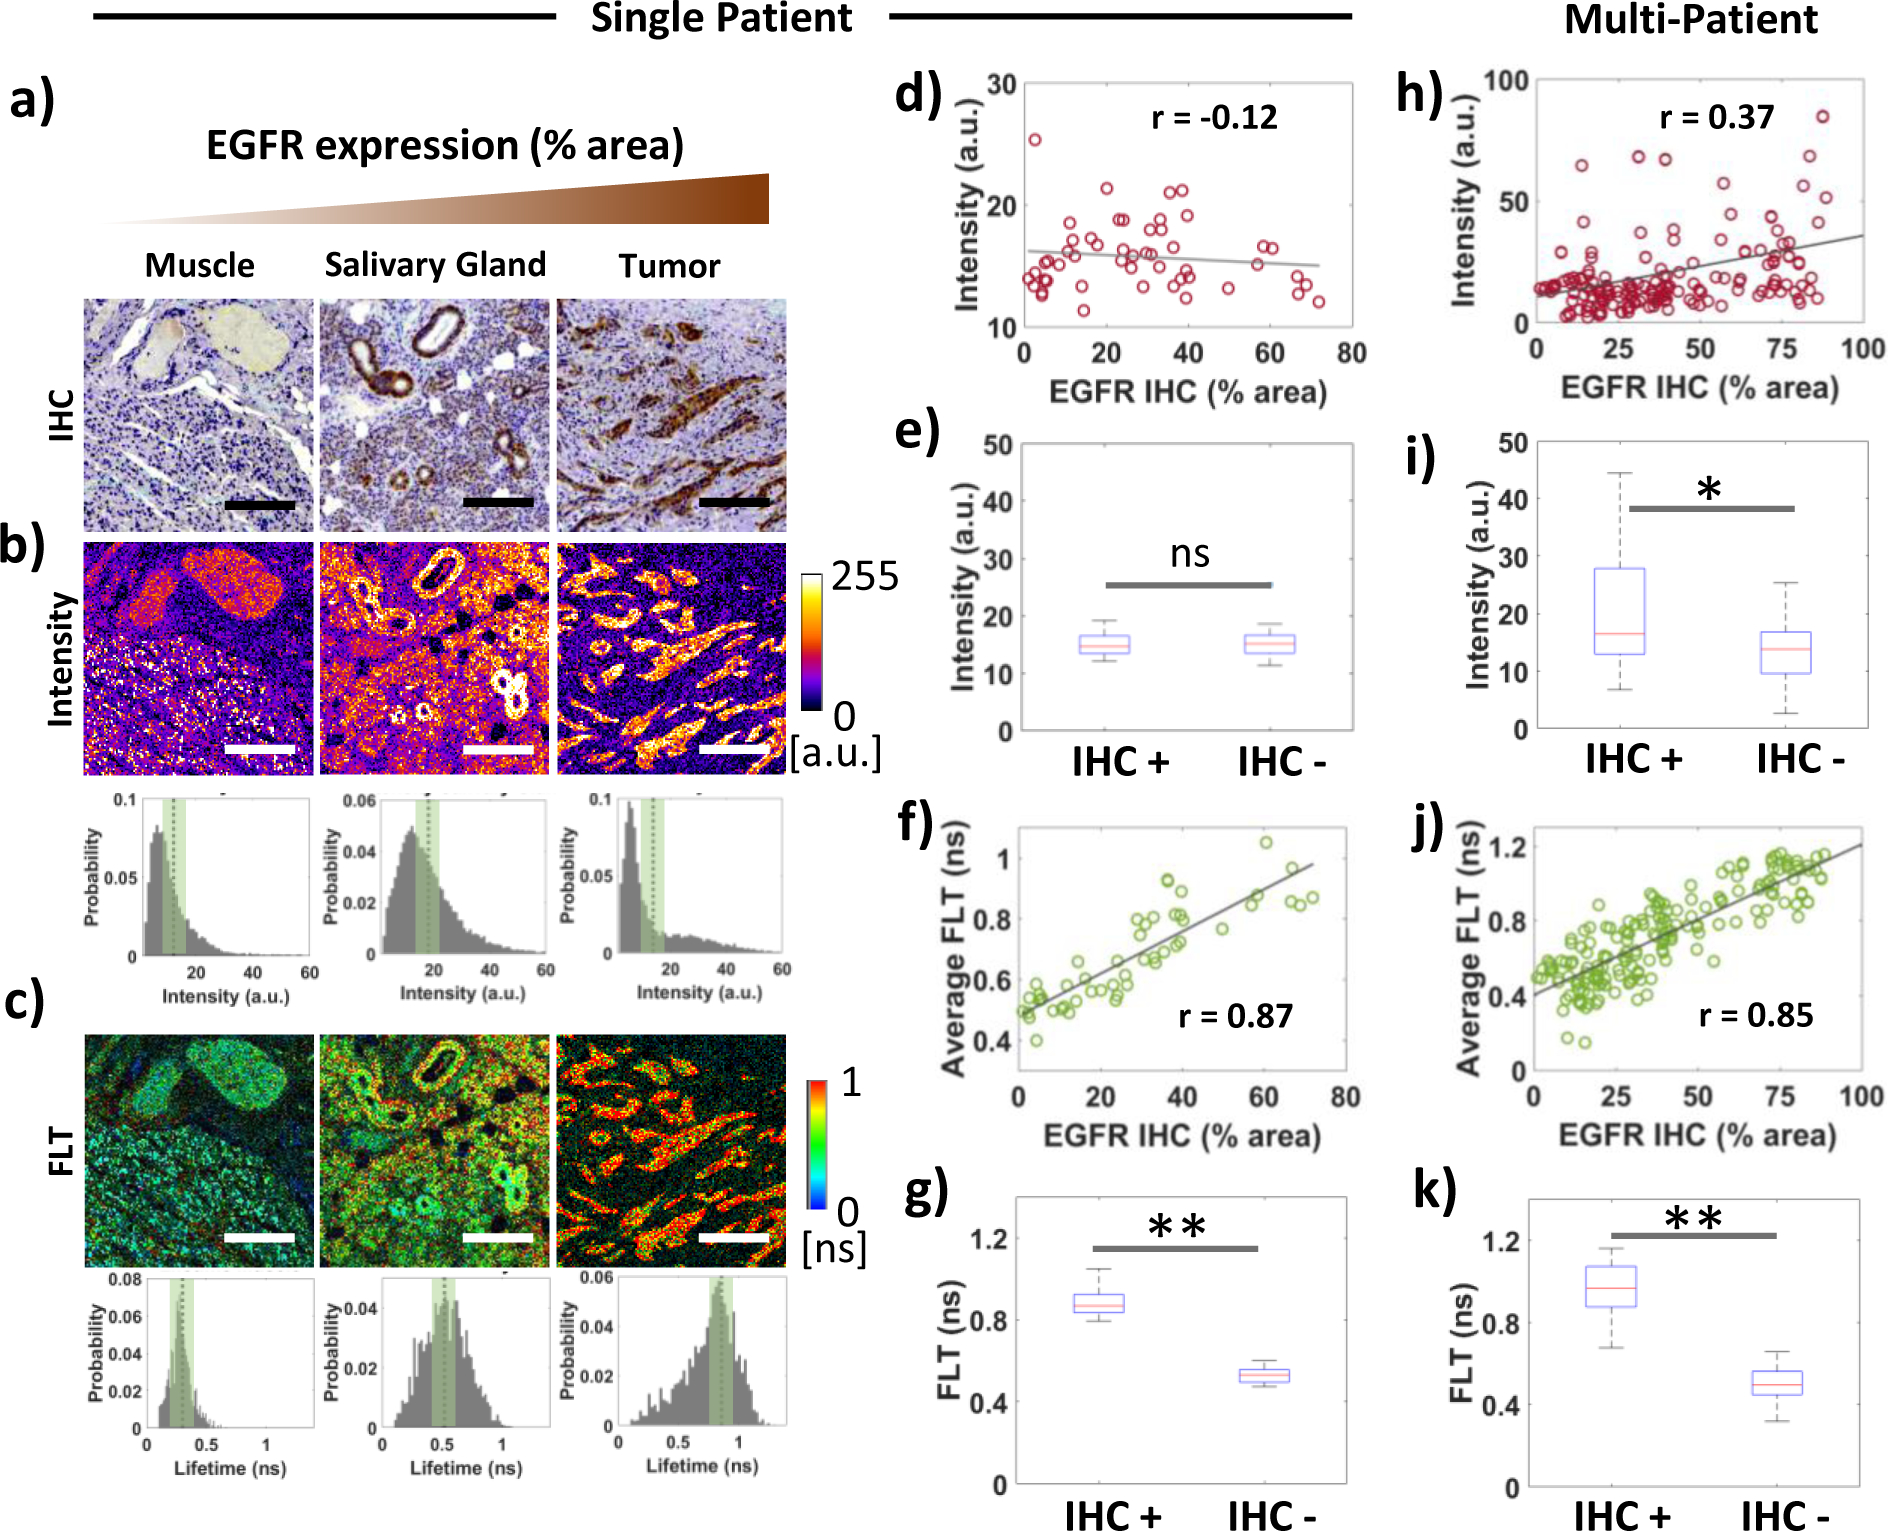
Results: We show that the FLT within EGFR-overexpressing cancer cells is significantly longer than the FLT of normal tissue, providing high sensitivity (>98%) and specificity (>98%) for tumor versus normal tissue classification, despite the presence of significant nonspecific probe accumulation. We further show microscopic evidence that the mean tissue FLT is spatially correlated (r > 0.85) with tumor-specific EGFR expression in tissue and is consistent across multiple patients. These tumor cell-specific FLT changes can be detected through thick biological tissue, allowing highly specific tumor detection and noninvasive monitoring of tumor EFGR expression in vivo.

Conclusions: Our data indicate that FLT imaging is a promising approach for enhancing tumor contrast using an antibody-targeted NIR probe with a proven safety profile in humans, suggesting a strong potential for clinical applications in image guided surgery, cancer diagnostics, and staging.


Conflict of interest statement

Conflict of interest statement: The authors declare no potential conflicts of interest

Figures

Figure 1:
Figure 1:. In vitro and in vivo studies of panitumumab-IRDye800CW FLT in oral cancer.
a) Confocal fluorescence intensity and lifetime microscopy images of FaDu oral cancer cell line after incubation with panitumumab-IRDye800CW (100 μg), IgG-IRDye800CW (100 μg) or PBS at 37° C for 2 hours, showing probe uptake and subsequent FLT enhancement of panitumumab-IRDye800CW treated cells only. b) Representative fluorescence decay curves of panitumumab-IRDye800CW (gray solid), IgG-IRDye800CW (black dashed) and PBS (gray dashed) in cancer cells are shown. FLTs are obtained as single exponential fits to the decay portion of the signal indicated by the red double arrow. c) Widefield FLT maps of culture media collected after incubation of imaging probes with cancer cells and panitumumab-IRDye800CW in PBS, showing comparable FLTs of panitumumab-IRDye800CW in culture media and in PBS. d) Representative fluorescence decay curves of panitumumab-IRDye800CW (gray solid) and IgG-IRDye800CW (black dashed) in culture media, and the stock solution of panitumumab-IRDye800CW in PBS (gray dotted). (e-f) In vivo imaging of FaDu xenograft animal tumor model (~5 mm tumor diameter, dotted outline), showing photograph (e), wide-field fluorescence intensity (f) and FLT (g) maps 48 h after i.v. administration of panitumumab-IRDye800CW. Fluorescence intensity of the tumor was comparable to the liver and the bladder, while the widefield FLT map delineated the tumor (black dotted outline) clearly with long FLT values observed only within the tumor. Histograms of fluorescence intensity (h) and FLTs (i) from ROIs of tumor (red) and normal (green) tissue are shown. (j) ROC curves of tumor vs. normal tissue discrimination based on fluorescence intensity (black dotted) and FLT (black solid) resulted in a significantly higher accuracy (AUC) of 0.99 with FLT compared to an accuracy of 0.71 for intensity-based classification.
Figure 2:
Figure 2:. Tumor specific FLT enhancement in a clinical OSCC specimen
from the lateral tongue, resected from a patient systemically injected with panitumumab-IRDye800CW 48 h prior to surgery. a) Confocal FLIM (left), EGFR IHC (center) and H&E (right) images are shown for a representative tissue section in large FOV (~3 cm). b) Expanded view of FLIM (left), EGFR IHC (center) and H&E (right) images within the dashed rectangular ROIs outlined in (a), showing enhanced FLT in tumor areas with high EGFR expression. (c) Higher magnification (20x) images of FLIM (left), EGFR IHC (center) and H&E (right) of the dashed rectangular ROIs outlined in (b), showing individual clusters with long FLT co-localized with EGFR expressing tumor cells. Non-tumor cells showed short FLT values indicating a tumor specific FLT enhancement of panitumumab-IRDye800CW.
Figure 3:
Figure 3:. Microscopic tumor specificity of FLT in the presence of high non-specific uptake of panitumumab-IRDye800CW.
Representative confocal fluorescence intensity and FLIM images along with corresponding H&E and EGFR IHC images from clinical specimens are shown with low magnification (a) and high magnification (b, c). The low magnification (10x) images represented in (a) show the fluorescence intensity and FLT of panitumumab-IRDye800CW in tumor (T), muscle (M), salivary gland (SG) and connective tissue (CT) that separates the tumor from the muscle and the salivary gland. The dashed lines in (a) indicate the histology defined tumor boundary. It should be noted that the long FLT (> 0.9 ns) is only observed within the high EGFR expressing tumor boundary. b) Representative high magnification (20x) images showing panitumumab-IRDye800CW uptake only in tumor cell clusters (arrow). c) Representative high magnification (20x) images of a region with high background fluorescence intensity. The FLT in the cancer cells (corresponding to high EGFR expression) showed a significantly longer FLT than the surrounding lymphocytes (dotted arrow) and muscle tissue (arrowhead).
Figure 4:
Figure 4:. Quantification of intra- and inter-patient mean fluorescence intensity and FLT with varying EGFR expression.
a) IHC images of ROIs within muscle, salivary gland, and tumor, shown in increasing order of EGFR expression (% area positive for EGFR IHC). b) Corresponding confocal fluorescence intensity images and histograms showing comparable mean fluorescence intensities for the three regions. c) Confocal FLIM images and FLT histograms of the same ROIs as in (a) show an increasing trend of FLTs with increasing EGFR expression. Black dotted lines in the histograms (b and c) represent the mean, and green shaded areas represent the standard deviations. (d-g) Correlation analysis of fluorescence intensity and FLT against EGFR expression within specimens from a single representative patient. (h-k) Correlation analysis of fluorescence intensity and FLT against EGFR expression in specimens from the entire study population (n = 10 patients). (d, h) Scatter plots of average fluorescence intensity vs the percent area positive for EGFR in IHC across all ROIs for single (d) and multiple (h) patients. The trend line (gray) shows the association between fluorescence intensity and EGFR expression. (e, i) Box plots indicating the distribution of fluorescence intensities in EGFR negative and positive pixels for single (e) and multiple (i) patients. (f, j) Scatter plots of average FLT vs percent area positive for EGFR in IHC across all ROIs for single (f) and multiple (j) patients. (g, k) Box plot of FLTs in EGFR negative and positive pixels of the same ROIs for single (g) and multiple (k) patients. The Pearson’s correlation coefficient (r) is shown in the inset in (d), (f), (h) and (j). Mann-Whitney U test (two-tailed) was used to estimate p values for the box plots. * p < 0.01, ** p < 0.001
Figure 5:
Figure 5:. Macroscopic widefield TD imaging and classification of tumor vs normal tissue in clinical specimen.
Representative widefield fluorescence intensity and FLT images of oral cavity cancer specimen are shown from patients systemically injected with panitumumab-IRDye800CW 48 hours prior to surgery. The widefield fluorescence imaging was performed in whole paraffin blocks before sectioning for histology. a) photograph, b) H&E image of a 10μm section, and c) widefield fluorescence intensity are shown. The tumor is indicated by dotted outlines in (a-c). Arrows in (b) indicate the locations of tumor (T) and salivary gland (S). Strong fluorescence intensity was observed in non-tumor areas as indicated by the arrows in (c). Multispectral imaging was performed to separate the contributions from panitumumab-IRDye800CW and tissue autofluorescence to the fluorescence intensity image presented in (c). Panitumumab-IRDye800CW amplitude (d) and tissue autofluorescence amplitude (e) are shown after spectral unmixing. (f) Widefield FLT image of the specimen showing the tumor boundary (dotted line) from the co-registered H&E image presented in (b). (g) FLIM of an ROI (dashed rectangle in (c-f)) confirms the accuracy of tumor-normal boundary (dashed line) at the microscopic level (reproduced from Fig. 3a). Solid arrow shows muscle and dashed arrow indicates salivary glands. (h-j) Distribution of fluorescence intensity (h), panitumumab-IRDye800CW amplitude measured from spectral unmixing (i), and FLTs (j) within histology defined tumor (red) and normal (green) tissue. (k) ROC curves for tumor vs. normal tissue classification using FLT (black solid), fluorescence intensity (black dashed), and spectral unmixing (gray solid) based on the H&E ground truth. The area under the curves (AUC) are shown in the inset.

Similar articles

Cited by

References

    1. Azari F, Kennedy G, Bernstein E, Hadjipanayis CG, Vahrmeijer AL, Smith BL, Rosenthal EL, Sumer BD, Tian J, and Henderson ER, Intraoperative molecular imaging clinical trials: a review of 2020 conference proceedings. Journal of biomedical optics, 2021. 26(5): p. 050901. - PMC - PubMed
    1. van Keulen S, van den Berg NS, Nishio N, Birkeland A, Zhou Q, Lu G, Wang H-W, Middendorf L, Forouzanfar T, Martin BA, Colevas AD, and Rosenthal E, Rapid, non-invasive fluorescence margin assessment: Optical specimen mapping in oral squamous cell carcinoma. Oral oncology, 2019. 88: p. 58–65. - PMC - PubMed
    1. Gao RW, Teraphongphom N, de Boer E, van den Berg NS, Divi V, Kaplan MJ, Oberhelman NJ, Hong SS, Capes E, Colevas AD, Warram JM, and Rosenthal EL, Safety of panitumumab-IRDye800CW and cetuximab-IRDye800CW for fluorescence-guided surgical navigation in head and neck cancers. Theranostics, 2018. 8(9): p. 2488. - PMC - PubMed
    1. Dsouza AV, Lin H, Henderson ER, Samkoe KS, and Pogue BW, Review of fluorescence guided surgery systems: identification of key performance capabilities beyond indocyanine green imaging. Journal of Biomedical Optics, 2016. 21(8): p. 080901–080901. - PMC - PubMed
    1. Lee JY, Cho SS, Stummer W, Tanyi JL, Vahrmeijer AL, Rosenthal EL, Smith B, Henderson ER, Roberts DW, and Lee A, Review of clinical trials in intraoperative molecular imaging during cancer surgery. Journal of biomedical optics, 2019. 24(12): p. 120901. - PMC - PubMed

Publication types