. 2022 Apr 11;39(4):msac056.
doi: 10.1093/molbev/msac056.

Global Population Genomics of Two Subspecies of Cryptosporidium hominis during 500 Years of Evolution

Affiliations

Global Population Genomics of Two Subspecies of Cryptosporidium hominis during 500 Years of Evolution

Swapnil Tichkule et al. Mol Biol Evol. .

Abstract

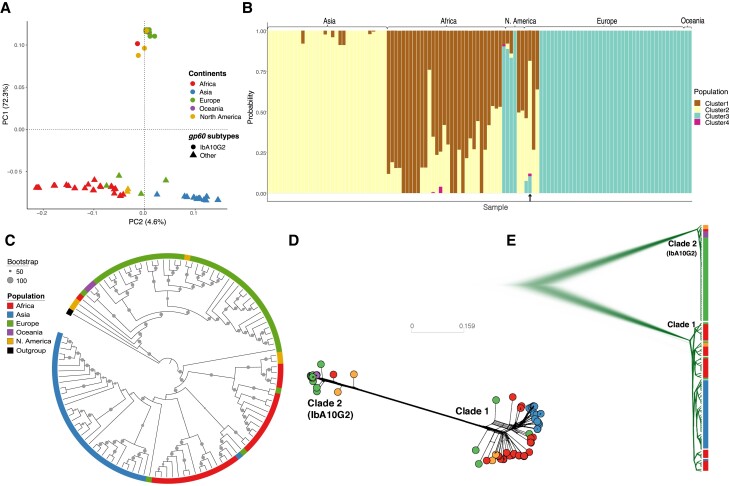
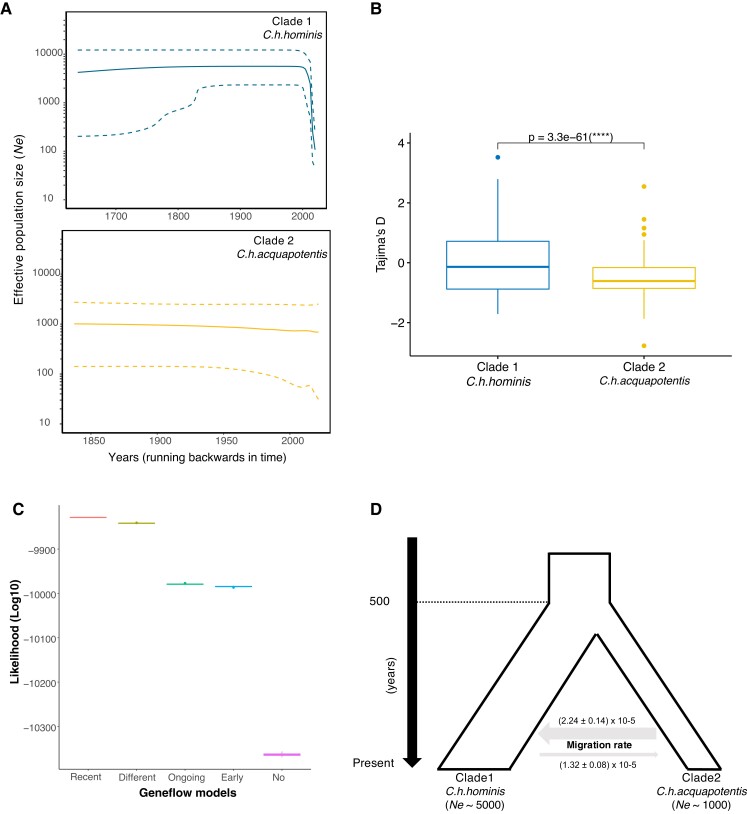
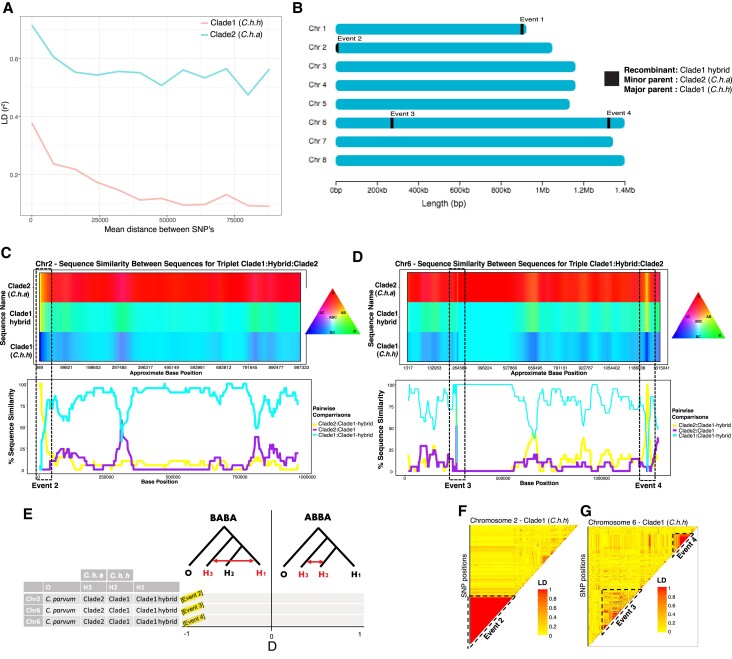
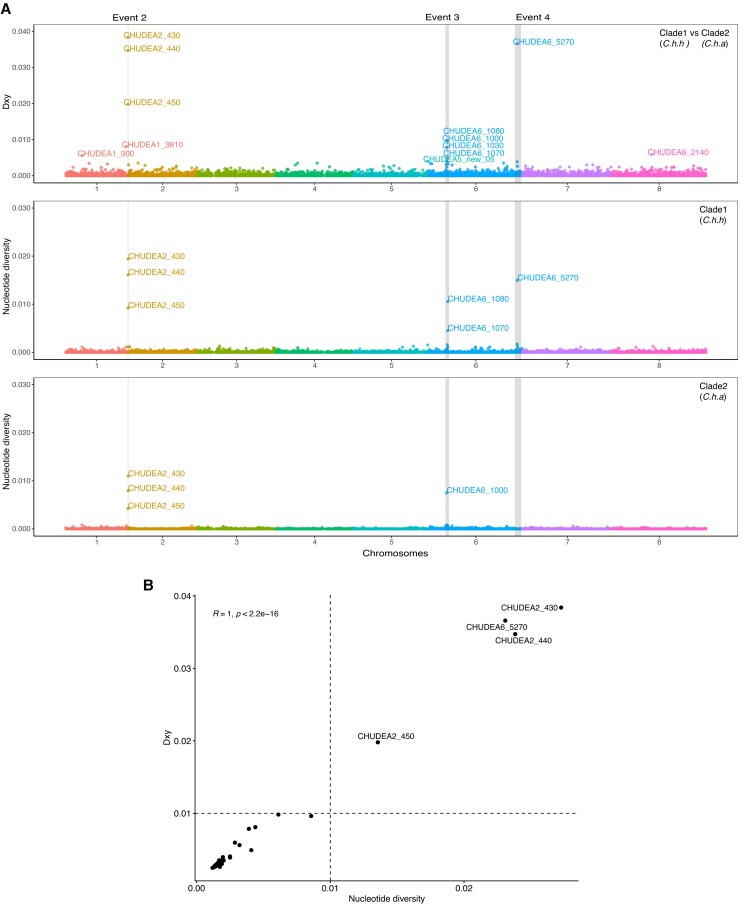
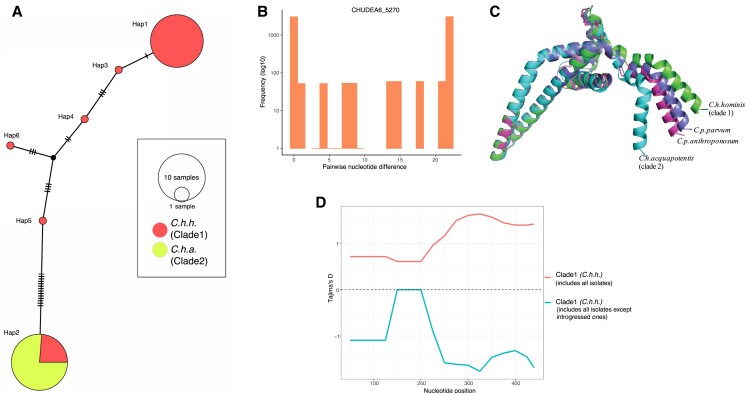
Cryptosporidiosis is a major global health problem and a primary cause of diarrhea, particularly in young children in low- and middle-income countries (LMICs). The zoonotic Cryptosporidium parvum and anthroponotic Cryptosporidium hominis cause most human infections. Here, we present a comprehensive whole-genome study of C. hominis, comprising 114 isolates from 16 countries within five continents. We detect two lineages with distinct biology and demography, which diverged circa 500 years ago. We consider these lineages two subspecies and propose the names C. hominis hominis and C. hominis aquapotentis (gp60 subtype IbA10G2). In our study, C. h. hominis is almost exclusively represented by isolates from LMICs in Africa and Asia and appears to have undergone recent population contraction. In contrast, C. h. aquapotentis was found in high-income countries, mainly in Europe, North America, and Oceania, and appears to be expanding. Notably, C. h. aquapotentis is associated with high rates of direct human-to-human transmission, which may explain its success in countries with well-developed environmental sanitation infrastructure. Intriguingly, we detected genomic regions of introgression following secondary contact between the subspecies. This resulted in high diversity and divergence in genomic islands of putative virulence genes, including muc5 (CHUDEA2_430) and a hypothetical protein (CHUDEA6_5270). This diversity is maintained by balancing selection, suggesting a co-evolutionary arms race with the host. Finally, we find that recent gene flow from C. h. aquapotentis to C. h. hominis, likely associated with increased human migration, maybe driving the evolution of more virulent C. hominis variants.

Keywords: Cryptosporidium hominis; comparative genomics; evolution; gene flow; population genetics; population structure; recombination; secondary contact; speciation; whole genome sequencing.


Figures

Fig. 1.
Fig. 1.
Global population structure of Cryptosporidium hominis isolates illustrating their substructing and diversification. (A) PCA of isolates based on the filtered set of whole-genome SNPs, highlighting three clusters of isolates which are predominately based on continents of origin. Isolates were color coded with their continent of origin. Isolates associated with gp60 subtype IbA10G2 were represented with solid circles while non-IbA10G2 with solid triangles. (B) Structure plot illustrating population genetic ancestry and the admixed nature of the C. hominis isolates. The plot was obtained for an optimum value of K = 4. The black arrow (bottom) indicates the highly admixed isolate (UK_UKH4), which includes all four ancestries. (C) Maximum likelihood-based phylogenetic tree. (D) Splitstree and (E) Densitree are also demonstrating two major clades. Cryptosporidium hominis hominis (clade 1) includes isolates associated with other gp60 subtypes, whereas Cryptosporidium hominis aquapotentis (clade 2) includes isolates associated with gp60 subtype IbA10G2.
Fig. 2.
Fig. 2.
Demographic histories and population size and secondary contact between Cryptosporidium hominis hominis (clade 1) and Cryptosporidium hominis aquapotentis (clade 2). (A) BSPs depicting change in Ne (effective population size) through time, for both the clades. The central dark line and the upper and lower dashed lines on Y-axis are mean estimates and 95% HPD intervals of Ne, respectively. X-axis is time in years, running backwards. (B) Boxplot showing significant difference (two-sided t-test) in Tajima’s D values between C. h. hominis (clade 1) and C. h. aquapotentis (clade 2). (C) Higher likelihood (log10) for “recent gene flow” model. Comparing likelihood distributions of gene flow models and observed significant difference (one-way ANOVA test, F = 2629761, df = 4, P value < 2 × 10−16). Further, post hoc Tukey–HSD test revealed difference in likelihood between all the models (P value < 1 × 10−16). (D) Graphical representation of demographic history of C. hominis, illustrating recent secondary contact and migration rates between the two clades (mean ± SE).
Fig. 3.
Fig. 3.
Analyses of recombination and gene flow between Cryptosporidium hominis hominis (clade 1) and Cryptosporidium hominis aquapotentis (clade 2). (A) LD decay plot showing rapid decay of linkage between SNPs in C. h. hominis (clade 1) compared with C. h. aquapotentis (clade 2). (B) Graphical representation of recombinant breakpoint positions detected by RDP4 program between C. h. hominis (clade 1) and C. h. aquapotentis (clade 2). (C,D) HybridCheck plots representing genomic signature of introgression in chromosomes 2 and 6, respectively. Analysis for chromosome 1 was excluded due to unknown parental sequences. The plots were generated for random set of triplets that includes recombinant (hybrid), minor (donor) and major (recipient) parental sequence, as detected by RDP4 program. Introgressed blocks (recombinant breakpoints) were illustrated with dashed boxes, showing high similarity between the recombinant (C. h. hominis hybrid isolates) and minor parent (C. h. aquapotentis isolates). The top panel illustrates the visualization of sequence similarity between sequences within the triplet, using RBG color triangle. The two sequences are colored same (yellow, purple, or turquoise) if they share polymorphism. (E) Gene flow analyses with ABBA–BABA test, representing D statistics for the random sets of triplets (as used in c,d) along with Cryptosporidium parvum as an outgroup. D statistic values close to −1 at all three recombinant events, suggesting gene flow between H1 and H3. (f,g) Pairwise LD of SNPs in chromosomes 2 and 6 of C. h. hominis showing red blocks of high linkage between SNPs in introgressed events 2–4.
Fig. 4.
Fig. 4.
Population genetic analyses of GIPVs. (A) Population genetic and divergence analyses of introgressed regions. X-axis represents genomic positions of eight chromosomes highlighted with different colors. Population divergence (Dxy) between Cryptosporidium hominis hominis (clade 1) and Cryptosporidium hominis aquapotentis (clade 2) for each gene were plotted on Y-axis (top panel). Nucleotide diversity (π) for C. h. hominis (middle panel) and C. h. aquapotentis (bottom panel) for each gene, was also plotted on Y-axis, respectively. The breakpoints of four recombination events (event 1–4) were indicated by gray vertical boxes. Event 1 was undetected in C. h. aquapotentis. (B) Correlation between π and Dxy were plotted to identify polymorphic and potential virulence genes.
Fig. 5.
Fig. 5.
Illustrating diversifying selection between Cryptosporidium hominis subspecies and host adaptation at CHUDEA6_5270 (hypothetical gene). (A) Haplotype network analyses illustrating haplotype diversification between Cryptosporidium hominis hominis (clade 1) and Cryptosporidium hominis aquapotentis (clade 2). (B) Pairwise nucleotide divergence shows bimodal distribution, which, theoretically, can be explained both by balancing selection (Lighten et al. 2017), as well as by genetic introgression. (C) Comparison of predicted models of protein structure of CHUDEA6_5270 gene between Cryptosporidium species and subtypes demonstrates variation towards C-terminal region. (D) Introgressed isolates driving balancing selection at gene CHUDEA6_5270 in C. h. hominis. Red line represents balancing selection (positive Tajima’s D) in C. h. hominis that also includes introgressed isolates. Blue line represents purifying selection (negative Tajima’s D) in C. h. hominis after excluding introgressed isolates.

References

    1. Abrahamsen MS, Templeton TJ, Enomoto S, Abrahante JE, Zhu G, Lancto CA, Deng M, Liu C, Widmer G, Tzipori S, et al. . 2004. Complete genome sequence of the apicomplexan, Cryptosporidium parvum. Science 304:441–445. - PubMed
    1. Assefa SA, Preston MD, Campino S, Ocholla H, Sutherland CJ, Clark TG. 2014. estMOI: estimating multiplicity of infection using parasite deep sequencing data. Bioinformatics 30:1292–1294. - PMC - PubMed
    1. Bolger AM, Lohse M, Usadel B. 2014. Trimmomatic: a flexible trimmer for Illumina sequence data. Bioinformatics 30:2114–2120. - PMC - PubMed
    1. Bouckaert RR, Heled J. 2014. DensiTree 2: seeing trees through the forest. bioRxiv 012401.
    1. Bouckaert R, Heled J, Kühnert D, Vaughan T, Wu C-H, Xie D, Suchard MA, Rambaut A, Drummond AJ. 2014. BEAST 2: a software platform for Bayesian evolutionary analysis. PLoS Comput Biol. 10:e1003537. - PMC - PubMed

Publication types