. 2022 Mar 22;119(12):e2115883119.
doi: 10.1073/pnas.2115883119. Epub 2022 Mar 18.

Diffusion and distal linkages govern interchromosomal dynamics during meiotic prophase

Affiliations

Diffusion and distal linkages govern interchromosomal dynamics during meiotic prophase

Trent A C Newman et al. Proc Natl Acad Sci U S A. .

Abstract

SignificanceEssential for sexual reproduction, meiosis is a specialized cell division required for the production of haploid gametes. Critical to this process are the pairing, recombination, and segregation of homologous chromosomes (homologs). While pairing and recombination are linked, it is not known how many linkages are sufficient to hold homologs in proximity. Here, we reveal that random diffusion and the placement of a small number of linkages are sufficient to establish the apparent "pairing" of homologs. We also show that colocalization between any two loci is more dynamic than anticipated. Our study provides observations of live interchromosomal dynamics during meiosis and illustrates the power of combining single-cell measurements with theoretical polymer modeling.

Keywords: homologous chromosome pairing; meiosis; polymer physics; tetO/TetR-GFP.


Conflict of interest statement

The authors declare no competing interest.

Figures

Fig. 1.
Fig. 1.
Overview of chromosome conformations in premeiotic cells (TM=T0) and in meiotic cells in midprophase (T3,T4) and late prophase (T5,T6). At T0, cells are in the G0 stage prior to DNA replication, and chromosomes are arranged in the Rabl configuration with centromeres clustered at the nuclear periphery (59). Following transfer to sporulation media, the meiotic program begins with cells entering S phase, over which time the centromeres are dispersed and telomeres start to cluster in the bouquet (–61, 74, 115). At early to midprophase, Spo11 initiates the formation of DSBs (116), shown as stars, of which the majority are repaired using the homologous chromosome as a substrate (9) (homologs are red and orange lines; note that each line in mid- and late prophase represents the pair of newly replicated sister chromatids). DSBs that go on to form class I or interfering COs, shown as the large stars, assemble the SIC (33, 41, 42), where the new SC is shown as blue lines. Concomitantly, telomeres are subject to motion driven by cytoskeletal motor proteins shown as gray arrows (7, 117). By late prophase, homologs are synapsed end to end and with CO intermediates maturing into CO products as shown.
Fig. 2.
Fig. 2.
(A) A typical field of cells, highlighting example cells showing either two spots (Left) or one spot (Right). (B and C) Maximum intensity projections of the relative positions of fluorescent foci at 30-s intervals. In B, the vertical axis corresponds to a z stack (with step size 0.25μm). For each x and y coordinate, the maximum value over all time points for that z stack is shown. In C, the vertical axis represents time (t; in seconds), and the projection is instead performed over z stacks. The positions of the loci and the distance between them are highlighted for select time points. (DF) Kymographs showing the distance between the loci in a single cell over the 25-min imaging period. Each horizontal slice in the kymograph shows the fluorescence intensity along the line joining the centers of the two loci in a single frame. Example of cells where the loci are separated (D) or colocalize (F) for every frame. The mixed cell shown in E undergoes several transitions between the two states. (G) Fraction of cells in the mixed state vs. hours in SPM through meiosis for the URA3 and LYS2 loci in wild-type (WT) and spo11Δ cells. The plot was made from aggregating all available data for each meiotic stage. The error is the SEM with the sample count set to the number of trajectories. (H) Schematic representation of the genomic positions of the URA3 and LYS2 loci on chromosomes V and II, respectively.
Fig. 3.
Fig. 3.
The fraction of time at each stage of meiosis (TM=T0,T1,) that foci are in a colocalized state for each of the two loci and strains examined. The plot was made from aggregating all available data for each meiotic stage. The error is the SEM with the sample count set to the number of trajectories. WT, wild type.
Fig. 4.
Fig. 4.
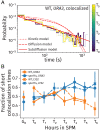
Histograms of dwell times in the colocalized states for the URA3 locus (A) colored by the time since transfer to sporulation media. Along with the experimental data, we show theoretical fits for kinetic (dotted curve), diffusion (dashed curve), and subdiffusion (solid curve with power-law exponent B = 0.24) models. The fraction of short colocalization times (B) gives the probability of colocalization time being less than 30 s vs. time in sporulation media, including data for wild-type (WT) and spo11Δ strains for the URA3 and LYS2 loci.
Fig. 5.
Fig. 5.
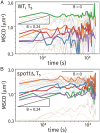
Single-cell MSCDs for URA3 trajectories at T5. These plots show results from 25 randomly selected cells (light) along with 5 randomly selected cells (bold) for wild-type (WT) cells (A) and spo11Δ cells (B). Each plot includes two power-law scaling behaviors associated with confined motion (slope B = 0) and unconfined subdiffusive polymer motion (slope B = 0.24).
Fig. 6.
Fig. 6.
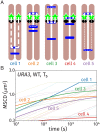
Theoretical curves for the MSCD based on our random link model for homolog pairing coincident with URA3 trajectories at T5. Five individual cell linkage diagrams (A), where the blue sticks identify random linkages along the homologous chromosomes, result in the five bold MSCD curves in the plot in B. The MSCD plot shows 25 additional realizations (light) to demonstrate the heterogeneity in the MSCD behavior. WT, wild type.
Fig. 7.
Fig. 7.
Time- and ensemble-averaged MSCDs at different times after induction of sporulation for a wild-type (WT) strain tagged at the URA3 locus (A), spo11Δ strain tagged at the URA3 locus (B), WT strain tagged at the LYS2 locus (C), and spo11Δ strain tagged at the LYS2 locus (D). Theoretical curves from our model are included for the fitted subdiffusion coefficients.

Similar articles

Cited by

References

    1. Scherthan H., et al. ., Chromosome mobility during meiotic prophase in Saccharomyces cerevisiae. Proc. Natl. Acad. Sci. U.S.A. 104, 16934–16939 (2007). - PMC - PubMed
    1. Wanat J. J., et al. ., Csm4, in collaboration with Ndj1, mediates telomere-led chromosome dynamics and recombination during yeast meiosis. PLoS Genet. 4, e1000188 (2008). - PMC - PubMed
    1. Kosaka H., Shinohara M., Shinohara A., Csm4-dependent telomere movement on nuclear envelope promotes meiotic recombination. PLoS Genet. 4, e1000196 (2008). - PMC - PubMed
    1. Sonntag Brown M., Zanders S., Alani E., Sustained and rapid chromosome movements are critical for chromosome pairing and meiotic progression in budding yeast. Genetics 188, 21–32 (2011). - PMC - PubMed
    1. Zickler D., Kleckner N., Recombination, pairing, and synapsis of homologs during meiosis. Cold Spring Harb. Perspect. Biol. 7, a016626 (2015). - PMC - PubMed

LinkOut - more resources