. 2022 Mar 22;119(12):e2120821119.
doi: 10.1073/pnas.2120821119. Epub 2022 Mar 18.

Population genetics in microchannels

Affiliations

Population genetics in microchannels

Anzhelika Koldaeva et al. Proc Natl Acad Sci U S A. .

Abstract

SignificanceMany microbial populations proliferate in small channels. In such environments, reproducing cells organize in parallel lanes. Reproducing cells shift these lanes, potentially expelling other cells from the channel. In this paper, we combine theory and experiments to understand how these dynamics affects the diversity of a microbial population. We theoretically predict that genetic diversity is quickly lost along lanes of cells. Our experiments confirm that a population of proliferating Escherichia coli in a microchannel organizes into lanes of genetically identical cells within a few generations. Our findings elucidate the effect of lane formation on populations evolution, with potential applications ranging from microbial ecology in soil to dynamics of epithelial tissues in higher organisms.

Keywords: bacterial evolution; individual-based models; microfluidics; spatial population dynamics.


Conflict of interest statement

The authors declare no competing interest.

Figures

Fig. 1.
Fig. 1.
Competition between two E. coli strains (in red and green) in microchannels with two open ends. Two experimental realizations in microchannels of different widths are shown. (A) Competing strains form two stripes in a channel of width 2.5 µm harboring three lanes of cells. (B) Strains segregate into four stripes in a channel of width 3 µm harboring four lanes of cells. The observed number of stripes fluctuates among different experimental runs (SI Appendix, Fig. S1A).
Fig. 2.
Fig. 2.
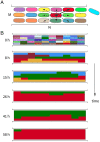
The population model describes cells proliferating in a microchannel. (A) Scheme of the model. The population is made up of M X N individuals. Different colors represent different clonal populations. A randomly chosen cell reproduces to the right (arrow) and shifts all the cells to its right toward the right end of the microchannel. As a result, the cell next to the right end is expelled from the microchannel. Dashed arrows show the other seven possible directions for reproduction. Cells located at the boundaries can reproduce in five possible directions. (B) Dynamics of the model. The dynamics progresses until one clonal population takes over the entire population. SI Appendix, Fig. S1 shows a more extensive comparison between the patterns observed in experiments and in simulations. Parameters are M = 5, N = 10, b = 0.01 min–1, m = 0.6, and α=3.2.
Fig. 3.
Fig. 3.
Two temporal regimes of diversity loss. In all plots, circles with error bars represent the experimental data, triangles represent numerical simulations, and solid curves represent analytical solutions. Model parameters are listed in Table 1. (A) The first regime of diversity loss. Theory, simulations, and experiments show that diversity decreases exponentially in time. Time is measured in generations. The solid curves represent the analytical solutions given by Eq. 4. A, Inset shows a linear data collapse of the experimental data based on Eq. 4. (B) The second regime of diversity loss. The probability of observing a given number of clonal population as a function of time is measured in generations from the start of the second regime. The experimental data are obtained by retracking our experimental data (Materials and Methods). Details on the data analysis and analytical solutions are in SI Appendix.
Fig. 4.
Fig. 4.
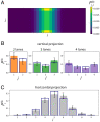
Fixation probabilities are highest at the center of a microchannel. (A) Fixation probabilities predicted by Eq. 7 for M = 10, N = 30, m = 0.6, and α=3.2. (B) Fixation probabilities along the vertical (j) axis. Color histograms represent empirical probabilities from experiments with associated uncertainties. Dark blue bars represent marginalized fixation probabilities Pjfix=iPi,jfix, where Pi,jfix is given in Eq. 7. The number of cells per lane is N = 9 for all three cases. In the experiments where populations do not reach fixation, we use all remaining clonal populations at the end of the experiment (typically, from two to six) to approximate the empirical fixation probabilities. The validity of this approximation is supported by numerical simulations (SI Appendix). (C) Projections of the fixation probabilities along the horizontal (i) axis. The gray histogram represents the empirical fixation probabilities. Dark blue bars represent Pifix=jPi,jfix.
Fig. 5.
Fig. 5.
Estimation of the model parameters from experimental observations. (A) Empirical distributions of division times. (B) Growth rates evaluated from the experimental data. The error bars represent the mean values and the SEs of the population growth rates obtained as ln((2))/τ, where τ is the cell division time averaged over the population in a single experimental run. The stars mark the reproduction rates b evaluated by solving the Euler–Lotka equation 2exp(bτ)=1 (SI Appendix). (C) Scheme of the two possible directions of division. We interpret an asymmetry between frequencies of reproductions in these two directions as a mass effect. (D) Mass effect in the experimental data. The scattered points represent the average frequencies of leftward divisions as a function of the cell position in the experimental data. We fit the data with the linear function given in Eq. 8 using the least squares method, resulting in m = 0.6 for all channel widths. (E) Division within the same lane and to a neighbor lane. The alignment parameter α is defined as the ratio between the probability of a cell division within a lane and that of a cell division involving a change of lane. (F) Average value and the SE of α estimated from the experimental data. We find that α does not significantly vary across experiments and lanes. The average value over all experiments is α=3.2. The averages are calculated over 17 microchannels with two lanes, 21 microchannels with three lanes, and 20 microchannels with four lanes.
Fig. 6.
Fig. 6.
Dynamics of interfaces. Different colors correspond to different clonal populations. Interfaces σ1,σ2σN1 are associated with adjacent cells. An interface σi is equal to one if the two associated cells belong to different clonal populations and zero otherwise. As a consequence of cell division, an interface of value zero is created at i = 6, and a portion of the vector of interface is shifted (in red). As an outcome, one interface is expelled.

References

    1. You Z., Pearce D. J., Sengupta A., Giomi L., Geometry and mechanics of microdomains in growing bacterial colonies. Phys. Rev. X 8, 031065 (2018).
    1. Dell’Arciprete D., et al. ., A growing bacterial colony in two dimensions as an active nematic. Nat. Commun. 9, 1–9 (2018). - PMC - PubMed
    1. Cho H., et al. ., Self-organization in high-density bacterial colonies: Efficient crowd control. PLoS Biol. 5, e302 (2007). - PMC - PubMed
    1. Karamched B. R., et al. ., Moran model of spatial alignment in microbial colonies. Physica D 395, 1–6 (2019). - PMC - PubMed
    1. Sheats J., Sclavi B., Cosentino Lagomarsino M., Cicuta P., Dorfman K. D., Role of growth rate on the orientational alignment of Escherichia coli in a slit. R. Soc. Open Sci. 4, 170463 (2017). - PMC - PubMed

LinkOut - more resources