

In vitro machine learning-based CAR T immunological synapse quality measurements correlate with patient clinical outcomes
- PMID: 35303007
- PMCID: PMC8955962
- DOI: 10.1371/journal.pcbi.1009883
In vitro machine learning-based CAR T immunological synapse quality measurements correlate with patient clinical outcomes
Abstract
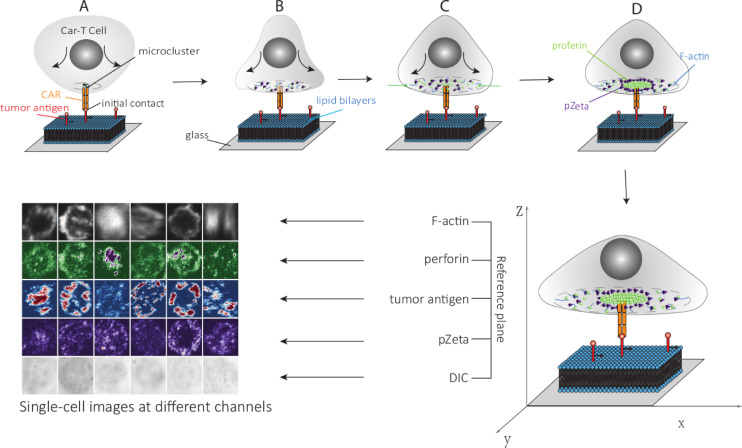
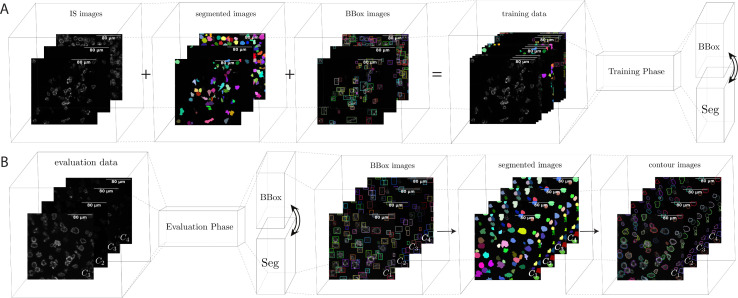
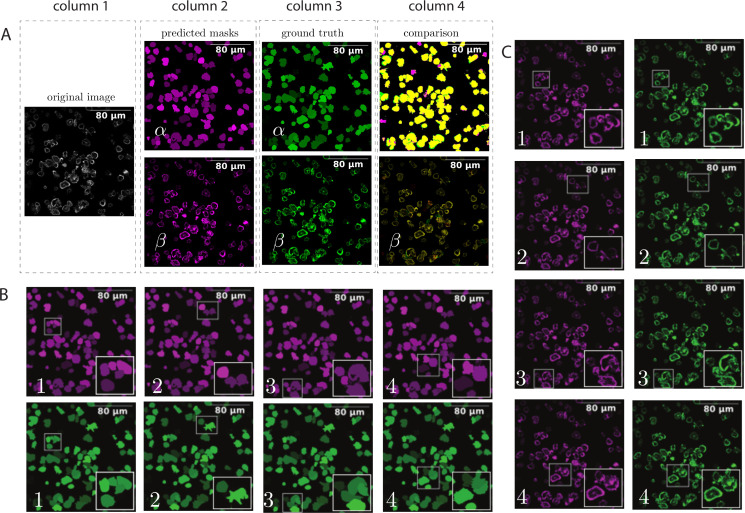
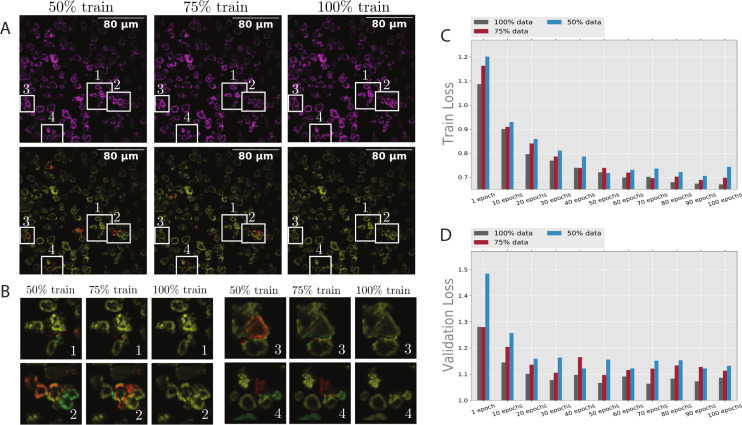
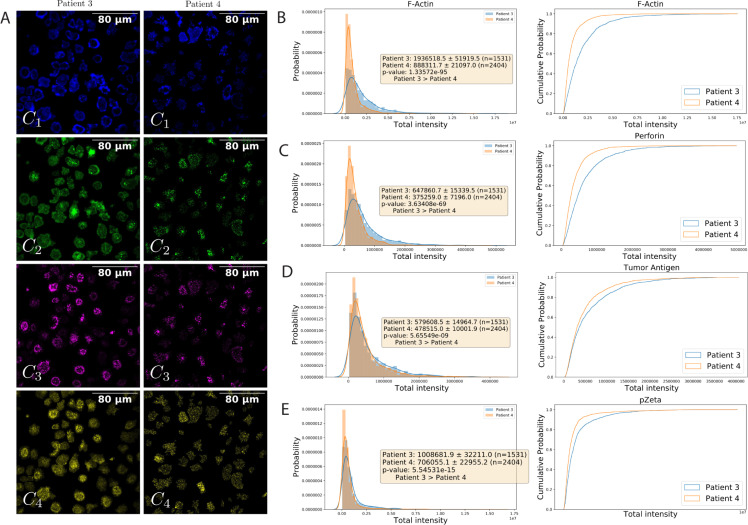
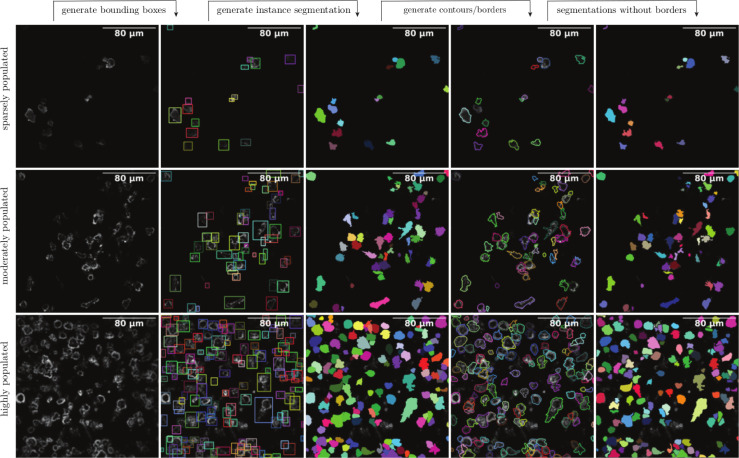
The human immune system consists of a highly intelligent network of billions of independent, self-organized cells that interact with each other. Machine learning (ML) is an artificial intelligence (AI) tool that automatically processes huge amounts of image data. Immunotherapies have revolutionized the treatment of blood cancer. Specifically, one such therapy involves engineering immune cells to express chimeric antigen receptors (CAR), which combine tumor antigen specificity with immune cell activation in a single receptor. To improve their efficacy and expand their applicability to solid tumors, scientists optimize different CARs with different modifications. However, predicting and ranking the efficacy of different "off-the-shelf" immune products (e.g., CAR or Bispecific T-cell Engager [BiTE]) and selection of clinical responders are challenging in clinical practice. Meanwhile, identifying the optimal CAR construct for a researcher to further develop a potential clinical application is limited by the current, time-consuming, costly, and labor-intensive conventional tools used to evaluate efficacy. Particularly, more than 30 years of immunological synapse (IS) research data demonstrate that T cell efficacy is not only controlled by the specificity and avidity of the tumor antigen and T cell interaction, but also it depends on a collective process, involving multiple adhesion and regulatory molecules, as well as tumor microenvironment, spatially and temporally organized at the IS formed by cytotoxic T lymphocytes (CTL) and natural killer (NK) cells. The optimal function of cytotoxic lymphocytes (including CTL and NK) depends on IS quality. Recognizing the inadequacy of conventional tools and the importance of IS in immune cell functions, we investigate a new strategy for assessing CAR-T efficacy by quantifying CAR IS quality using the glass-support planar lipid bilayer system combined with ML-based data analysis. Previous studies in our group show that CAR-T IS quality correlates with antitumor activities in vitro and in vivo. However, current manually quantified IS quality data analysis is time-consuming and labor-intensive with low accuracy, reproducibility, and repeatability. In this study, we develop a novel ML-based method to quantify thousands of CAR cell IS images with enhanced accuracy and speed. Specifically, we used artificial neural networks (ANN) to incorporate object detection into segmentation. The proposed ANN model extracts the most useful information to differentiate different IS datasets. The network output is flexible and produces bounding boxes, instance segmentation, contour outlines (borders), intensities of the borders, and segmentations without borders. Based on requirements, one or a combination of this information is used in statistical analysis. The ML-based automated algorithm quantified CAR-T IS data correlates with the clinical responder and non-responder treated with Kappa-CAR-T cells directly from patients. The results suggest that CAR cell IS quality can be used as a potential composite biomarker and correlates with antitumor activities in patients, which is sufficiently discriminative to further test the CAR IS quality as a clinical biomarker to predict response to CAR immunotherapy in cancer. For translational research, the method developed here can also provide guidelines for designing and optimizing numerous CAR constructs for potential clinical development. Trial Registration: ClinicalTrials.gov NCT00881920.
Conflict of interest statement
The authors have declared that no competing interests exist.
Figures

Similar articles
-
Short-Term Memory Impairment.2024 Jun 8. In: StatPearls [Internet]. Treasure Island (FL): StatPearls Publishing; 2025 Jan–. 2024 Jun 8. In: StatPearls [Internet]. Treasure Island (FL): StatPearls Publishing; 2025 Jan–. PMID: 31424720 Free Books & Documents.
-
A rapid and systematic review of the clinical effectiveness and cost-effectiveness of paclitaxel, docetaxel, gemcitabine and vinorelbine in non-small-cell lung cancer.Health Technol Assess. 2001;5(32):1-195. doi: 10.3310/hta5320. Health Technol Assess. 2001. PMID: 12065068
-
Automated devices for identifying peripheral arterial disease in people with leg ulceration: an evidence synthesis and cost-effectiveness analysis.Health Technol Assess. 2024 Aug;28(37):1-158. doi: 10.3310/TWCG3912. Health Technol Assess. 2024. PMID: 39186036 Free PMC article.
-
Assessing the comparative effects of interventions in COPD: a tutorial on network meta-analysis for clinicians.Respir Res. 2024 Dec 21;25(1):438. doi: 10.1186/s12931-024-03056-x. Respir Res. 2024. PMID: 39709425 Free PMC article. Review.
-
Systemic pharmacological treatments for chronic plaque psoriasis: a network meta-analysis.Cochrane Database Syst Rev. 2017 Dec 22;12(12):CD011535. doi: 10.1002/14651858.CD011535.pub2. Cochrane Database Syst Rev. 2017. Update in: Cochrane Database Syst Rev. 2020 Jan 9;1:CD011535. doi: 10.1002/14651858.CD011535.pub3. PMID: 29271481 Free PMC article. Updated.
Cited by
-
The Art of Bioimmunogenomics (BIGs) 5.0 in CAR-T Cell Therapy for Lymphoma Management.Adv Pharm Bull. 2024 Jul;14(2):314-330. doi: 10.34172/apb.2024.034. Epub 2024 Mar 10. Adv Pharm Bull. 2024. PMID: 39206402 Free PMC article. Review.
-
Newer generations of multi-target CAR and STAb-T immunotherapeutics: NEXT CART Consortium as a cooperative effort to overcome current limitations.Front Immunol. 2024 May 8;15:1386856. doi: 10.3389/fimmu.2024.1386856. eCollection 2024. Front Immunol. 2024. PMID: 38779672 Free PMC article. Review.
-
Immunological synapse: structures, molecular mechanisms and therapeutic implications in disease.Signal Transduct Target Ther. 2025 Aug 11;10(1):254. doi: 10.1038/s41392-025-02332-6. Signal Transduct Target Ther. 2025. PMID: 40784895 Free PMC article. Review.
-
Applications of artificial intelligence in regenerative dentistry: promoting stem cell therapy and the scaffold development.Front Cell Dev Biol. 2024 Dec 6;12:1497457. doi: 10.3389/fcell.2024.1497457. eCollection 2024. Front Cell Dev Biol. 2024. PMID: 39712572 Free PMC article. Review.
-
Role of artificial intelligence in advancing immunology.Immunol Res. 2025 Apr 24;73(1):76. doi: 10.1007/s12026-025-09632-7. Immunol Res. 2025. PMID: 40272607 Review.
References
-
- Liu D, Badeti S, Dotti G, Jiang JG, Wang H, Dermody J, et al.. The Role of Immunological Synapse in Predicting the Efficacy of Chimeric Antigen Receptor (CAR) Immunotherapy. Cell Commun Signal. 2020;18(1):134. Epub 2020/08/28. doi: 10.1186/s12964-020-00617-7 ; PubMed Central PMCID: PMC7446110. - DOI - PMC - PubMed
-
- Tozeren A, Sung KL, Sung LA, Dustin ML, Chan PY, Springer TA, et al.. Micromanipulation of adhesion of a Jurkat cell to a planar bilayer membrane containing lymphocyte function-associated antigen 3 molecules. J Cell Biol. 1992;116(4):997–1006. Epub 1992/02/01. doi: 10.1083/jcb.116.4.997 PubMed Central PMCID: PMC2289335. - DOI - PMC - PubMed
Publication types
MeSH terms
Substances
Associated data
Grants and funding
LinkOut - more resources
Full Text Sources
Other Literature Sources
Medical
