. 2022 Mar 18;79(4):195.
doi: 10.1007/s00018-022-04198-1.

Impact of phospholipase C β1 in glioblastoma: a study on the main mechanisms of tumor aggressiveness

Affiliations

Impact of phospholipase C β1 in glioblastoma: a study on the main mechanisms of tumor aggressiveness

Stefano Ratti et al. Cell Mol Life Sci. .

Abstract

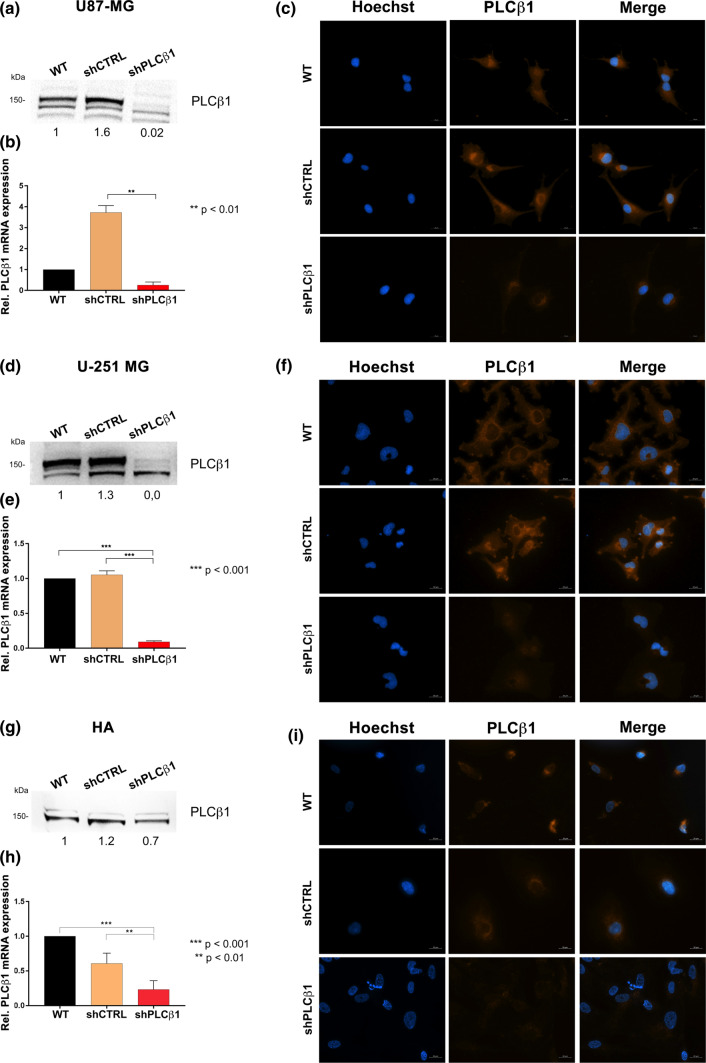
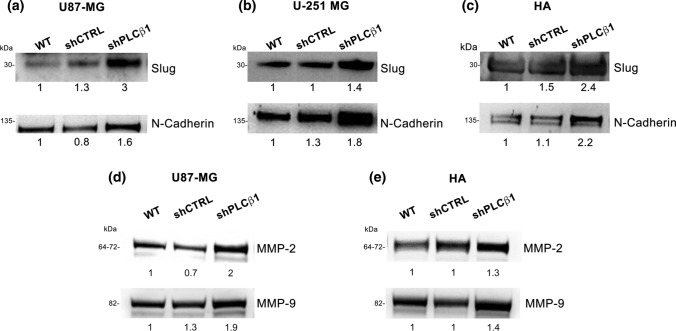
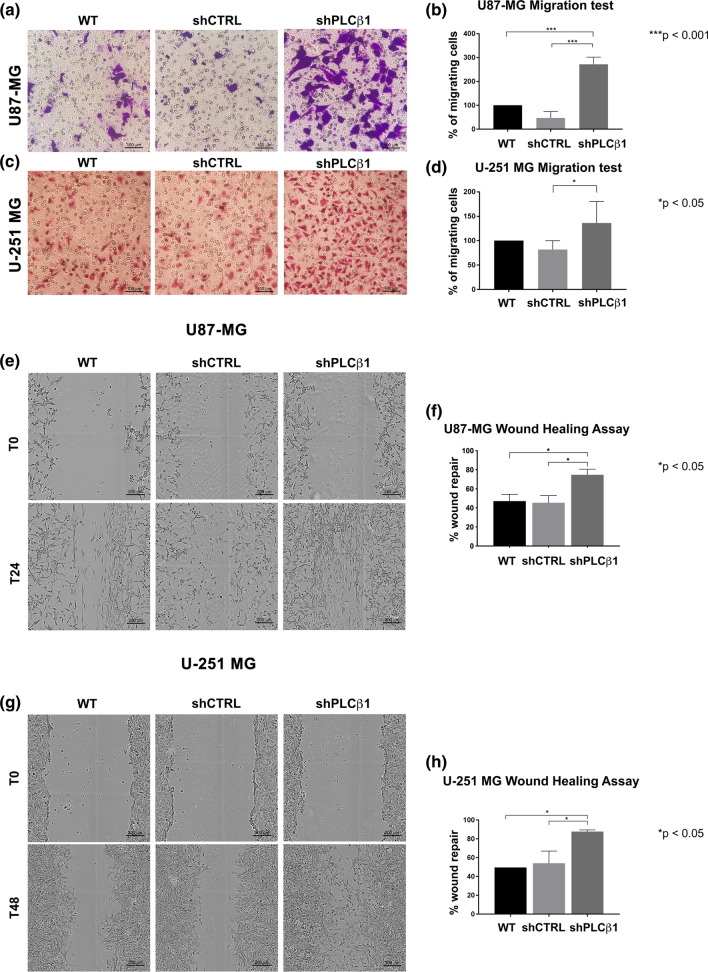
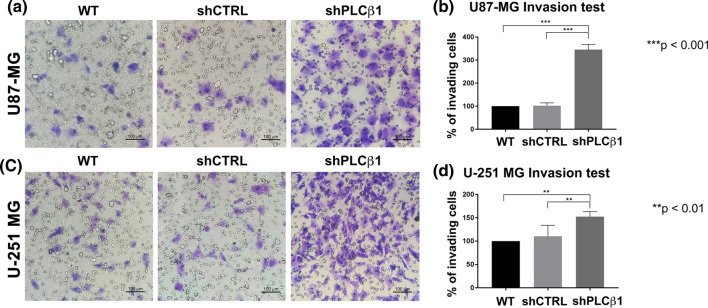
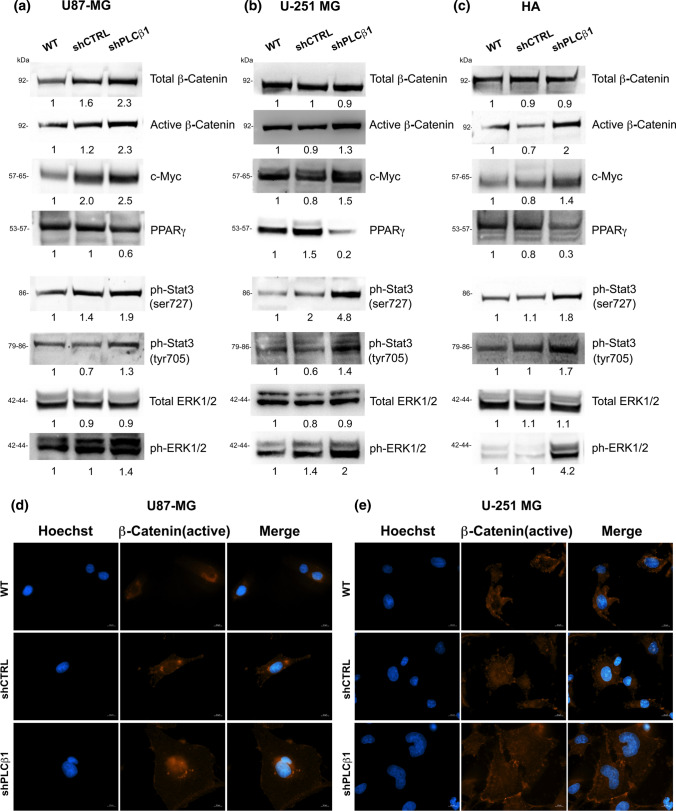
Glioblastoma represents the most lethal brain tumor in adults. Several studies have shown the key role of phospholipase C β1 (PLCβ1) in the regulation of many mechanisms within the central nervous system suggesting PLCβ1 as a novel signature gene in the molecular classification of high-grade gliomas. This study aims to determine the pathological impact of PLCβ1 in glioblastoma, confirming that PLCβ1 gene expression correlates with glioma's grade, and it is lower in 50 glioblastoma samples compared to 20 healthy individuals. PLCβ1 silencing in cell lines and primary astrocytes, leads to increased cell migration and invasion, with the increment of mesenchymal transcription factors and markers, as Slug and N-Cadherin and metalloproteinases. Cell proliferation, through increased Ki-67 expression, and the main survival pathways, as β-catenin, ERK1/2 and Stat3 pathways, are also affected by PLCβ1 silencing. These data suggest a potential role of PLCβ1 in maintaining a normal or less aggressive glioma phenotype.

Keywords: Biomarkers; Brain cancer; Cellular signaling; Glioma; Patients; Phosphoinositides.


Conflict of interest statement

The authors report no competing financial interests.

Figures

Fig. 1
Fig. 1
PLCβ1 expression inversely correlates with the pathological grade of gliomas. a distribution of PLCβ1 expression in gliomas according to WHO grade status in the CGGA database. WHO II, n = 103; WHO III, n = 79; WHO IV, n = 139. The WHO grading of gliomas inversely correlated with mRNA levels of PLCβ1. b Kaplan–Meier survival curves of PLCβ1 high or low expression groups in different glioma patients from the CGGA dataset. Patients were divided according to the median level of PLCβ1 mRNA expression. c PLCβ1 mRNA expression in 50 glioblastoma samples and 4 healthy pools of 5 donors each (20 healthy samples in total). Scatter plots display the distribution of PLCβ1 gene expression in glioblastoma samples compared to healthy samples. Glioblastoma patients were stratified based on their PLCβ1 gene expression: patients with higher PLCβ1 expression compared to controls’ mean PLCβ1 expression are represented in red (12 patients), while patients with lower PLCβ1 expression are shown in blue (38 patients). 18S was used as housekeeping gene and the values are presented as mean ± SD. Asterisks indicate statistically significant differences between the groups, with ***p < 0.001
Fig. 2
Fig. 2
PLCβ1 silencing on U87-MG, U-251 MG cell lines and HA primary astrocytes. Following transduction and antibiotic selection, PLCβ1 mRNA expression, protein levels and localization were evaluated in U87-MG, U-251 MG cells and HA primary astrocytes. PLCβ1-silenced cells (shPLCβ1) were compared to wild type (WT) and mock-transduced cells (shCTRL). U87-MG and U-251 MG cells were tested after one month of antibiotic selection, while HA primary astrocytes were analyzed after 48 h of puromycin selection, i.e. 96 h after transduction overall. a, d, g Western blot analysis of PLCβ1 expression in U87-MG (a), U-251 MG (d) and HA primary astrocytes (g). Densitometric analysis was performed with total protein normalization through the iBright analysis software. Western blot results are representative of three independent experiments. b, e and h PLCβ1 mRNA expression in U87-MG (b), U-251 MG (e) and HA primary astrocytes (h). GAPDH was used as housekeeping gene and all the analysis derived from three independent experiments, with **p < 0.01, ***p < 0.001. c, f and i immunofluorescence staining of PLCβ1 (red) in U87-MG (c), U-251 MG (f) and HA primary astrocytes (i) (magnification ×40, bar: 20 μm). Nuclei were stained with Hoechst 33,342 (blue). Results are representative of at least five different fields
Fig. 3
Fig. 3
PLCβ1 silencing leads to increased mesenchymal markers and matrix metalloproteinases expression. a, b and c Western blot analysis of the expression of mesenchymal markers Slug and N-Cadherin after PLCβ1 silencing on U87-MG (a), U-251 MG (b) and HA primary astrocytes (c). d and e Western blot analysis of matrix metalloproteinases MMP-2 and MMP-9 expression on U87-MG (d) and HA primary astrocytes (e). PLCβ1-silenced cells (shPLCβ1) were compared to wild type (WT) and mock-transduced (shCTRL) samples. Densitometric analysis was performed with total protein normalization through the iBright analysis software. Western blot results are representative of three independent experiments
Fig. 4
Fig. 4
PLCβ1 silencing causes increased cell migration in U87-MG and U-251 MG cell lines. a and c representative images of transwell migration assays in U87-MG (a) and U-251 MG (c) cell lines. PLCβ1-silenced cells (shPLCβ1) were compared to wild type (WT) and mock-transduced (shCTRL) cells. Magnification ×20 (bar: 100 μm). b and d graphical representations of transwell migration assays of PLCβ1-silenced cells (shPLCβ1) compared to wild type (WT) and mock-transduced (shCTRL) cells in U87-MG (b) and U-251 MG (d) cell lines. Columns show the mean ± SD of three independent experiments with *p < 0.05, ***p < 0.001. e and g wound healing assays of U87-MG (e) and U-251 MG (g) cell lines. PLCβ1-silenced cells (shPLCβ1) were compared to wild type (WT) and mock-transduced (shCTRL) cells. Representative pictures were taken at 0 h, 24 h (for U87-MG) and 0 h, 48 h (for U-251 MG) after scratching. Magnification ×10 (bar: 200 μm). f and h graphical representations of wound healing assays of PLCβ1-silenced cells (shPLCβ1) compared to wild type (WT) and mock-transduced (shCTRL) cells in U87-MG (f) and U-251 MG (h) cell lines. Columns show the mean ± SD of three independent experiments with *p < 0.05
Fig. 5
Fig. 5
PLCβ1 silencing determines increased cell invasion in U87-MG and U-251 MG cell lines. a and c representative images of transwell invasion assays with Geltrex coating in U87-MG (a) and U-251 MG (c) cell lines. PLCβ1-silenced cells (shPLCβ1) were compared to wild type (WT) and mock-transduced (shCTRL) cells. Magnification ×20 (bar: 100 μm). b and d graphical representations of transwell invasion assays of PLCβ1-silenced cells (shPLCβ1) compared to wild type (WT) and mock-transduced (shCTRL) cells in U87-MG (b) and U-251 MG (d) cell lines. Columns show the mean ± SD of three independent experiments with **p < 0.01***p < 0.001
Fig. 6
Fig. 6
PLCβ1 silencing causes increased cell migration and invasion in HA primary astrocytes. a Representative images of transwell migration assay in HA primary astrocytes. PLCβ1-silenced cells (shPLCβ1) were compared to wild type (WT) and mock-transduced (shCTRL) cells. Magnification ×20 (bar: 100 μm). b Graphical representation of transwell migration assay of PLCβ1-silenced cells (shPLCβ1) compared to wild type (WT) and mock-transduced (shCTRL) cells. Columns show the mean ± SD of three independent experiments with ***p < 0.001. c Representative images of transwell invasion assay with Geltrex coating in HA primary astrocytes. PLCβ1-silenced cells (shPLCβ1) were compared to wild type (WT) and mock-transduced (shCTRL) cells. Magnification ×20 (bar: 100 μm). d Graphical representation of transwell invasion assay of PLCβ1-silenced cells (shPLCβ1) compared to wild type (WT) and mock-transduced (shCTRL) cells. Columns show the mean ± SD of three independent experiments with *p < 0.05. e Wound healing assay of HA primary astrocytes. PLCβ1-silenced cells (shPLCβ1) were compared to wild type (WT) and mock-transduced (shCTRL) cells. Representative pictures were taken at 0 h and 24 h after scratching. Magnification ×10 (bar: 100 μm). f Graphical representation of wound healing assays of PLCβ1-silenced cells (shPLCβ1) compared to wild type (WT) and mock-transduced (shCTRL) cells. Columns show the mean ± SD of three independent experiments with *p < 0.05 and **p < 0.01
Fig. 7
Fig. 7
PLCβ1 silencing leads to increased cell proliferation. a and b Immunofluorescence staining of Ki-67 (red) at ×63 magnification (bar: 10 μm) in U87-MG (a) and U-251 MG (b). c Immunofluorescence staining of Ki-67 (red) and GFP (green) at ×63 magnification (bar: 10 μm) in HA primary astrocytes. PLCβ1-silenced cells (shPLCβ1) were compared to wild type (WT) and mock-transduced (shCTRL) cells. Nuclei were stained using Hoechst 33,342 (blue). Results are representative of at least five different fields
Fig. 8
Fig. 8
Effects of PLCβ1 silencing on the activation of survival pathways. a, b and c The expression and the phosphorylation of molecules belonging to different survival pathways were evaluated in U87-MG (a), U-251 MG (b) and HA primary astrocytes (c). PLCβ1-silenced cells (shPLCβ1) were compared to wild type (WT) and mock-transduced (shCTRL) cells. Densitometric analysis was performed with total protein normalization through the iBright analysis software. Western blot results are representative of three independent experiments. d and e Immunofluorescence staining of active β-catenin (red) at ×63 magnification (bar: 10 μm) in U87-MG (d) and U-251 MG (e). PLCβ1-silenced cells (shPLCβ1) were compared to wild type (WT) and mock-transduced (shCTRL) cells. Nuclei were stained using Hoechst 33,342 (blue). Results are representative of at least five different fields
Fig. 9
Fig. 9
Graphical Abstract which summarizes the possible role of PLCβ1 in Glioblastoma. Image modified from the original article of Lu et al. [26] that shows an inverse correlation between PLCβ1 expression and the pathological grade of gliomas. After confirming this trend, experimental models based on engineered cell lines and primary astrocytes with silenced PLCβ1, were created. PLCβ1 downregulation determines different relevant physio-pathological alterations, leading the cells to acquire a greater ability of migration and invasion, with the relative increment of the expression of some mesenchymal transcription factors and markers, such as Slug and N-Cadherin, and the metalloproteinases MMP-2 and MMP-9. In addition, also cell proliferation, through the increased expression of Ki-67, and the main survival signaling pathways, such as β-catenin, ERK1/2 and Stat3 pathways, are affected by PLCβ1 silencing. All in all, these data suggest a potential role of PLCβ1 in maintaining a normal or less aggressive phenotype of glioma

Similar articles

Cited by

References

    1. Xu S, Tang L, Li X, Fan F, Liu Z. Immunotherapy for glioma: current management and future application. Cancer Lett. 2020;476:1–12. doi: 10.1016/j.canlet.2020.02.002. - DOI - PubMed
    1. Louis DN, Perry A, Reifenberger G, von Deimling A, Figarella-Branger D, Cavenee WK, et al. The 2016 World Health Organization classification of tumors of the central nervous system: a summary. Acta Neuropathol. 2016;131(6):803–820. doi: 10.1007/s00401-016-1545-1. - DOI - PubMed
    1. Cho H-H, Park H. Classification of low-grade and high-grade glioma using multi-modal image radiomics features. Annu Int Conf IEEE Eng Med Biol Soc. 2017;2017:3081–3084. doi: 10.1109/EMBC.2017.8037508. - DOI - PubMed
    1. Ramirez YP, Weatherbee JL, Wheelhouse RT, Ross AH. Glioblastoma multiforme therapy and mechanisms of resistance. Pharmaceuticals (Basel) 2013;6(12):1475–1506. doi: 10.3390/ph6121475. - DOI - PMC - PubMed
    1. Stoyanov GS, Dzhenkov D, Ghenev P, Iliev B, Enchev Y, Tonchev AB. Cell biology of glioblastoma multiforme: from basic science to diagnosis and treatment. Med Oncol. 2018;35(3):27. doi: 10.1007/s12032-018-1083-x. - DOI - PubMed

Substances