. 2022 Mar 31;185(7):1172-1188.e28.
doi: 10.1016/j.cell.2022.02.013. Epub 2022 Mar 17.

Mucus sialylation determines intestinal host-commensal homeostasis

Affiliations

Mucus sialylation determines intestinal host-commensal homeostasis

Yikun Yao et al. Cell. .

Abstract

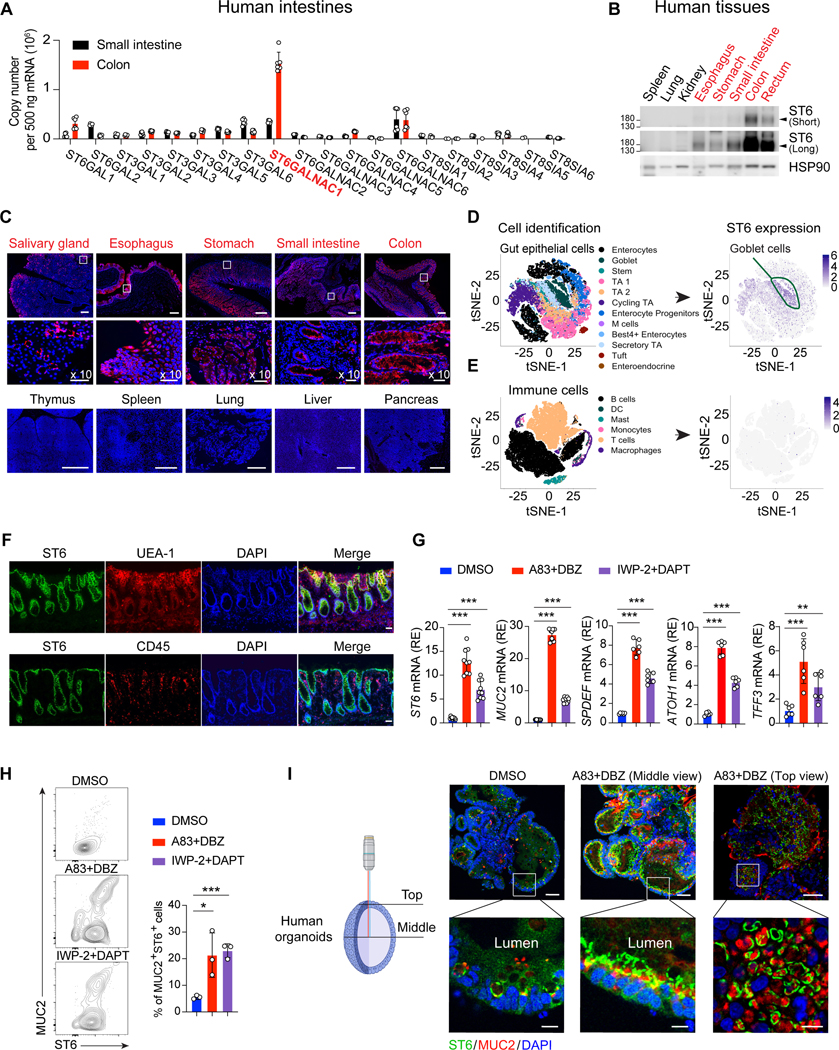
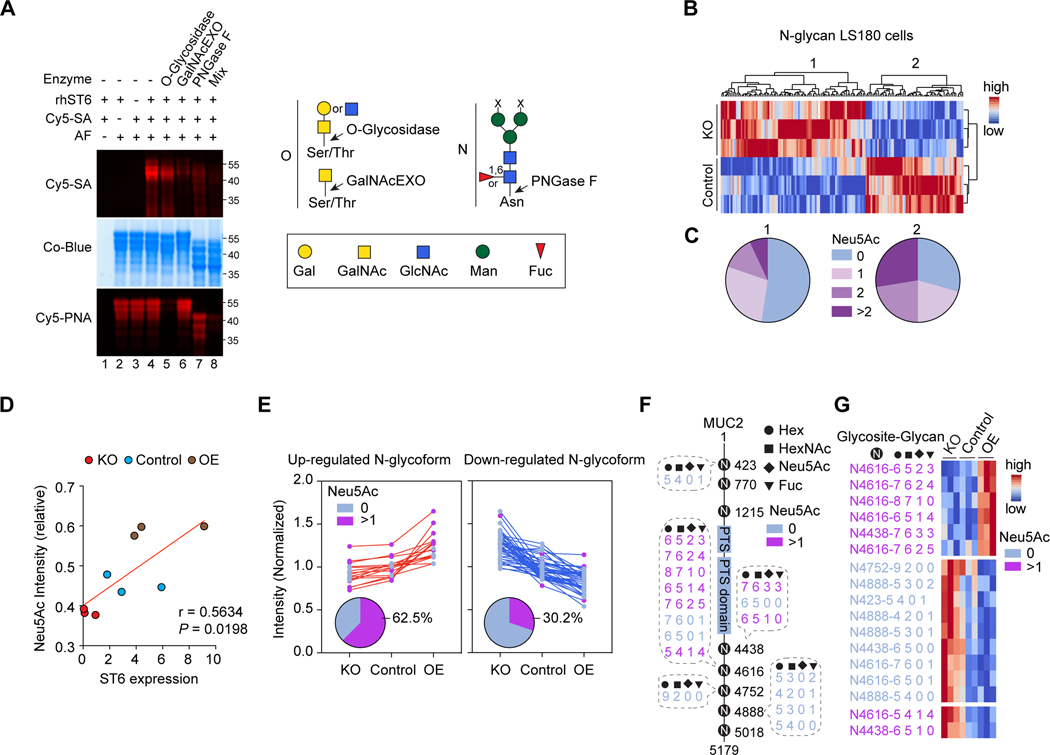
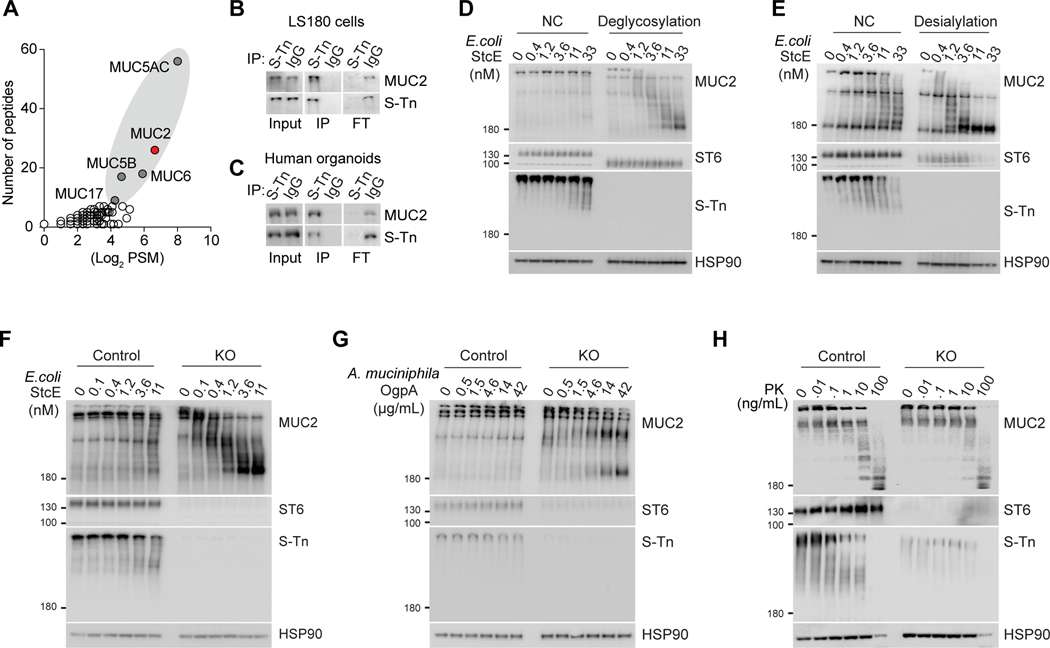
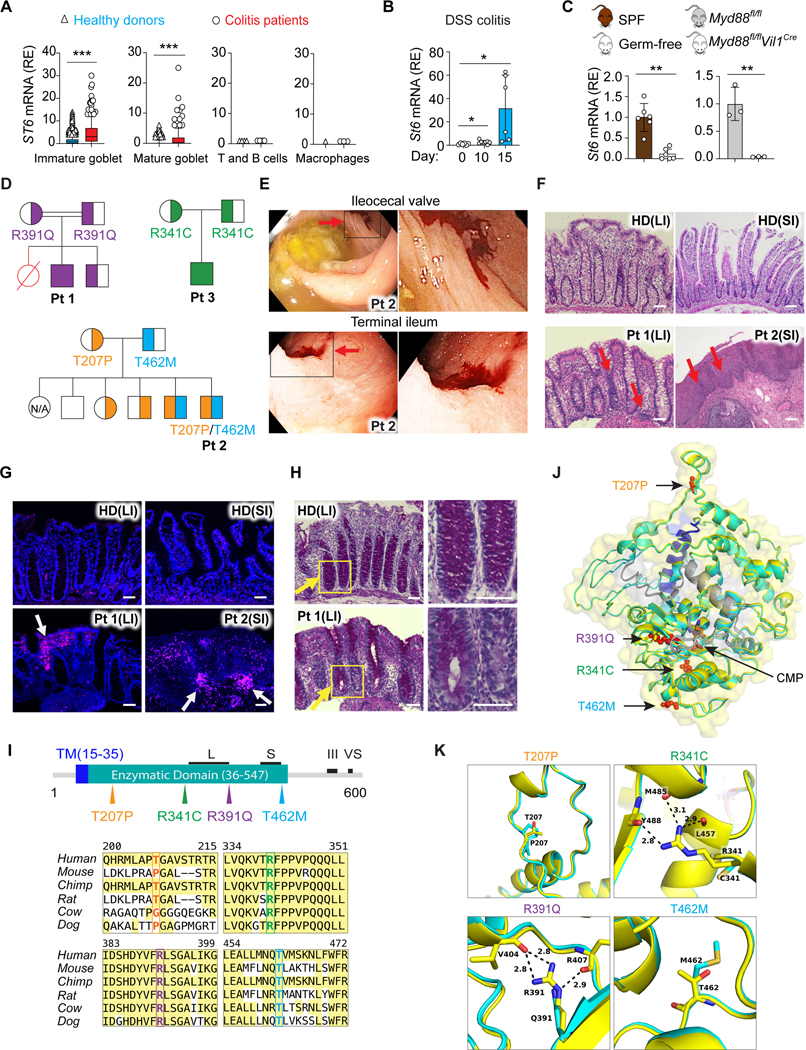
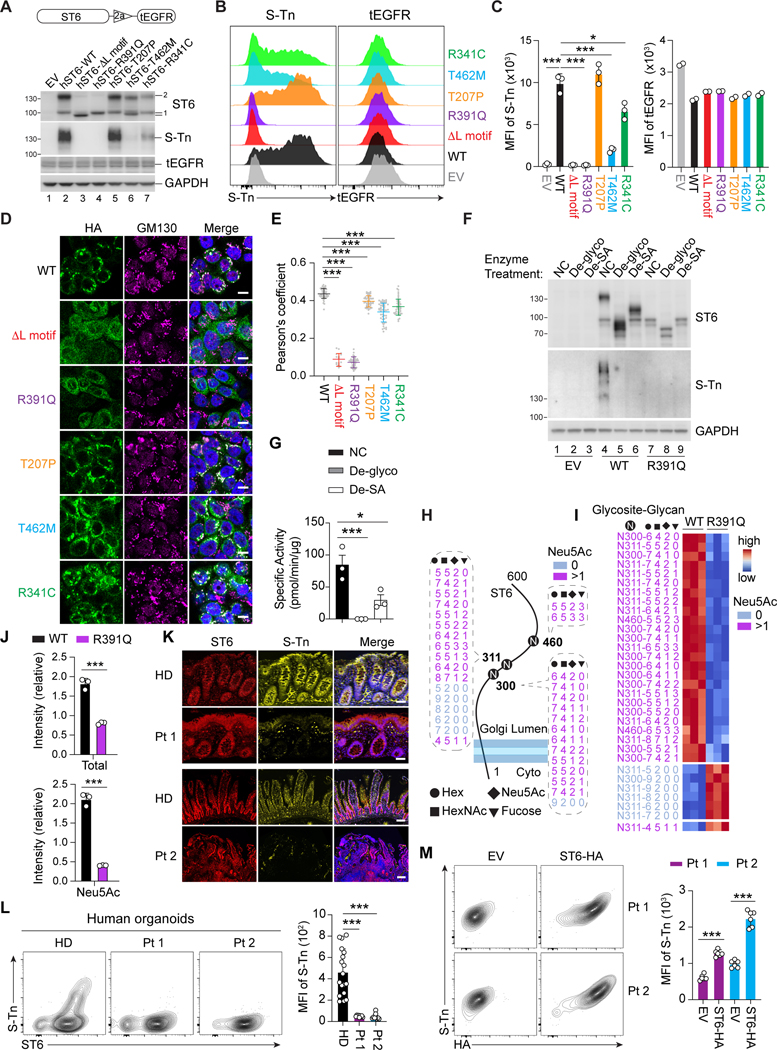
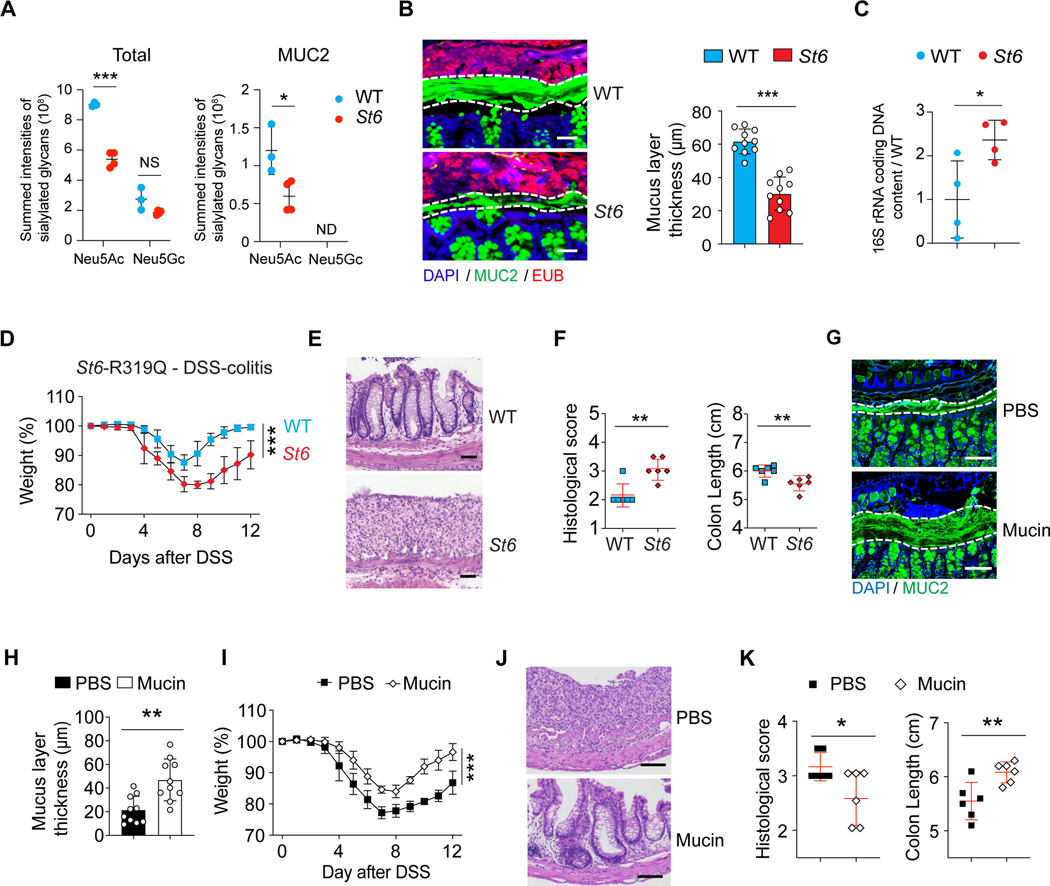
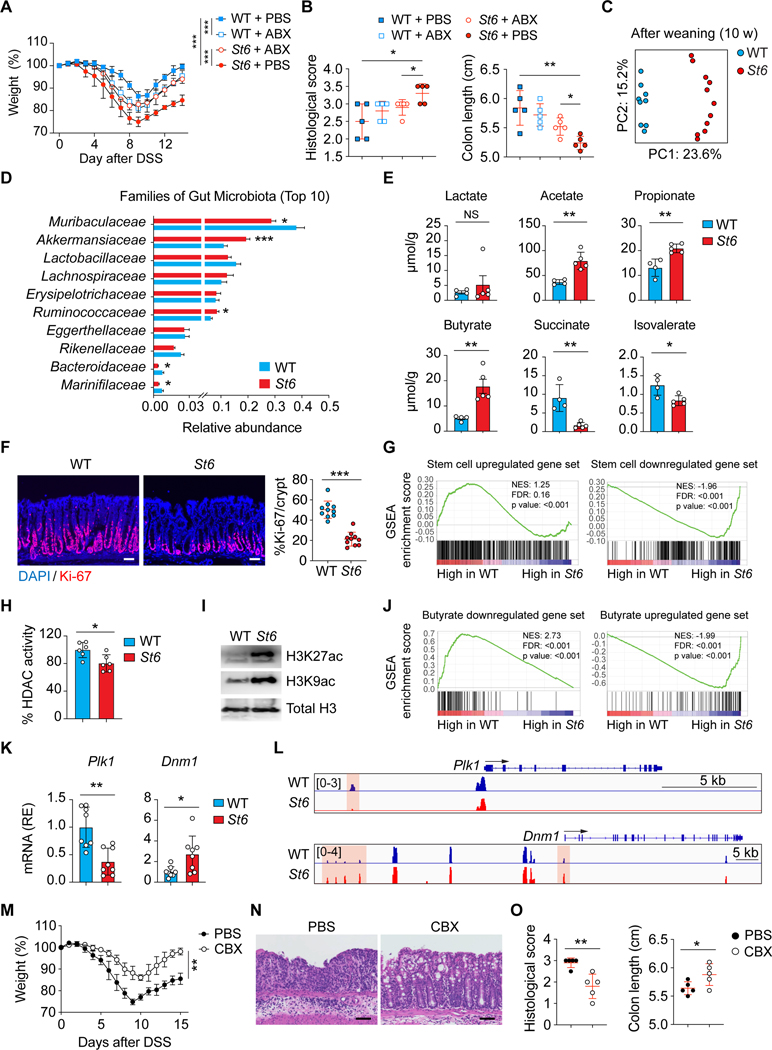
Intestinal mucus forms the first line of defense against bacterial invasion while providing nutrition to support microbial symbiosis. How the host controls mucus barrier integrity and commensalism is unclear. We show that terminal sialylation of glycans on intestinal mucus by ST6GALNAC1 (ST6), the dominant sialyltransferase specifically expressed in goblet cells and induced by microbial pathogen-associated molecular patterns, is essential for mucus integrity and protecting against excessive bacterial proteolytic degradation. Glycoproteomic profiling and biochemical analysis of ST6 mutations identified in patients show that decreased sialylation causes defective mucus proteins and congenital inflammatory bowel disease (IBD). Mice harboring a patient ST6 mutation have compromised mucus barriers, dysbiosis, and susceptibility to intestinal inflammation. Based on our understanding of the ST6 regulatory network, we show that treatment with sialylated mucin or a Foxo3 inhibitor can ameliorate IBD.

Keywords: ST6GalNAc1; dysbiosis; glycobiology; human genetic disease; inflammatory bowel disease; intestinal homeostasis; intestinal stem cells; mucus barrier; short-chain fatty acids; sialylation.


Conflict of interest statement

Declaration of interests The authors declare no competing interests.

Figures

Figure 1
Figure 1. ST6 sialyltransferase is highly expressed in GCs in the colon.
(A) Q-PCR absolute RNA quantification (standard curve method) for the indicated sialyltransferase family genes in human small intestine and colon from healthy donors. ST6GALNAC1 (ST6) in red. (B) Short and long exposures of ST6 and HSP90 (control) protein immunoblots in healthy donor tissues. (C) Confocal photomicrographs of human tissues stained for ST6 (red) and DAPI (blue). Scale bar, 300 μm. Middle panels are 10X enlarged, scale bar, 50 μm. (D, E) t-distributed stochastic neighbor embedding (t-SNE) results of ST6 expression from human colon single cell sequencing obtained from https://doi.org/10.1016/j.cell.2019.06.029. Heat map represents expression level. (F) Human colon section staining by the indicated antibodies, lectin, or DAPI. UEA-1 is a GC marker and CD45 is a hematopoietic marker. Scale bar, 20 μm. (G) Q-PCR analysis of indicated genes in human gut organoids after 5-day culturing in DMSO control or two alternative GC differentiation conditions: A83–01, inhibitor of activin receptor-like kinase (ALK) and dibenzazepine (DBZ), or inhibitor of Wnt production-2 (IWP-2) and N-[N-(3,5-Difluorophenacetyl)-L-alanyl]-S-phenylglycine t-butyl ester (DAPT). (H) Flow cytometry of MUC2 and ST6 in human gut organoids after 5-day culturing in conditions as in (G) quantitated in the right panel. (I) Immunofluorescent staining of MUC2, ST6, and DAPI in human gut organoids after 5-day culturing as in (G). Microscopy view depicted at left. Scale bar, 50 μm. Zoom panels (bottom), scale bar, 10 μm. Data represent 2 (A) or 3 (B, C, F-I) experiments. Error bars represent the standard deviation (SD) of samples within a group. *, p < 0.05; **, p < 0.01; ***, p < 0.001. See also Figure S1.
Figure 2
Figure 2. ST6 modulates N-linked glycosylation.
(A) Fluorescent sialic acid (Cy5-SA, Cy5-Neu5Ac) labeling image (top) and Coomassie blue (Co-Blue) protein stain (middle) of asialofetuin (AF) treated with recombinant human ST6 (rhST6), with or without glycosidase pre-treatments as indicated. Cy5-Peanut agglutinin (PNA) was used as a control (bottom) to detect the enzyme activity of O-glycosidase. (Right) Cartoon of the cleavage sites of O-linked (O) and N-linked (N) glycosidases used. (B) Non-supervised clustering of differently regulated N-glycans expression level (false discovery rate, FDR = 0.3) detected in control and ST6 knockout (KO) LS180 cells (three biological replicates each). Color scale shows N-glycan intensities. (C) Pie charts of molar distributions of SA (Neu5Ac)-quantities in N-glycans in clusters 1 and 2 (calculated from three biological replicates) indicated in (B). Pearson’s chi-squared test (p = 0.0009) was used to calculate the p-value of the proportion of glycan status between clusters 1 and 2. (D) Spearman’s coefficient (r) and significance (P) between ST6 expression level and the relative intensity of SA (Neu5Ac) containing N-glycoforms (FDR = 0.04) on MUC2 detected in LS180 cells with ST6 KO, control, and overexpression (OE). (E) Normalized intensities of up-and down-regulated MUC2 N-glycoforms detected in LS180 cells as in (D). The distribution of SA (Neu5Ac) non-containing (Neu5Ac 0) and containing (Neu5Ac >1) N-glycoforms are shown in the pie charts. (F) Visualization of the regulated MUC2 SA (Neu5Ac) non-containing and containing N-glycoforms (FDR = 0.04) in LS180 cells as in (D). Compositions of the N-glycans are indicated. PTS = proline, threonine, and serine rich domains. (G) Intensity heatmap of the regulated MUC2 N-glycoforms in LS180 cells as in (D). Color scale shows normalized N-glycan intensities. Data represent 3 experiments (A-E, G). See also Figure S2.
Figure 3
Figure 3. ST6 regulates MUC2 stability from bacterial degradation.
(A) Mass spectrometry measurement of S-Tn modified proteins by immunoprecipitation for S-Tn antigen or control IgG of proteins from LS180 cells. PSM = peptide spectrum matches. (B) Immunoblot of MUC2 and S-Tn of immunoprecipitation as in (A). IP = immunoprecipitation, FT = flow-through. (C) Immunoblot as in (B) using human intestine organoids lysates. (D) Western blot (WB) analysis of MUC2, ST6, S-Tn, and HSP90 loading control using LS180 cell lysates pre-treated with buffer only (NC) or deglycosylation enzymes (deglycosylation), then incubated with StcE at the indicated concentrations for 3 hours at 37 °C. (E)WB analysis as in (D) using LS180 cell lysates pre-treated with buffer only (NC) or desialylation enzymes. (F) WB analysis as in (D) using cell lysates from control and ST6 KO LS180 cells. (G) WB analysis as in (D) using OgpA protease at the indicated concentrations for 3 hours at 37 °C. (H) WB analysis as in (D) using proteinase K (PK) at the indicated concentrations for 3 hours at 37 °C. Data represent 2 (A) or 3 (B-H) experiments.
Figure 4
Figure 4. ST6 deficiency causes early onset colitis in humans.
(A) ST6 mRNA in the indicated cell types (Figures 1D and 1E) from healthy donors and colitis patients. Colon single cell sequencing data obtained from https://doi.org/10.1016/j.cell.2019.06.029. Box and whiskers represent the 10th−90th percentiles. (B) St6 mRNA in IECs from WT mice on the indicated days after initiation of 2.5% DSS water treatment. (C) St6 mRNA in IECs from specific-pathogen-free (SPF) and germ-free mice (left panel) or Myd88 IEC specific deficient (Myd88fl/fl Vil1Cre) and control (Myd88fl/fl) mice (right panel). (D) Pedigrees for kindreds 1–3 and patient 1 (Pt 1), Pt 2, and Pt 3, respectively, showing ST6 allele inheritance illustrated by the amino acid substitution. Strikethrough red = deceased individuals; double line = consanguinity. (E) Colonoscopy photographs of Pt 2 showing mucosal ulceration and hemorrhage (red arrows). (Right) Enlargements of the black box. (F) Photomicrographs of H&E-stained biopsy sections from large intestine (colon) (LI) and small intestine (SI) from healthy donor (HD), Pt 1, and Pt 2 with mononuclear infiltration and structural damage indicated by red arrows. Scale bar, 50 μm. (G) Immunofluorescence of biopsies as in (F). White arrows show lymphocyte infiltration. Stains: blue = 4’,6-diamidino-2-phenylindole (DAPI); magenta = CD45. Scale bar, 50 μm. (H) Periodic Acid Schiff staining of colonic tissues from HD and Pt 1. Yellow arrows show the reduced GC staining in Pt 1 sample. Right panels are enlargements of the yellow box. Scale bar, 50 μm. (I) (Top) ST6 protein schematic depicting the transmembrane domain (TM), enzymatic domain, and L (long), S (short), III (third position in the sequence), and VS (very short) motif. (Bottom) Amino acid alignment illustrating conservation in ST6 orthologues with mutants in color. (J, K) Structural model of cytidine 5’-monophosphate (CMP)-bound ST6 color-coded by domains as in (I). The enzymatic domain is shown in yellow, mutant domain in cyan, transmembrane domain (TM) in blue, C terminal domains in grey, and CMP in orange. The Pt amino acid changes are in red (J). Zoomed in models of the amino acids affected by Pt mutations (K). Data represent 3 experiments (B, C, F-H). Error bars represent the SD of samples within a group. *, p < 0.05; **, p < 0.01; ***, p < 0.001. See also Figure S3, Table S1, Table S2 and Data S1.
Figure 5
Figure 5. Impaired enzymatic activity of ST6 mutations.
(A) (Top) Lentiviral co-expression vector with truncated Epidermal Growth Factor Receptor (tEGFR). 2a = 2A self-cleaving peptides. (Bottom) Immunoblot analysis of ST6 and Sialyl-Tn (S-Tn) with stable tEGFR lentiviral vector expression of WT and mutant forms of human ST6 (hST6) in HT29 cells. EV = empty vector. tEGFR and GAPDH are transduction and loading controls, respectively. (B) Flow cytometry analysis of S-Tn and tEGFR in HT29 cells with stable expression of WT and mutant forms of human ST6. (C) Quantification of S-Tn and tEGFR mean fluorescence intensity (MFI) in (B). (D) Confocal photomicrographs of HA-tagged WT and ST6 mutants and the Golgi marker GM130 in HT29 cells with stable ST6 expression. Scale bar, 10 μm. (E) Pearson’s coefficient scores for ST6 and Golgi staining shown visually in (D). (F)ST6 and S-Tn were detected by immunoblot after deglycosylation enzyme mix (De-glyco) (PNGase F, O-Glycosidase, α2–3,6,8,9 Neuraminidase A, β1-4 Galactosidase S, β-N-acetylhexosaminidasef), or desialylation (De-SA) (α2–3,6,8,9 Neuraminidase A) treatment in HT29 cells with stable ST6-WT and ST6-R391Q expression. (G) ST6 enzyme activity was quantitated after deglycosylation (De-glyco) and desialylation (De-SA) treatment. (H) Asparagine (N)-linked glycosylation sites and the modified residues on ST6 in HT29 cells with stable expression of ST6-WT and ST6-R391Q. Glycoforms are shown with their glycan compositions presented as the numbers of Hex, HexNAc, Neu5Ac, and Fucose (dashed). Non-SA (Neu5Ac 0) and SA (Neu5Ac >1)-containing glycoforms are color coded. Cyto = cytoplasm. (I) Intensity heatmap of the ST6 N-glycoforms as in (H). Color scale shows normalized N-glycoform intensities. (J) Relative intensity of total or SA (Neu5Ac)-containing N-glycoforms on ST6 from HT29 cells with stable ST6-WT and ST6-R391Q expression. (K) Immunofluorescent staining of colon biopsies of Pt 1 and HD, and small intestine of Pt 2 and HD showing S-Tn and ST6. Scale bar, 50 μm. (L) Flow cytometry of S-Tn and ST6 in induced pluripotent stem cell (iPSC)-generated intestinal organoids from Pt 1, Pt 2, and HDs after 5 days of culture in GC-inducing conditions. Statistics for S-Tn MFI shown in right panel. (M) Flow cytometry of S-T n and HA (ST6-HA) in iPSC-generated intestinal organoids from Pts 1 and 2 after transducing with EV and ST6-HA lentivirus. (Right) Statistics for S-Tn MFI. Data represent 3 experiments (A-G, I-M). Error bars represent the SD of samples within a group. *, p < 0.05; **, p < 0.01; ***, p < 0.001. See also Figure S4.
Figure 6
Figure 6. St6 mutant mice are more susceptible to DSS-induced colitis.
(A) Summed intensities of the Neu5Ac and N-glycolylneuraminic acid (Neu5Gc) containing N-glycoforms for total protein and MUC2 in IECs from 12-week-old female WT and St6 mice. FDR = 0.3. NS = not significant. ND = not detected. (B) Representative confocal micrographs (left) of colon samples stained for cell nuclei (DAPI), mucus (MUC2 antibody), and fluorescence in situ staining for bacteria (EUB) to quantify the thickness of the mucus layer in 10-week-old female WT and St6 mice (right). Scale bar, 100 μm. (C) Ratio of the quantity of rRNA from infiltrating bacteria isolated from mouse colon mucus of 10-week-old female St6 mice compared to matched WT mice determined by Q-PCR using universal primers for bacterial 16S rRNA genes. (D-F) Body weight changes (D), representative hematoxylin and eosin staining (E), histological scores (left) and colon length measurements (right) (F) in WT and St6 mice after oral administration at day 10 of 2.5% DSS water. Scale bar, 100 μm. (G-K) DSS colitis was induced in St6 mice which were treated with either PBS control or mucins. The thickness of the mucus layer was measured before DSS water (G, H) together with analyses of colitis as in (D-F) (I-K). Scale bar, 100 μm. Data represent 3 experiments (A-K). Error bars represent the SD of samples within a group. *, p < 0.05; **, p < 0.01; ***, p < 0.001. See also Figures S5.
Figure 7
Figure 7. Microbiota changes and excess butyric acid production in St6 mice impairs ISC proliferation.
(A, B) DSS colitis was induced in 10-week-old female WT and St6 mice treated with or without antibiotics (ABX) and analyzed as in Figures 6D and 6F. (C) Principal component analyses (PCA) of gut microbiome using 16S rDNA gene sequencing from WT and St6 female mice after weaning (10 weeks). Dots = individual mice. (C) Ten most abundant (Top 10) gut bacterial families in 10-week-old female WT and St6 mice. (E) Mass spectrometry analysis of SCFAs as indicated in stool samples from 10-week-old WT and St6 female mice. (F) DAPI and Ki-67 staining of colon of WT and St6 mice 10 days after DSS colitis (left) and % Ki-67+ cells (right). Scale bar, 100 μm. (G) Gene set enrichment analysis (GSEA) of murine intestinal crypt stem cell upregulated (left) and downregulated (right) genes from RNA-seq data in Habowski et al., 2020 were compared in WT and St6 mice as in (F). NES = normalized enrichment score. FDR = false discovery rate. (H) Enzyme-based fluorometric assay of HDAC enzyme activity in purified crypt intestinal stem cells (ISCs) from WT and St6 mice as in (F). (I) WB analysis of histone H3 acetylation (H3K27ac and H3K9ac) in ISCs from WT and St6 mice as in (F). Total histone H3 = loading control. (J) GSEA as in (G) of butyrate downregulated (left) and upregulated (right) genes from data in Kaiko et al., 2016 were compared in WT and St6 mice as in (F). (K) Q-PCR RNA analyses of Polo-like kinase 1 (Plk1) and Dynamin 1 (Dmn1) in samples of crypt ISCs of WT and St6 mice as in (F). (L) Normalized ATAC-seq sequencing tracks from WT and St6 mice as in (F) at the Plk1 (top) and the Dmn1 (bottom) loci. Orange shows areas of significant difference. (M-O) DSS colitis induced in St6 mice treated with either PBS or carbenoxolone (CBX) analyzed as in Figures 6D–6F. Scale bar, 100 μm. Data represent 3 experiments (A-F, H, I, K-O). Error bars represent the SD of samples within a group. *, p < 0.05; **, p < 0.01. See also Figure S6.

Comment in

Similar articles

Cited by

References

    1. Alipour M, Zaidi D, Valcheva R, Jovel J, Martinez I, Sergi C, Walter J, Mason AL, Wong GK, Dieleman LA, et al. (2016). Mucosal Barrier Depletion and Loss of Bacterial Diversity are Primary Abnormalities in Paediatric Ulcerative Colitis. Journal of Crohn’s & colitis 10, 462–471. 10.1093/ecco-jcc/jjv223. - DOI - PMC - PubMed
    1. Arike L, Holmen-Larsson J, and Hansson GC (2017). Intestinal Muc2 mucin O-glycosylation is affected by microbiota and regulated by differential expression of glycosyltranferases. Glycobiology 27, 318–328. 10.1093/glycob/cww134. - DOI - PMC - PubMed
    1. Arpaia N, Campbell C, Fan X, Dikiy S, van der Veeken J, deRoos P, Liu H, Cross JR, Pfeffer K, Coffer PJ, and Rudensky AY (2013). Metabolites produced by commensal bacteria promote peripheral regulatory T-cell generation. Nature 504, 451–455. 10.1038/nature12726. - DOI - PMC - PubMed
    1. Atarashi K, Tanoue T, Oshima K, Suda W, Nagano Y, Nishikawa H, Fukuda S, Saito T, Narushima S, Hase K, et al. (2013). Treg induction by a rationally selected mixture of Clostridia strains from the human microbiota. Nature 500, 232–236. 10.1038/nature12331. - DOI - PubMed
    1. Banerjee A, Herring CA, Chen B, Kim H, Simmons AJ, Southard-Smith AN, Allaman MM, White JR, Macedonia MC, McKinley ET, et al. (2020). Succinate Produced by Intestinal Microbes Promotes Specification of Tuft Cells to Suppress Ileal Inflammation. Gastroenterology 159, 2101–2115 e2105. 10.1053/j.gastro.2020.08.029. - DOI - PMC - PubMed

Publication types

Substances