. 2022 Mar 18;54(1):23.
doi: 10.1186/s12711-022-00712-y.

Effect of genotyping strategies on the sustained benefit of single-step genomic BLUP over multiple generations

Affiliations

Effect of genotyping strategies on the sustained benefit of single-step genomic BLUP over multiple generations

Milagros Sánchez-Mayor et al. Genet Sel Evol. .

Abstract

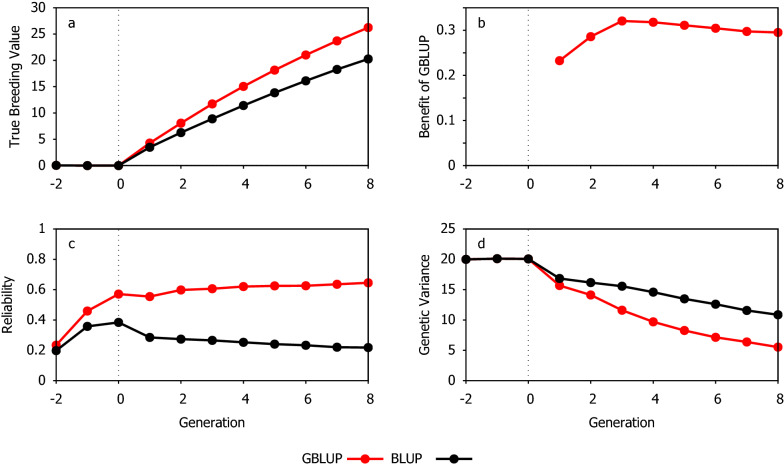
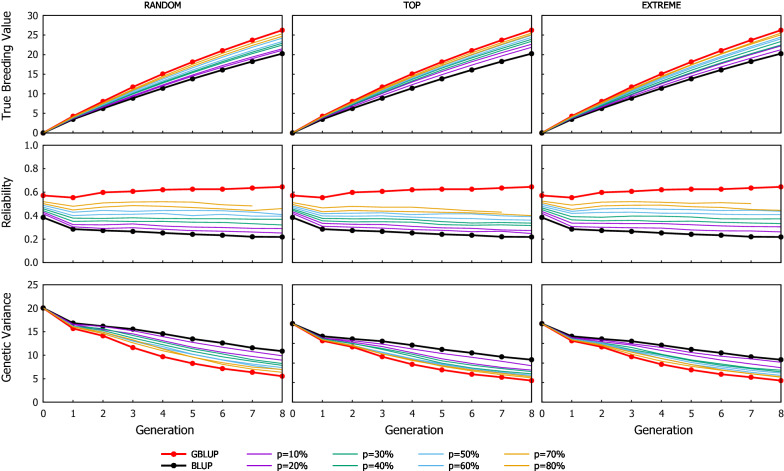
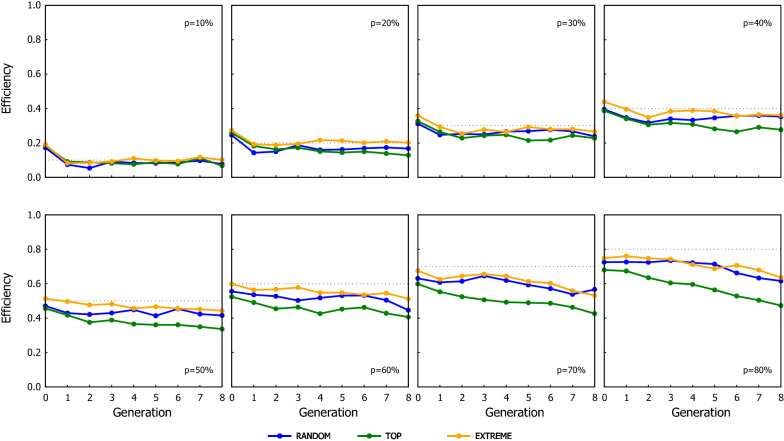
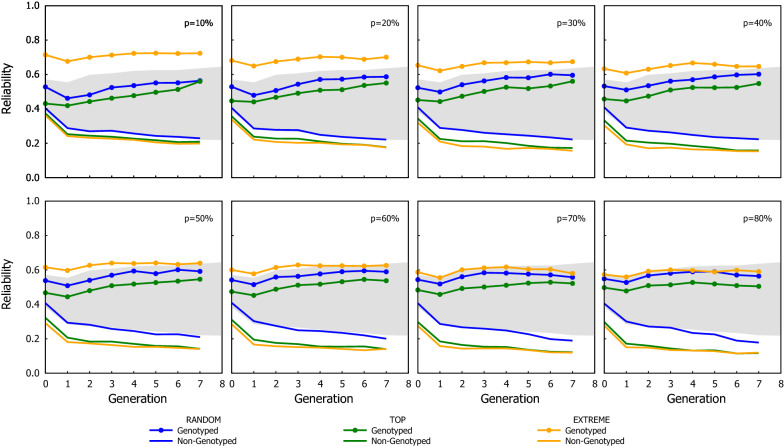
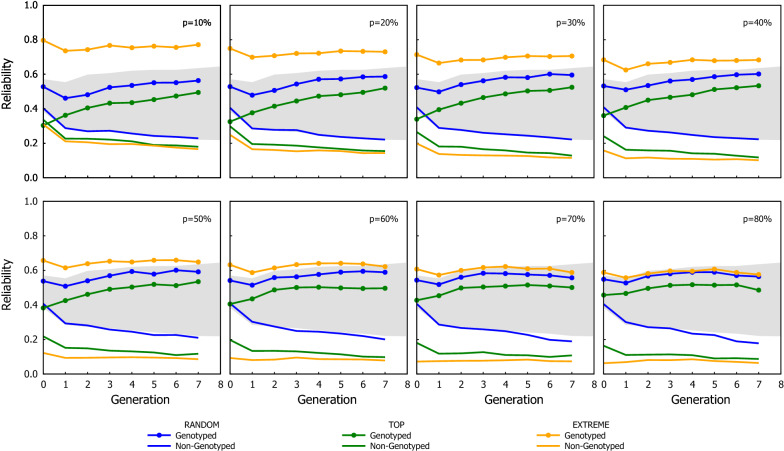
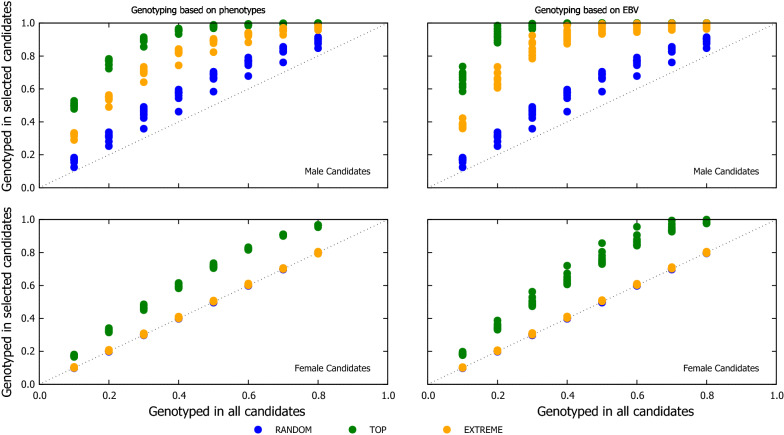
Background: Single-step genomic best linear unbiased prediction (ssGBLUP) allows the inclusion of information from genotyped and ungenotyped individuals in a single analysis. This avoids the need to genotype all candidates with the potential benefit of reducing overall costs. The aim of this study was to assess the effect of genotyping strategies, the proportion of genotyped candidates and the genotyping criterion to rank candidates to be genotyped, when using ssGBLUP evaluation. A simulation study was carried out assuming selection over several discrete generations where a proportion of the candidates were genotyped and evaluation was done using ssGBLUP. The scenarios compared were: (i) three genotyping strategies defined by their protocol for choosing candidates to be genotyped (RANDOM: candidates were chosen at random; TOP: candidates with the best genotyping criterion were genotyped; and EXTREME: candidates with the best and worse criterion were genotyped); (ii) eight proportions of genotyped candidates (p); and (iii) two genotyping criteria to rank candidates to be genotyped (candidates' own phenotype or estimated breeding values). The criteria of the comparison were the cumulated gain and reliability of the genomic estimated breeding values (GEBV).

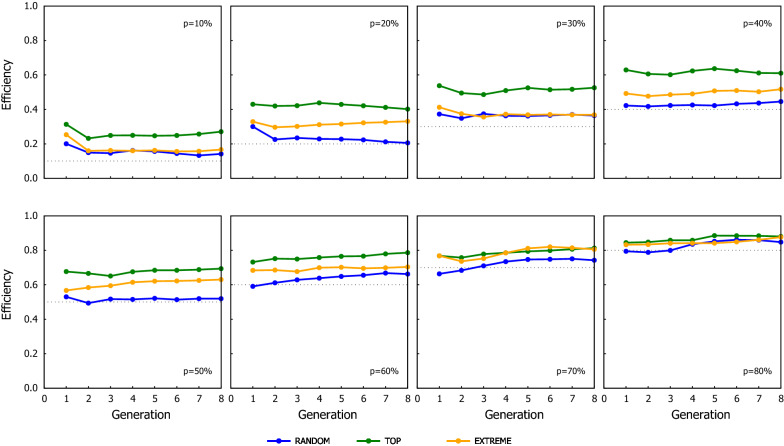
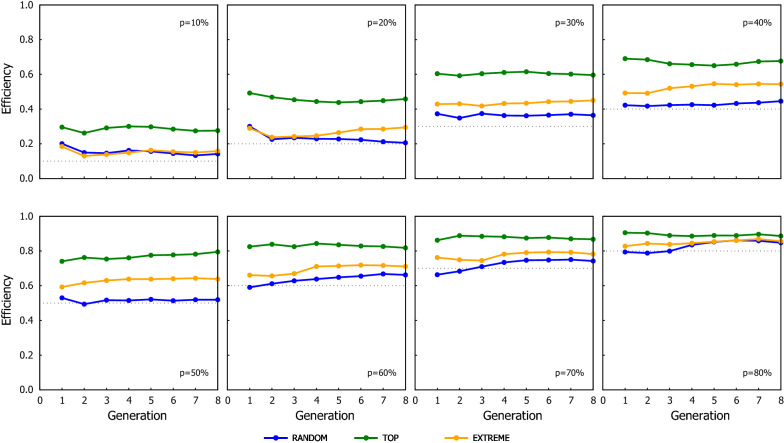
Results: The genotyping strategy with the greatest cumulated gain was TOP followed by RANDOM, with EXTREME behaving as RANDOM at low p and as TOP with high p. However, the reliability of GEBV was higher with RANDOM than with TOP. This disparity between the trend of the gain and the reliability is due to the TOP scheme genotyping the candidates with the greater chances of being selected. The extra gain obtained with TOP increases when the accuracy of the selection criterion to rank candidates to be genotyped increases.

Conclusions: The best strategy to maximise genetic gain when only a proportion of the candidates are to be genotyped is TOP, since it prioritises the genotyping of candidates which are more likely to be selected. However, the strategy with the greatest GEBV reliability does not achieve the largest gain, thus reliability cannot be considered as an absolute and sufficient criterion for determining the scheme which maximises genetic gain.


Conflict of interest statement

The authors declare that they have no competing interests.

Figures

Fig. 1
Fig. 1
Comparison of the response to selection when using GBLUP (red lines) and BLUP (black lines) evaluation over all generations. a Cumulative genetic gain, b Extra gain from GBLUP over BLUP, c Reliability of GEBV and d Remaining genetic variance
Fig. 2
Fig. 2
Response to selection over generations for the ssGBLUP scenarios using the three genotyping strategies (RANDOM: left column, TOP: middle column and EXTREME: right column), when the proportion of the genotyped candidates was chosen based on phenotypes. Graphs in the top row show the cumulative genetic gain, graphs in the middle row show the reliability, and graphs in the bottom row show the genetic variance. Results from GBLUP and BLUP are also shown as they are the respective upper and lower limits of ssGBLUP, equivalent to the situations where 100% and 0% of the candidates are genotyped
Fig. 3
Fig. 3
Efficiency of the ssGBLUP scenarios in terms of their cumulative genetic response using three genotyping strategies, when the proportion of the genotyped candidates was chosen based on phenotypes. The dotted line in each graph indicates the proportion of candidates that were genotyped in the corresponding scenario shown in the graph
Fig. 4
Fig. 4
Efficiency of the ssGBLUP scenarios in terms of their cumulative genetic response using three genotyping strategies, when the proportion of the genotyped candidates was chosen based on estimated breeding values. The dotted line in each graph indicates the proportion of candidates that were genotyped in the corresponding scenario shown in the graph
Fig. 5
Fig. 5
Efficiency of the ssGBLUP in term of their overall reliability (combining both genotyped and ungenotyped animals) using three genotyping strategies, when the proportion of the genotyped candidates was chosen based on phenotypes. The dotted line in each graph indicates the proportion of candidates that were genotyped in the corresponding scenario shown in the graph
Fig. 6
Fig. 6
Efficiency of ssGBLUP in term of their overall reliability (combining both genotyped and ungenotyped animals) using three genotyping strategies, when the proportion of the genotyped candidates was chosen based on estimated breeding values. The dotted line in each graph indicates the proportion of candidates that were genotyped in the corresponding scenario shown in the graph
Fig. 7
Fig. 7
Reliability of ssGBLUP for group of genotyped and ungenotyped candidates using three genotyping strategies, when the proportion of the genotyped candidates was chosen based on phenotypes. The borders of the grey area are the reliability observed with the GBLUP (upper border) and the BLUP (lower border)
Fig. 8
Fig. 8
Reliability of ssGBLUP for group of genotyped and ungenotyped candidates using three genotyping strategies, when the proportion of the genotyped candidates was chosen based on estimated breeding values. The borders of the grey area are the reliability observed with the GBLUP (upper border) and the BLUP (lower border)
Fig. 9
Fig. 9
Proportion of the genotyped males (top) and females (bottom) candidates which were selected as parents of the next generation using three genotyping strategies, when the proportion of the genotyped candidates was chosen based on phenotypes (left) or EBV (right). Each point is the value for one replicate (out of 100) across the eight proportions of genotyped candidates (i.e. 10, 20, 30, 40, 50, 60, 70 and 80%). A value of 1 on the y-axis means that all genotyped candidates of a given sex were selected and 0 means no genotyped candidate was selected

References

    1. Meuwissen THE, Hayes BJ, Goddard ME. Prediction of total genetic value using genome-wide dense marker maps. Genetics. 2001;157:1819–1829. doi: 10.1093/genetics/157.4.1819. - DOI - PMC - PubMed
    1. Tsai HY, Hamilton A, Tinch AE, Guy DR, Bron JE, Taggart JB, et al. Genomic prediction of host resistance to sea lice in farmed Atlantic salmon populations. Genet Sel Evol. 2016;48:47. doi: 10.1186/s12711-016-0226-9. - DOI - PMC - PubMed
    1. Christensen OF, Madsen P, Nielsen B, Ostersen T, Su G. Single-step methods for genomic evaluation in pigs. Animal. 2012;6:1565–1571. doi: 10.1017/S1751731112000742. - DOI - PubMed
    1. Hayes BJ, Bowman PJ, Chamberlain AJ, Goddard ME. Invited review: Genomic selection in dairy cattle: progress and challenges. J Dairy Sci. 2009;92:433–443. doi: 10.3168/jds.2008-1646. - DOI - PubMed
    1. VanRaden PM, Van Tassell CP, Wiggans GR, Sonstegard TS, Schnabel RD, Taylor JF, et al. Invited review: Reliability of genomic predictions for North American Holstein bulls. J Dairy Sci. 2009;92:16–24. doi: 10.3168/jds.2008-1514. - DOI - PubMed

LinkOut - more resources