. 2022 Mar 18;21(1):77.
doi: 10.1186/s12943-022-01547-3.

Cholesterol promotes EGFR-TKIs resistance in NSCLC by inducing EGFR/Src/Erk/SP1 signaling-mediated ERRα re-expression

Affiliations

Cholesterol promotes EGFR-TKIs resistance in NSCLC by inducing EGFR/Src/Erk/SP1 signaling-mediated ERRα re-expression

Zhenzhen Pan et al. Mol Cancer. .

Abstract

Background: The use of epidermal growth factor receptor tyrosine kinase inhibitors (EGFR-TKIs) brings remarkable benefits for the survival of patients with advanced NSCLC harboring EGFR mutations. Unfortunately, acquired resistance seems to be inevitable and limits the application of EGFR-TKIs in clinical practice. This study reported a common molecular mechanism sustaining resistance and potential treatment options to overcome EGFR-TKIs resistance.

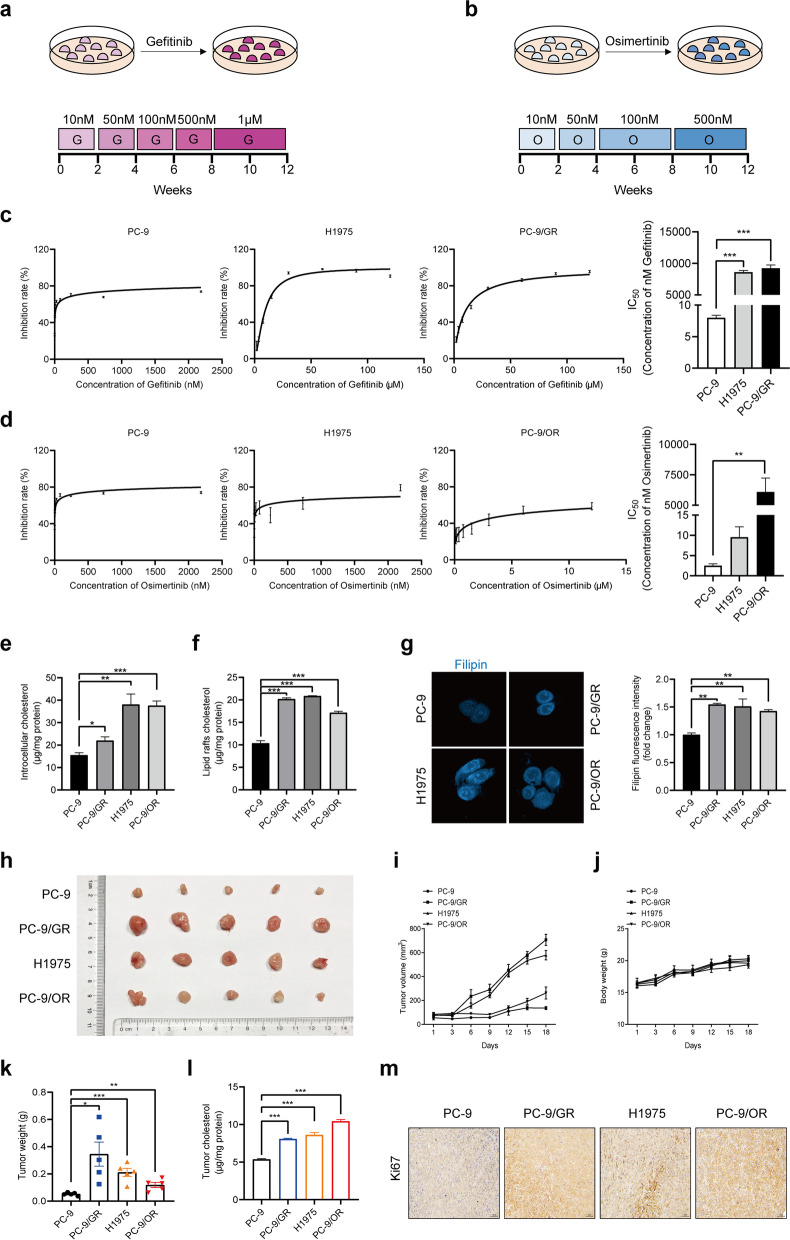
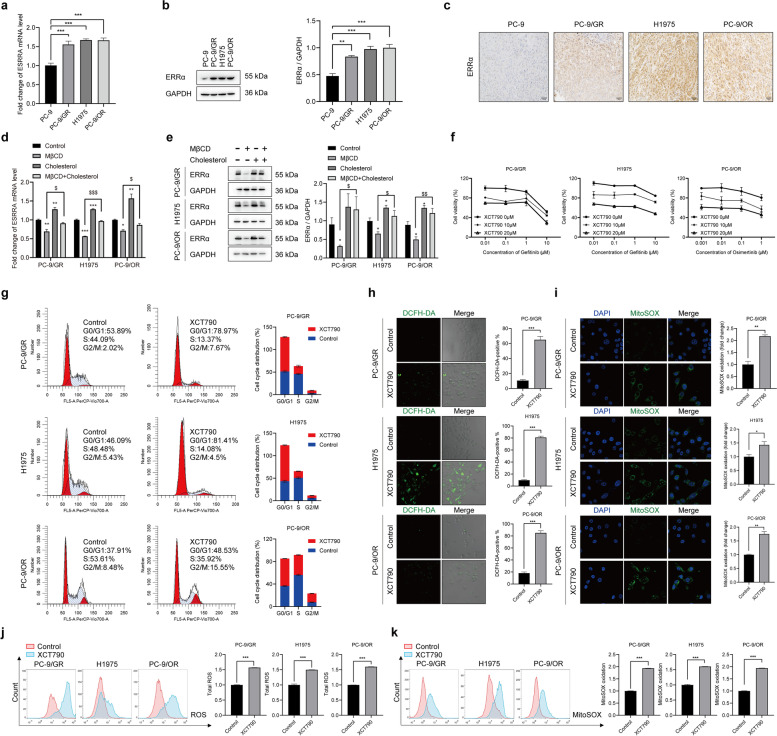
Methods: EGFR-TKIs resistant NSCLC cells were established and confirmed by MTT assay. Cholesterol content was detected and the promotional function of cholesterol on NSCLC growth was determined in vivo. Then, we identified ERRα expression as the downstream factor of cholesterol-mediated drug resistance. To dissect the regulatory mechanism, we conducted experiments, including immunofluorescence, co-immunoprecipitation, luciferase reporter assay and chromatin immunoprecipitation assay.

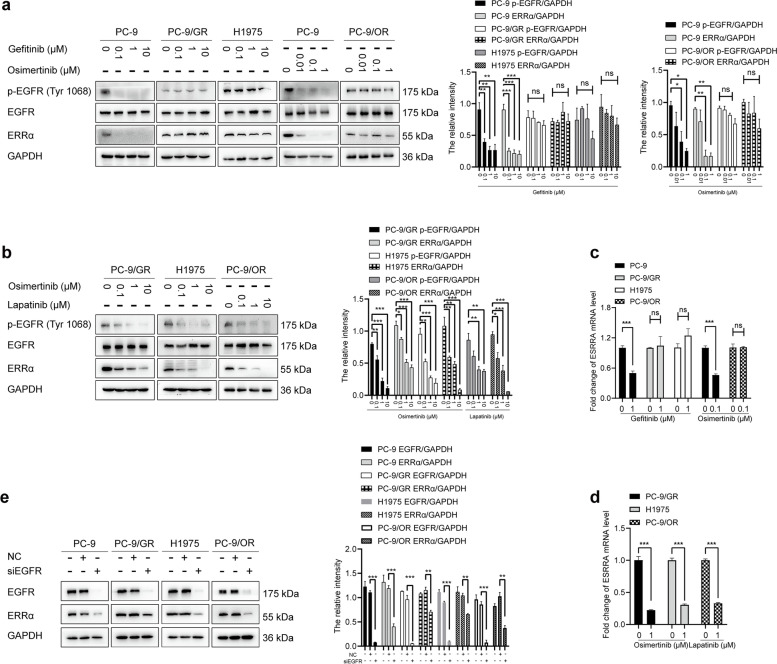
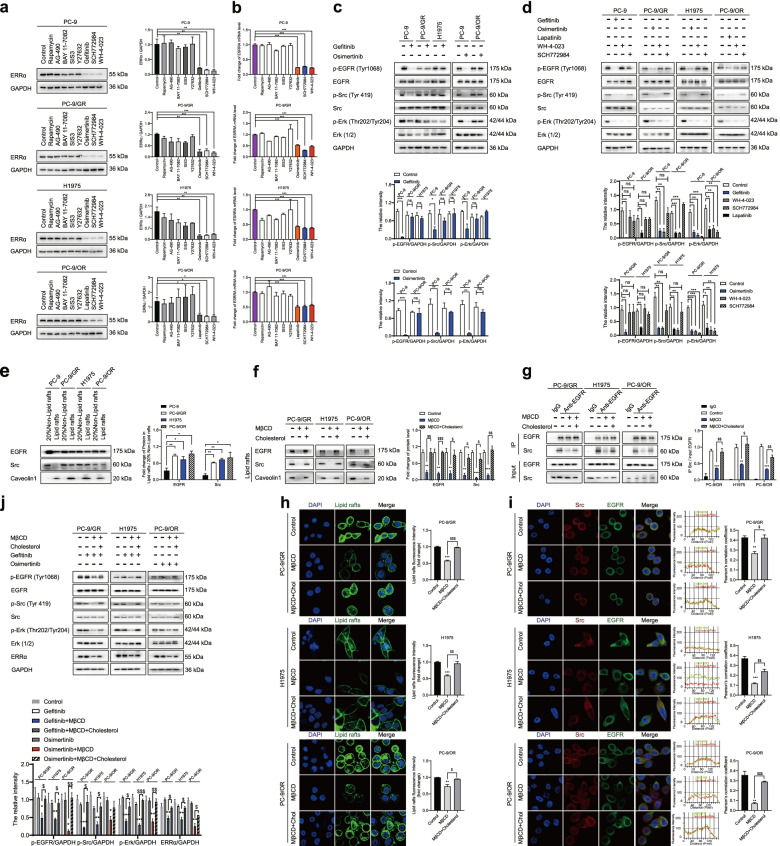
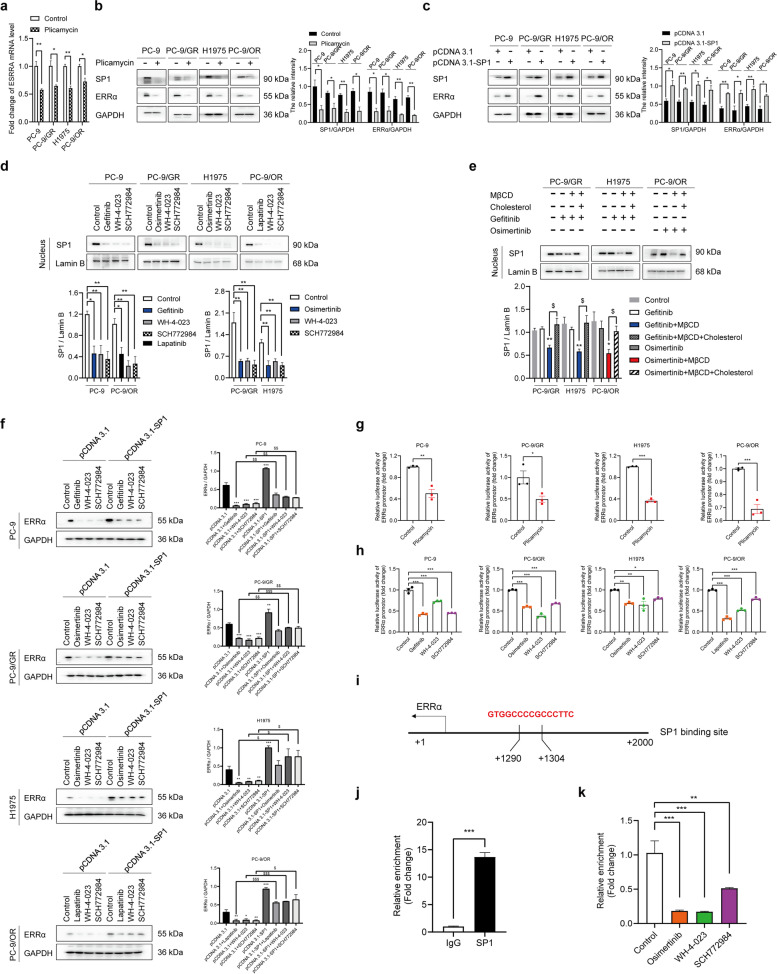
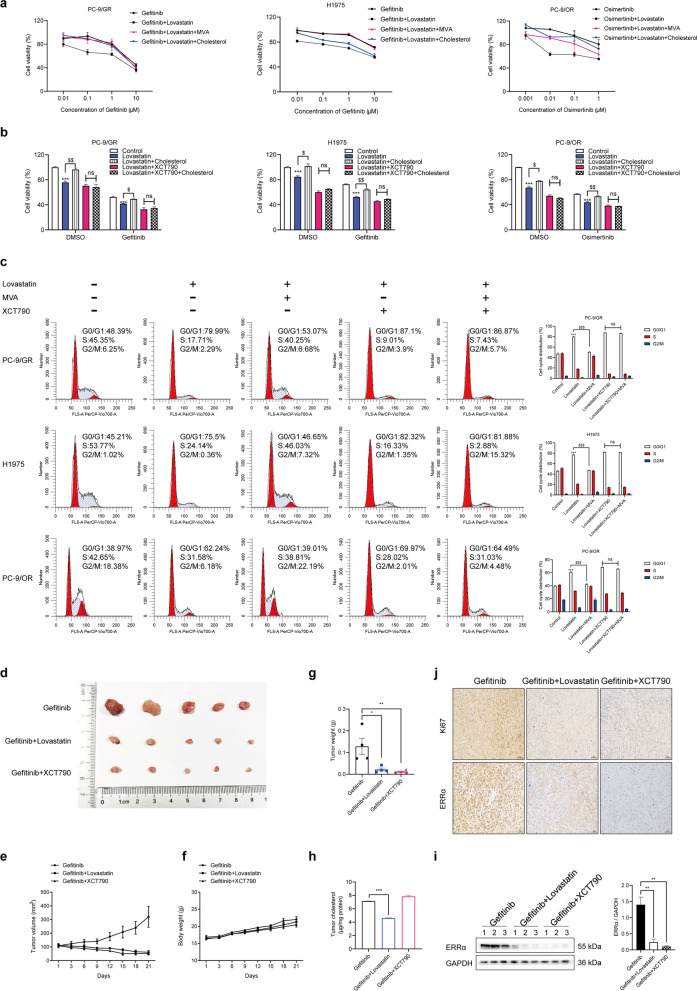
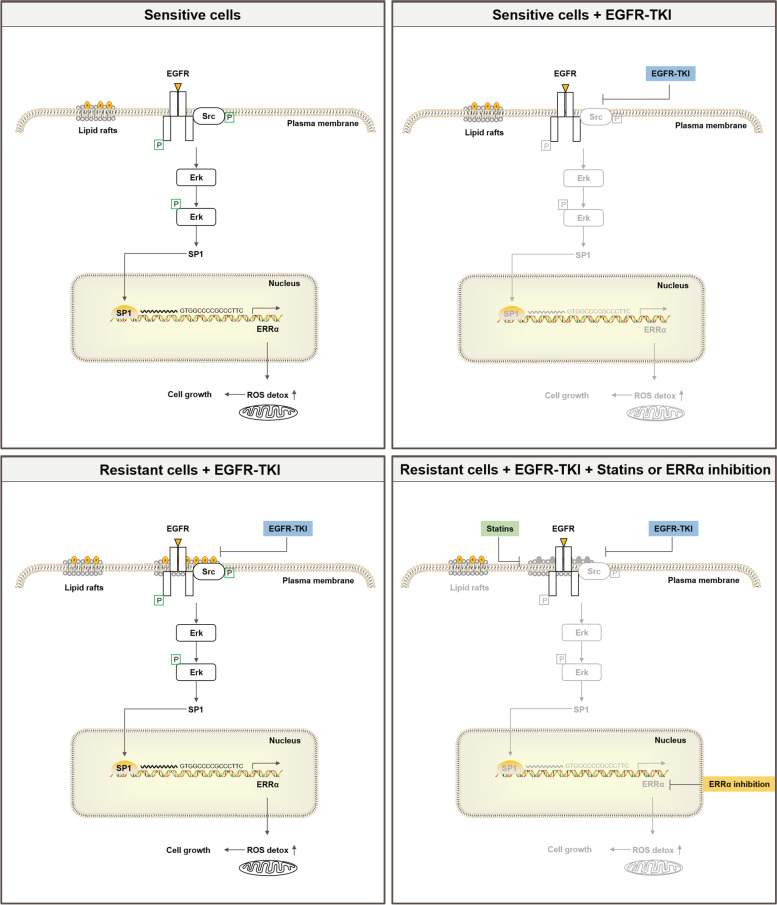
Results: Long-term exposure to EGFR-TKIs generate drug resistance with the characteristic of cholesterol accumulation in lipid rafts, which promotes EGFR and Src to interact and lead EGFR/Src/Erk signaling reactivation-mediated SP1 nuclear translocation and ERRα re-expression. Further investigation identifies ERRα as a target gene of SP1. Functionally, re-expression of ERRα sustains cell proliferation by regulating ROS detoxification process. Lovastatin, a drug used to decrease cholesterol level, and XCT790, an inverse agonist of ERRα, overcome gefitinib and osimertinib resistance both in vitro and in vivo.

Conclusions: Our study indicates that cholesterol/EGFR/Src/Erk/SP1 axis-induced ERRα re-expression promotes survival of gefitinib and osimertinib-resistant cancer cells. Besides, we demonstrate the potential of lowing cholesterol and downregulation of ERRα as effective adjuvant treatment of NSCLC.

Keywords: Cholesterol; EGFR-TKIs resistance; Non-small cell lung cancer.


Conflict of interest statement

The authors declare that they have no competing interests.

Figures

Fig. 1
Fig. 1
Accumulation of cholesterol in lipid rafts is responsible for EGFR-TKIs resistance. a, b PC-9 cells were exposed to gefitinib or osimertinib for 12 weeks to establish the gefitinib-resistant PC-9/GR and osimertinib-resistant PC-9/OR cells. c, d MTT assay was conducted to detect cell viability of NSCLC cells treated with gefitinib or osimertinib. e, f An Amplex® Red Cholesterol Assay Kit (A12216, Invitrogen, Carlsbad, CA, USA) was used to determine cholesterol level in the cytoplasm or lipid rafts of NSCLC cells. g Cells were incubated with 0.5 mg/mL Filipin (MB1848, Meilunbio, Dalian, China) for 2 h. Confocal images showed the free cholesterol in blue and the fluorescence intensity was analyzed. h-m Primary tumor gross appearance, i growth curves, j body weight, and k tumor weight of the tumor xenograft. l Cholesterol level in tumor tissues was determined. m IHC staining detected Ki67 expression in the indicated tumors. Data are expressed as mean ± SEM (n = 3) *p < 0.05, **p < 0.01, ***p < 0.001 in c, d, e, f, g and l. Data are expressed as mean ± SEM (n = 5) *p < 0.05, **p < 0.01, ***p < 0.001 in k
Fig. 2
Fig. 2
Cholesterol-mediated ERRα overexpression is responsible for EGFR-TKIs resistance. a, b Results of RT-qPCR and Western blot assay showed ERRα mRNA and protein level in indicated cells. c IHC staining detected ERRα expression in tumors. d Cells were treated with 2.5 mM MβCD, 10 µM cholesterol or 2.5 mM MβCD +10 µM cholesterol for 6h, then ERRα mRNA level in indicated cells was determined by RT-qPCR assay. e Cells were treated with 2.5 mM MβCD, 10 µM cholesterol or 2.5 mM MβCD +10 µM cholesterol for 24h, then ERRα protein level in indicated cells was determined Western blot assay. f Cells were treated with gefitinib, osimertinib alone or combined with XCT790 for 48 h. Then MTT assay was conducted. g Cells were cultured in medium with XCT790 for 48 h, then fixed with cold ethanol overnight, incubated with PI/RNase staining buffer (550825, BD, Franklin Lake, NJ, USA) for 15 min. Cell cycle distribution was analyzed by flow cytometry. h Cells were treated with XCT790 for 48 h and then incubated with DCFH-DA (S0033S, Beyotime Biotechnology, Shanghai, China) for 30 min. Confocal images showed the ROS in green and the fluorescence intensity was analyzed. i Cells were treated with XCT790 for 48 h and then fixed and incubated with 5 μM MitoSOX Red Mitochondrial Superoxide Indicator (40778ES50, Yeasen, Shanghai, China) for 10 min. Confocal images showed the MitoSOX in green and the fluorescence intensity was analyzed. j, k Flow cytometry analysis was conducted to determine the ROS and MitoSOX accumulation in indicated cells. Data are expressed as mean ± SEM (n = 3) *p < 0.05, **p < 0.01, ***p < 0.001 in a, b, h, i, j and k. Data are expressed as mean ± SEM (n = 3) *p < 0.05, **p < 0.01, ***p < 0.001 compared to control; $p < 0.05, $$p < 0.01, $$$p < 0.001 compared to MβCD in d and e
Fig. 3
Fig. 3
EGFR activation sustains ERRα re-expression. a Western blot assay showed p-EGFR, EGFR and ERRα proteins level after treatment with gefitinib or osimertinib. b Western blot assay showed the proteins level after treatment with osimertinib or lapatinib. c PC-9, PC-9/GR, H1975 and PC-9/OR cells were treated with 1 μM gefitinib or 0.1 μM osimertinib for 6 h. RT-qPCR showed ERRα mRNA level. d PC-9/GR, H1975, PC-9/OR cells were treated with 1 μM osimertinib or 1 μM lapatinib for 6 h. RT-qPCR showed ERRα mRNA level. e Cells were transfected with NC or siEGFR, after 48 h, cells were harvested and the proteins level were detected by Western blot assay. Data are expressed as mean ± SEM (n = 3) *p < 0.05, **p < 0.01, ***p < 0.001 in a, b, c, d and e
Fig. 4
Fig. 4
Cholesterol-induced EGFR/Src/Erk signaling reactivation sustains ERRα re-expression. a, b Western blot and RT-qPCR assay showed ERRα expression after treatment with inhibitors of mTOR, STAT3, NF-κB, Smad3, ROCK, EGFR, Erk or Src. c Cells were treated with 1 μM gefitinib or 0.1 μM osimertinib for 48 h, Western blot assay showed the proteins level. d Cells were treated with gefitinib, osimertinib, lapatinib, WH-4-023 or SCH772984 for 48 h, Western blot assay showed the proteins level. e Proteins in lipid rafts was extracted. Western blot assay showed EGFR and Src protein level in 20% non-lipid rafts fractions and lipid rafts fractions. f Cells were harvested after treatment with 10 mM MβCD for 45 min or 10 mM MβCD for 45 min + 10 μM cholesterol for another 2 h. Proteins in lipid rafts were extracted and EGFR, Src, Caveolin1 expression was detected. g Co-immunoprecipitation analysis showed the EGFR and Src interaction. h Cells were incubated with 1 μg/mL CTB for 1 h after treatment with MβCD or MβCD+ cholesterol. Confocal images showed the lipid rafts in green and the fluorescence intensity was analyzed. i Immunofluorescence staining of EGFR (green) and Src (red) markers in the indicated NSCLC cells after treatment with MβCD or MβCD + cholesterol. j Cells were treated with MβCD or MβCD + cholesterol then subsequently with gefitinib or osimertinib for 48 h, proteins levels were detected. Data are expressed as mean ± SEM (n = 3) *p < 0.05, **p < 0.01, ***p < 0.001 in a, b, c, d and e. Data are expressed as mean ± SEM (n = 3) **p < 0.01, ***p < 0.001 compared to control; $p < 0.05, $$p < 0.01, $$$p < 0.001 compared to MβCD in f, g, h and i. Data are expressed as mean ± SEM (n = 3) *p < 0.05, **p < 0.01, ***p < 0.001 compared to gefitinib or osimertinib; $p < 0.05, $$p < 0.01, $$$p < 0.001 compared to gefitinib + MβCD or osimertinib + MβCD in j
Fig. 5
Fig. 5
SP1 transcribes ERRα directly and cholesterol/EGFR/Src/Erk axis regulates SP1 nuclear translocation. a, b RT-qPCR and Western blot assay showed SP1 or ERRα protein and mRNA level after treatment with SP1 inhibitor (plicamycin). c Cells were transfected with empty pCDNA3.1 or pCDNA3.1-SP1 for 48 h. The protein levels of SP1 and ERRα were determined by Western blot assay. d Cells were harvested after treatment with inhibitors of EGFR (gefitinib or osimertinib or lapatinib), Erk (SCH772984), Src (WH-4-023) for 48 h. Proteins in nucleus were extracted and SP1 expression was conducted by Western blot assay. e Cells were harvested after treatment with 10 mM MβCD for 45 min or 10 mM MβCD for 45 min + 10 μM cholesterol for another 2 h, then with 1 μM gefitinib or 0.1 μM osimertinib for 48 h. Proteins in nucleus were extracted and SP1 expression was conducted by Western blot assay. f Cells were transfected with empty pCDNA3.1 or pCDNA3.1-SP1 along with inhibitors of EGFR, Erk, Src for 48 h. The protein levels of ERRα were determined by Western blot assay. g, h Luciferase assay was performed to determine ERRα promotor activity. i Binding site of SP1 was at the promoter region − 1304 to − 1290 bp. j CHIP-qPCR analysis showed that the promoter amplicons in the SP1-binding site precipitated by anti-SP1 antibody and anti-IgG antibody in H1975 cells. k CHIP-qPCR analysis was performed after cells treated with osimertinib, SCH772984, WH-4-023 for 48 h in H1975 cells. Data are expressed as mean ± SEM (n = 3) *p < 0.05, **p < 0.01, ***p < 0.001 in a, b, c, d, g, h, j and k. Data are expressed as mean ± SEM (n = 3) *p < 0.05, **p < 0.01 compared to gefitinib or osimertinib; $p < 0.05 compared to gefitinib + MβCD or osimertinib + MβCD in e. Data are expressed as mean ± SEM (n = 3) *p < 0.05, **p < 0.01, ***p < 0.001 compared to pCDNA3.1; $p < 0.05, $$p < 0.01, $$$p < 0.001 compared to pCDNA3.1 + inhibitors in f
Fig. 6
Fig. 6
Lovastatin and ERRα inverse agonist enhance the sensitivity of EGFR-TKIs. a Cells were treated with gefitinib or osimertinib, gefitinib or osimertinib+ 10 μM lovastatin, gefitinib or osimertinib+ 10 μM lovastatin+ 100 μM mevalonate, gefitinib or osimertinib+ 10 μM lovastatin+ 10 μM cholesterol for 48 h. Then cell viability was measured by MTT assay. b Cells were treated with gefitinib or osimertinib, along with lovastatin, lovastatin+ cholesterol, lovastatin+ XCT790, lovastatin+ cholesterol+ XCT790. Then cell viability was measured by MTT assay. c Cell cycle distribution was analyzed by flow cytometry after treatment with lovastatin, lovastatin+ MVA, lovastatin+ XCT790, lovastatin+ MVA+ XCT790. d-j Primary tumor gross appearance, e growth curves, f body weight, and g tumor weight of the PC-9/GR xenograft after treatment with indicated drugs for 21 days. h Cholesterol level in tumor tissue was determined. i Western blot assay measured ERRα protein level. j IHC staining detected Ki67 and ERRα expression in the indicated tumors. Data are expressed as mean ± SEM (n = 3) *p < 0.05, **p < 0.01, ***p < 0.001 compared to control; $p < 0.05, $$p < 0.01, $$$p < 0.001 compared to lovastatin in b and c. Data are expressed as mean ± SEM (n = 3) **p < 0.01, ***p < 0.001in h and i. Data are expressed as mean ± SEM (n = 5) *p < 0.05, **p < 0.01 in g
Fig. 7
Fig. 7
A working model of the role of cholesterol/EGFR/Src/Erk/SP1/ERRα axis in dictating the response of NSCLC cells to EGFR-TKIs and potential for cholesterol-lowing drugs or ERRα inverse agonist to counteract EGFR-TKIs resistance in NSCLC

References

    1. Cross DA, Ashton SE, Ghiorghiu S, Eberlein C, Nebhan CA, Spitzler PJ, et al. AZD9291, an irreversible EGFR TKI, overcomes T790M-mediated resistance to EGFR inhibitors in lung cancer. Cancer Discov. 2014;4(9):1046–1061. - PMC - PubMed
    1. Kobayashi S, Boggon TJ, Dayaram T, Janne PA, Kocher O, Meyerson M, et al. EGFR mutation and resistance of non-small-cell lung cancer to gefitinib. N Engl J Med. 2005;352(8):786–792. - PubMed
    1. Lynch TJ, Bell DW, Sordella R, Gurubhagavatula S, Okimoto RA, Brannigan BW, et al. Activating mutations in the epidermal growth factor receptor underlying responsiveness of non-small-cell lung cancer to gefitinib. N Engl J Med. 2004;350(21):2129–2139. - PubMed
    1. Mok TS, Wu YL, Ahn MJ, Garassino MC, Kim HR, Ramalingam SS, et al. Osimertinib or platinum-Pemetrexed in EGFR T790M-positive lung Cancer. N Engl J Med. 2017;376(7):629–640. - PMC - PubMed
    1. Mok TS, Wu YL, Thongprasert S, Yang CH, Chu DT, Saijo N, et al. Gefitinib or carboplatin-paclitaxel in pulmonary adenocarcinoma. N Engl J Med. 2009;361(10):947–957. - PubMed

Publication types

MeSH terms