. 2022 May;149(5):1592-1606.e16.
doi: 10.1016/j.jaci.2022.02.028. Epub 2022 Mar 15.

Distinguishing immune activation and inflammatory signatures of multisystem inflammatory syndrome in children (MIS-C) versus hemophagocytic lymphohistiocytosis (HLH)

Affiliations

Distinguishing immune activation and inflammatory signatures of multisystem inflammatory syndrome in children (MIS-C) versus hemophagocytic lymphohistiocytosis (HLH)

Deepak Kumar et al. J Allergy Clin Immunol. 2022 May.

Abstract

Background: Multisystem inflammatory syndrome in children (MIS-C) is a potentially life-threatening sequela of severe acute respiratory syndrome coronavirus 2 infection characterized by hyperinflammation and multiorgan dysfunction. Although hyperinflammation is a prominent manifestation of MIS-C, there is limited understanding of how the inflammatory state of MIS-C differs from that of well-characterized hyperinflammatory syndromes such as hemophagocytic lymphohistiocytosis (HLH).

Objectives: We sought to compare the qualitative and quantitative inflammatory profile differences between patients with MIS-C, coronavirus disease 2019, and HLH.

Methods: Clinical data abstraction from patient charts, T-cell immunophenotyping, and multiplex cytokine and chemokine profiling were performed for patients with MIS-C, patients with coronavirus disease 2019, and patients with HLH.

Results: We found that both patients with MIS-C and patients with HLH showed robust T-cell activation, markers of senescence, and exhaustion along with elevated TH1 and proinflammatory cytokines such as IFN-γ, C-X-C motif chemokine ligand 9, and C-X-C motif chemokine ligand 10. In comparison, the amplitude of T-cell activation and the levels of cytokines/chemokines were higher in patients with HLH when compared with patients with MIS-C. Distinguishing inflammatory features of MIS-C included elevation in TH2 inflammatory cytokines such as IL-4 and IL-13 and cytokine mediators of angiogenesis, vascular injury, and tissue repair such as vascular endothelial growth factor A and platelet-derived growth factor. Immune activation and hypercytokinemia in MIS-C resolved at follow-up. In addition, when these immune parameters were correlated with clinical parameters, CD8+ T-cell activation correlated with cardiac dysfunction parameters such as B-type natriuretic peptide and troponin and inversely correlated with platelet count.

Conclusions: Overall, this study characterizes unique and overlapping immunologic features that help to define the hyperinflammation associated with MIS-C versus HLH.

Keywords: COVID-19; HLH; MIS-C; T-cell activation; cardiac dysfunction; hyperinflammation.


Figures

None
Graphical abstract
Fig 1
Fig 1
MIS-C and HLH display both unique and shared inflammatory signature. A, Heat map showing expression of cytokines and chemokines in HCs (n = 19), COVID-19 (n = 10), HLH (n = 8), MIS-C (n = 19), and MIS-C follow-up (n = 10) samples. B, Multidimensional cytokine/chemokine data were represented as 2-dimensional PCA space showing clusters for HCs, COVID-19, MIS-C, HLH, and MIS-C follow-up samples. Individuals are shown by small-size colored circles, whereas overall group is shown by large-size colored circles. PC, Principal component; PCA, principal-component analysis.
Fig 2
Fig 2
A-G, Cytokine families showing differences in patients with MIS-C and patients with HLH. Plasma levels of important cytokines belonging to multiple cytokine families were represented by dot plots in HCs (n = 19), COVID-19 (n = 10), HLH (n = 8), MIS-C (n = 19), and MIS-C follow-up (n = 10) samples. Conc., Concentration; ns, not significant. Kruskal-Wallis 1-way ANOVA followed by Dunn’s multiple comparison test for nonnormally distributed samples and ordinary 1-way ANOVA followed by Tukey’s multiple comparison test for normally distributed samples were used for statistical comparison. ∗P < .05, ∗∗P < .01, ∗∗∗P < .001; ∗∗∗∗P < .0001.
Fig 3
Fig 3
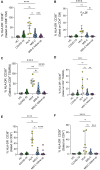
MIS-C and HLH are marked by increase in activation of CD8+ and CD4+ EM T cells. A and B, Representative FACS plots showing surface expression of HLA-DR+ CD38+ markers on the EM compartment of CD8+ and CD4+ T cells in HCs and COVID-19, HLH, MIS-C, and MIS-C follow-up patients. C-F, Percentage of HLA-DR+ CD38+ and HLA-DR+PD-1+ expression in HCs (n = 22) and COVID-19 (n = 24), HLH (n = 6), MIS-C (n = 69), and MIS-C follow-up (n = 31) patients in CD8+ and CD4+ EM compartments. FACS, Fluorescence-activated cell sorting; ns, not significant. Data represent median with interquartile range values for each group. Kruskal-Wallis 1-way ANOVA followed by Dunn’s multiple comparison test for nonnormally distributed samples and ordinary 1-way ANOVA followed by Tukey’s multiple comparison test for normally distributed samples were used for statistical comparison. ∗∗∗P < .001; ∗∗∗∗P < .0001.
Fig 4
Fig 4
Comparison of different laboratory parameters in patients with COVID-19, HLH, and MIS-C. Dot plots showing the plasma levels of ferritin (A), sIL-2R (B), and sCD163 (C) in different patient cohorts. Dotted lines represent ferritin cutoff levels of 500 ng/mL and sIL-2R cutoff levels of 2400 U/mL. D, Plots showing NLR in different patient cohorts. E and F, Plots showing ratio of ANC with CD8+ and CD4+ EM T-cell activation. ALC, Absolute lymphocyte count; ANC, absolute neutrophil count; Conc., concentration; NLR, neutrophil to lymphocyte ratio.
Fig 5
Fig 5
Cardiac dysfunction markers correlate with T-cell activation in patients with MIS-C and COVID-19. A-D, Scatter plots showing correlation of serum BNP and troponin levels with CD8+ and CD4+ EM T-cell activation. E-H, Scatter plots showing correlation of serum BNP and troponin levels with ferritin and CRP. Spearman correlation coefficient and P values are indicated.
Fig 6
Fig 6
Correlation of laboratory features and immune activation markers in MIS-C and COVID-19. A and B, Plots showing inverse correlation between platelets and T-cell activation. Spearman’s correlation coefficient and P values are shown. C, Correlation matrix showing positive and inverse correlations between different clinical parameters in patients with COVID-19 and patients with MIS-C. ALC, Absolute lymphocyte count; ALT, alanine transaminase; ANC, absolute neutrophil count; WBC, white blood cell. Positive correlation is shown as blue-colored circles, whereas inverse correlation is shown as red-colored circles. Size and intensity of colored circles show the strength of correlation. Only significant correlations with P less than .05 are shown as colored circles.
Fig E1
Fig E1
Distribution of follow-up blood sampling of patients with MIS-C. “0” represents the first blood sample drawn, and circles represent when follow-up samples were obtained since initial diagnosis.
Fig E2
Fig E2
Treatment and blood sampling timeline of patients with MIS-C. Timeline for patients with MIS-C indicating blood sampling with respect to start of steroid treatment (vertical dotted line). IVIG, Intravenous immunoglobulin. Each row represents an individual patient with MIS-C. “0” represents blood sampling within first 24 hours of initiation of steroid treatment. “1” represents blood sampling within 24 to 48 hours of steroid initiation and so on. ∗ represents patients with MIS-C who did not receive any steroids during hospital stay. Φ represents patients in whom blood sampling was done before IVIG. Δ represents patients who did not receive IVIG. Rest all patients received IVIG before blood sampling.
Fig E3
Fig E3
Comparison of serum levels of selected cytokines in different patient groups. Dot plots showing serum concentrations of selected cytokines/chemokines in HCs and patients with COVID-19, patients with HLH, and patients with MIS-C. Conc., Concentration; ns, not significant. Kruskal-Wallis 1-way ANOVA followed by Dunn’s multiple comparison test for nonnormally distributed samples and ordinary 1-way ANOVA followed by Tukey’s multiple comparison test for normally distributed samples were used for statistical comparison. ∗P < .05, ∗∗P < .01, ∗∗∗P < .001; ∗∗∗∗P < .0001.
Fig E3
Fig E3
Comparison of serum levels of selected cytokines in different patient groups. Dot plots showing serum concentrations of selected cytokines/chemokines in HCs and patients with COVID-19, patients with HLH, and patients with MIS-C. Conc., Concentration; ns, not significant. Kruskal-Wallis 1-way ANOVA followed by Dunn’s multiple comparison test for nonnormally distributed samples and ordinary 1-way ANOVA followed by Tukey’s multiple comparison test for normally distributed samples were used for statistical comparison. ∗P < .05, ∗∗P < .01, ∗∗∗P < .001; ∗∗∗∗P < .0001.
Fig E4
Fig E4
Gating strategy used to define CD4+ and CD8+ T-cell activation in different patient cohorts. FSC-A, Forward scatter-area; FSC-H, forward scatter-height; SSC-A, side scatter-area.
Fig E5
Fig E5
Evaluation of differences in CD8+ EM T-cell activation in patient cohorts. ROC curves showing optimal threshold value with corresponding percentage sensitivity and specificity for frequency of HLA-DR+CD38+ on EM CD8+ T cells between HCs vs MIS-C (A), MIS-C vs COVID-19 (B), and HLH vs MIS-C (C). AUC, Area under the ROC curve.
Fig E6
Fig E6
Comparison of T-cell activation in different subsets of CD8+ and CD4+ T-cell populations. Dot plots showing HLA-DR+ CD38+ coexpression in CM (A and B) and TEMRA (C and D) subsets of CD8+ and CD4+ T cells and also on total CD8+ and CD4+ T-cell populations (E and F). CM, Central memory; ns, nonsignificant.
Fig E7
Fig E7
Quantitation of T-cell perturbations among different patient cohorts. (A) Plots showing ratio of CD8+ EM vs naive compartment and (B) CD4+ vs CD8+ ratio in different patient cohorts. Dot plots showing frequencies of CD8+ and CD4+ TEMRA populations (C and D). Plots showing percentage coexpression of PD-1+ and Tim3+ (E and F) and expression of CD57+ in the EM compartment of CD8+ and CD4+ T cells (G and H) in HCs (n = 22) and COVID-19 (n = 24), HLH (n = 6), MIS-C (n = 69), and MIS-C follow-up (n = 31) patients. ns, Nonsignificant.
Fig E8
Fig E8
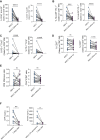
Follow-up analysis of patients with MIS-C displays decrease in activation, exhaustion, and senescence markers on T cells along with improvement in clinical markers of inflammation. A-E, Dot plots showing paired analysis of different states of T cells and its subsets in patients with MIS-C at onset and follow-up (n = 18). F, Paired analysis of patients with MIS-C showing levels of CRP and ferritin at patient admission and 7 days postadmission. ns, Nonsignificant.
FIG E9
FIG E9
Quantitation of BNP and troponin levels in MIS-C and COVID-19. Plots showing serum levels of BNP (A) and troponin (B) in patients with COVID-19 (n = 15) and patients with MIS-C (n = 69). Based on % optimal threshold value of CD8+ T activation, patients with MIS-C and patients with COVID-19 were categorized into 2 groups having low (<15.9%) and high CD8+ (>15.9%) EM T-cell activation. Dot plots showing differences between BNP (C) and troponin (D) levels in groups having low and high CD8+ T-cell activation. Act., Activation.
Fig E10
Fig E10
Correlation of laboratory features and immune markers in MIS-C and COVID-19. Correlation matrix showing positive and inverse correlations between different laboratory and immune parameters in patients with COVID-19 (n = 13) and patients with MIS-C (n = 40). Positive correlation is shown as blue-colored circles, whereas inverse correlation is shown in red-colored circles. Size and intensity of colored circles show the strength of correlation. Only significant correlations with P less than .05 are shown as colored circles. ALC, Absolute lymphocyte count; ALT, alanine transaminase; ANC, absolute neutrophil count; WBC, white blood cell.

References

    1. Feldstein L.R., Rose E.B., Horwitz S.M., Collins J.P., Newhams M.M., Son M.B.F., et al. Multisystem inflammatory syndrome in U.S. children and adolescents. N Engl J Med. 2020;383:334–346. - PMC - PubMed
    1. Brodin P. Why is COVID-19 so mild in children? Acta Paediatr. 2020;109:1082–1083. - PubMed
    1. Payne A.B., Gilani Z., Godfred-Cato S., Belay E.D., Feldstein L.R., Patel M.M., et al. Incidence of multisystem inflammatory syndrome in children among US persons infected with SARS-CoV-2. JAMA Netw Open. 2021;4 - PMC - PubMed
    1. Riphagen S., Gomez X., Gonzalez-Martinez C., Wilkinson N., Theocharis P. Hyperinflammatory shock in children during COVID-19 pandemic. Lancet. 2020;395:1607–1608. - PMC - PubMed
    1. Jiang L., Tang K., Levin M., Irfan O., Morris S.K., Wilson K., et al. COVID-19 and multisystem inflammatory syndrome in children and adolescents. Lancet Infect Dis. 2020;20:e276–e288. - PMC - PubMed

Publication types

Supplementary concepts