. 2022 Jun;149(6):2062-2077.
doi: 10.1016/j.jaci.2022.02.025. Epub 2022 Mar 15.

Single-cell RNA sequencing of mast cells in eosinophilic esophagitis reveals heterogeneity, local proliferation, and activation that persists in remission

Affiliations

Single-cell RNA sequencing of mast cells in eosinophilic esophagitis reveals heterogeneity, local proliferation, and activation that persists in remission

Netali Ben-Baruch Morgenstern et al. J Allergy Clin Immunol. 2022 Jun.

Abstract

Background: Mast cells (MCs) are pleiotropic cells that accumulate in the esophagus of patients with eosinophilic esophagitis (EoE) and are thought to contribute to disease pathogenesis, yet their properties and functions in this organ are largely unknown.

Objectives: This study aimed to perform a comprehensive molecular and spatial characterization of esophageal MCs in EoE.

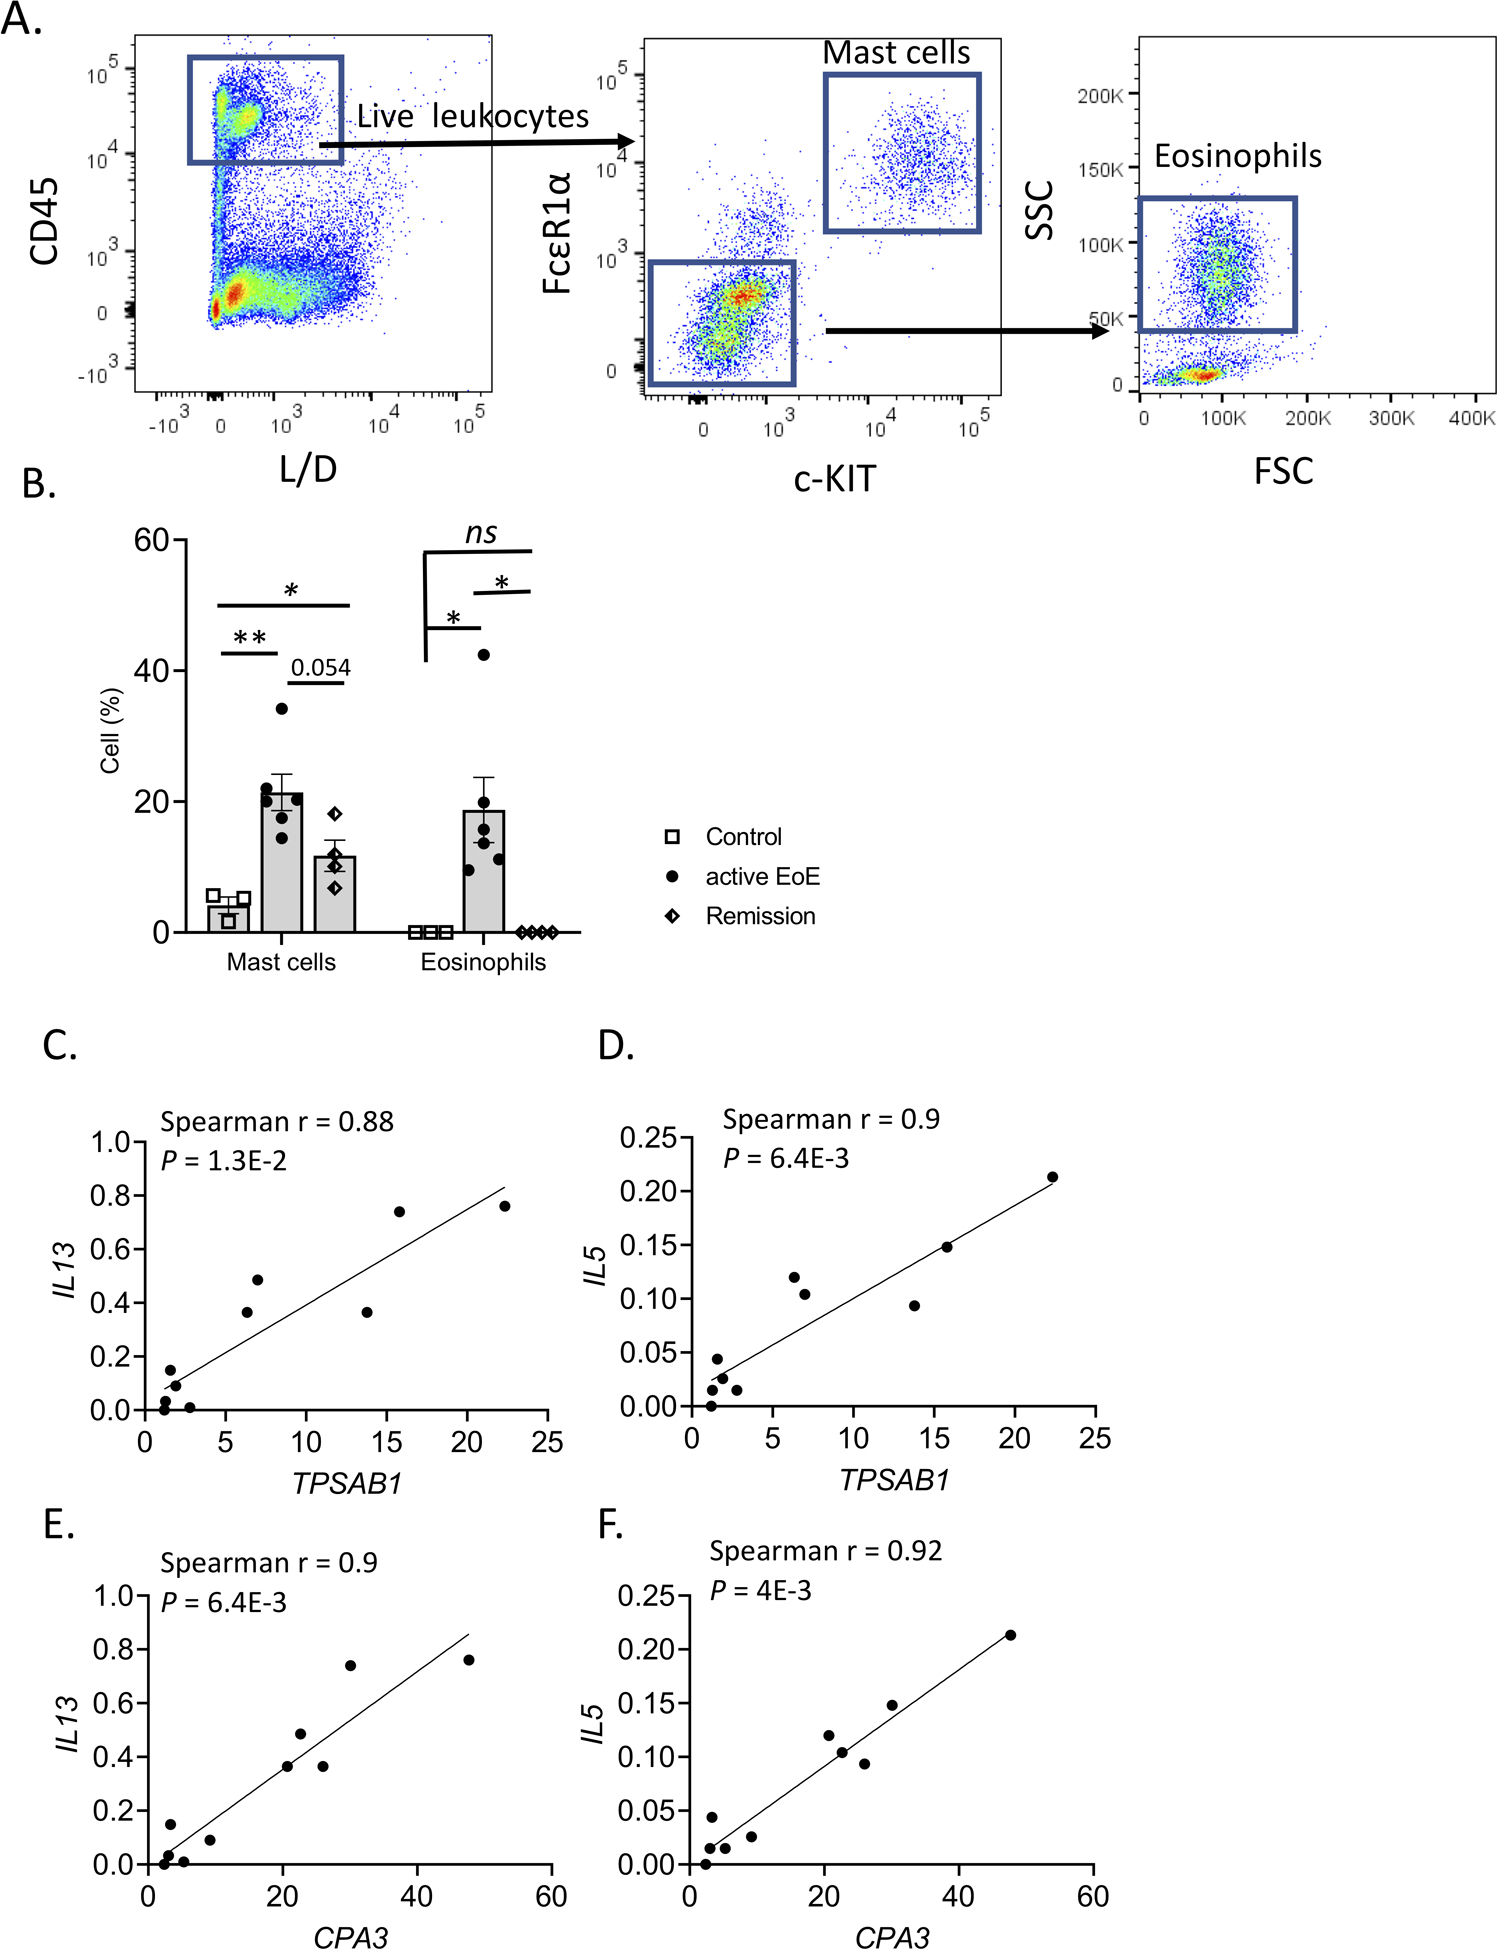
Methods: Esophageal biopsies obtained from patients with active EoE, patients with EoE in histologic remission, and individuals with histologically normal esophageal biopsies and no history of esophageal disease (ie, control individuals) were subject to single-cell RNA sequencing, flow cytometry, and immunofluorescence analyses.

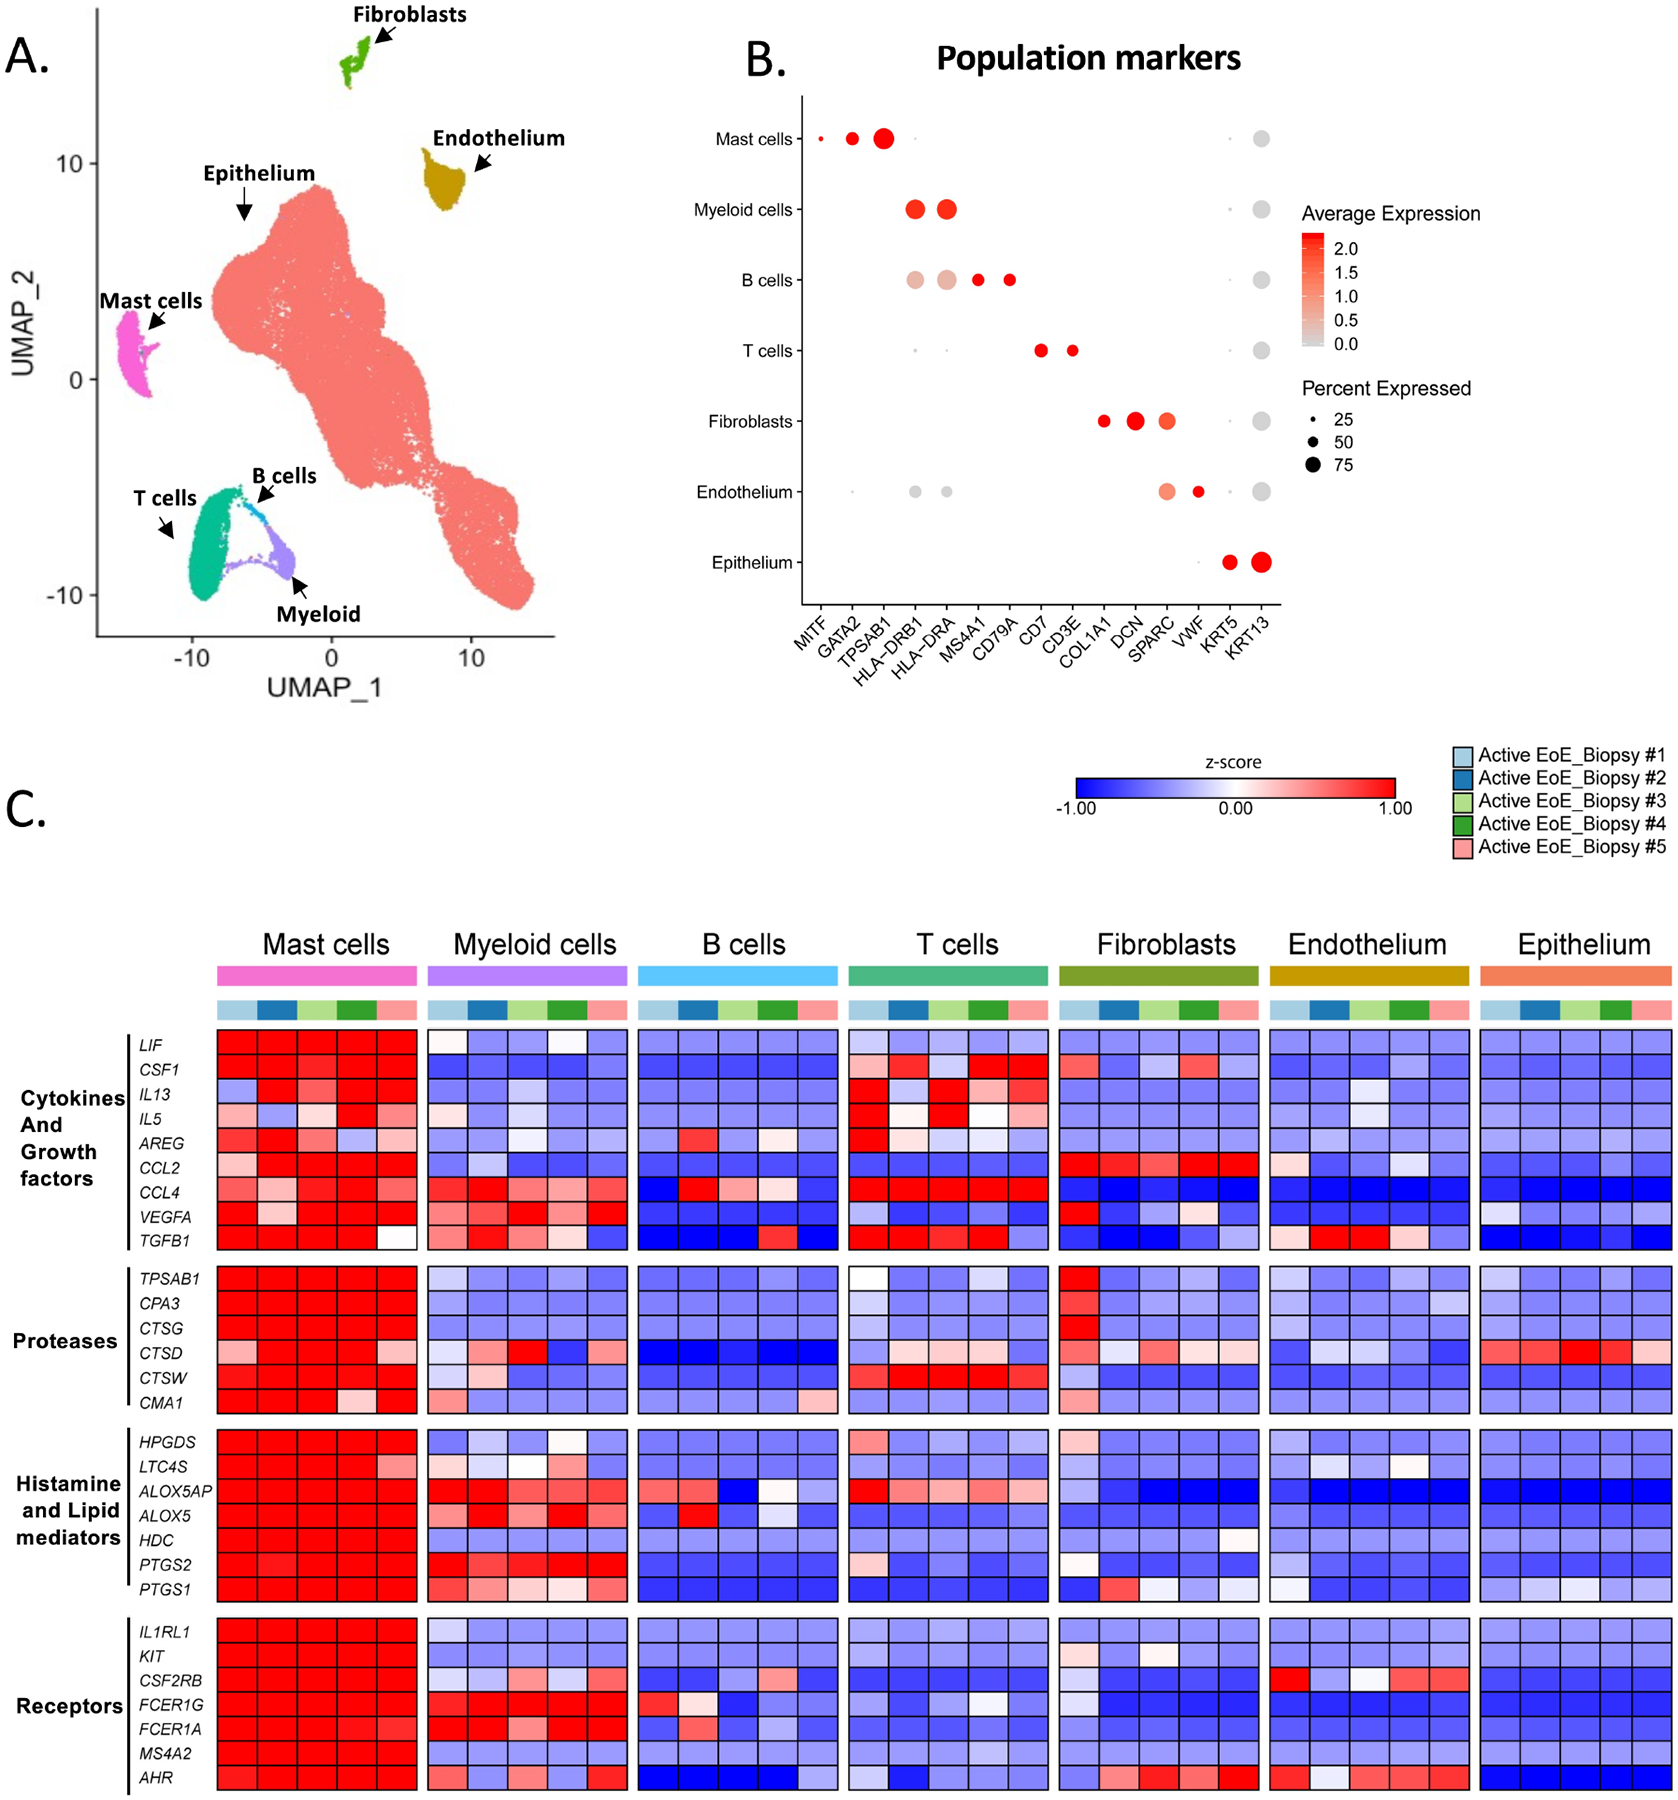
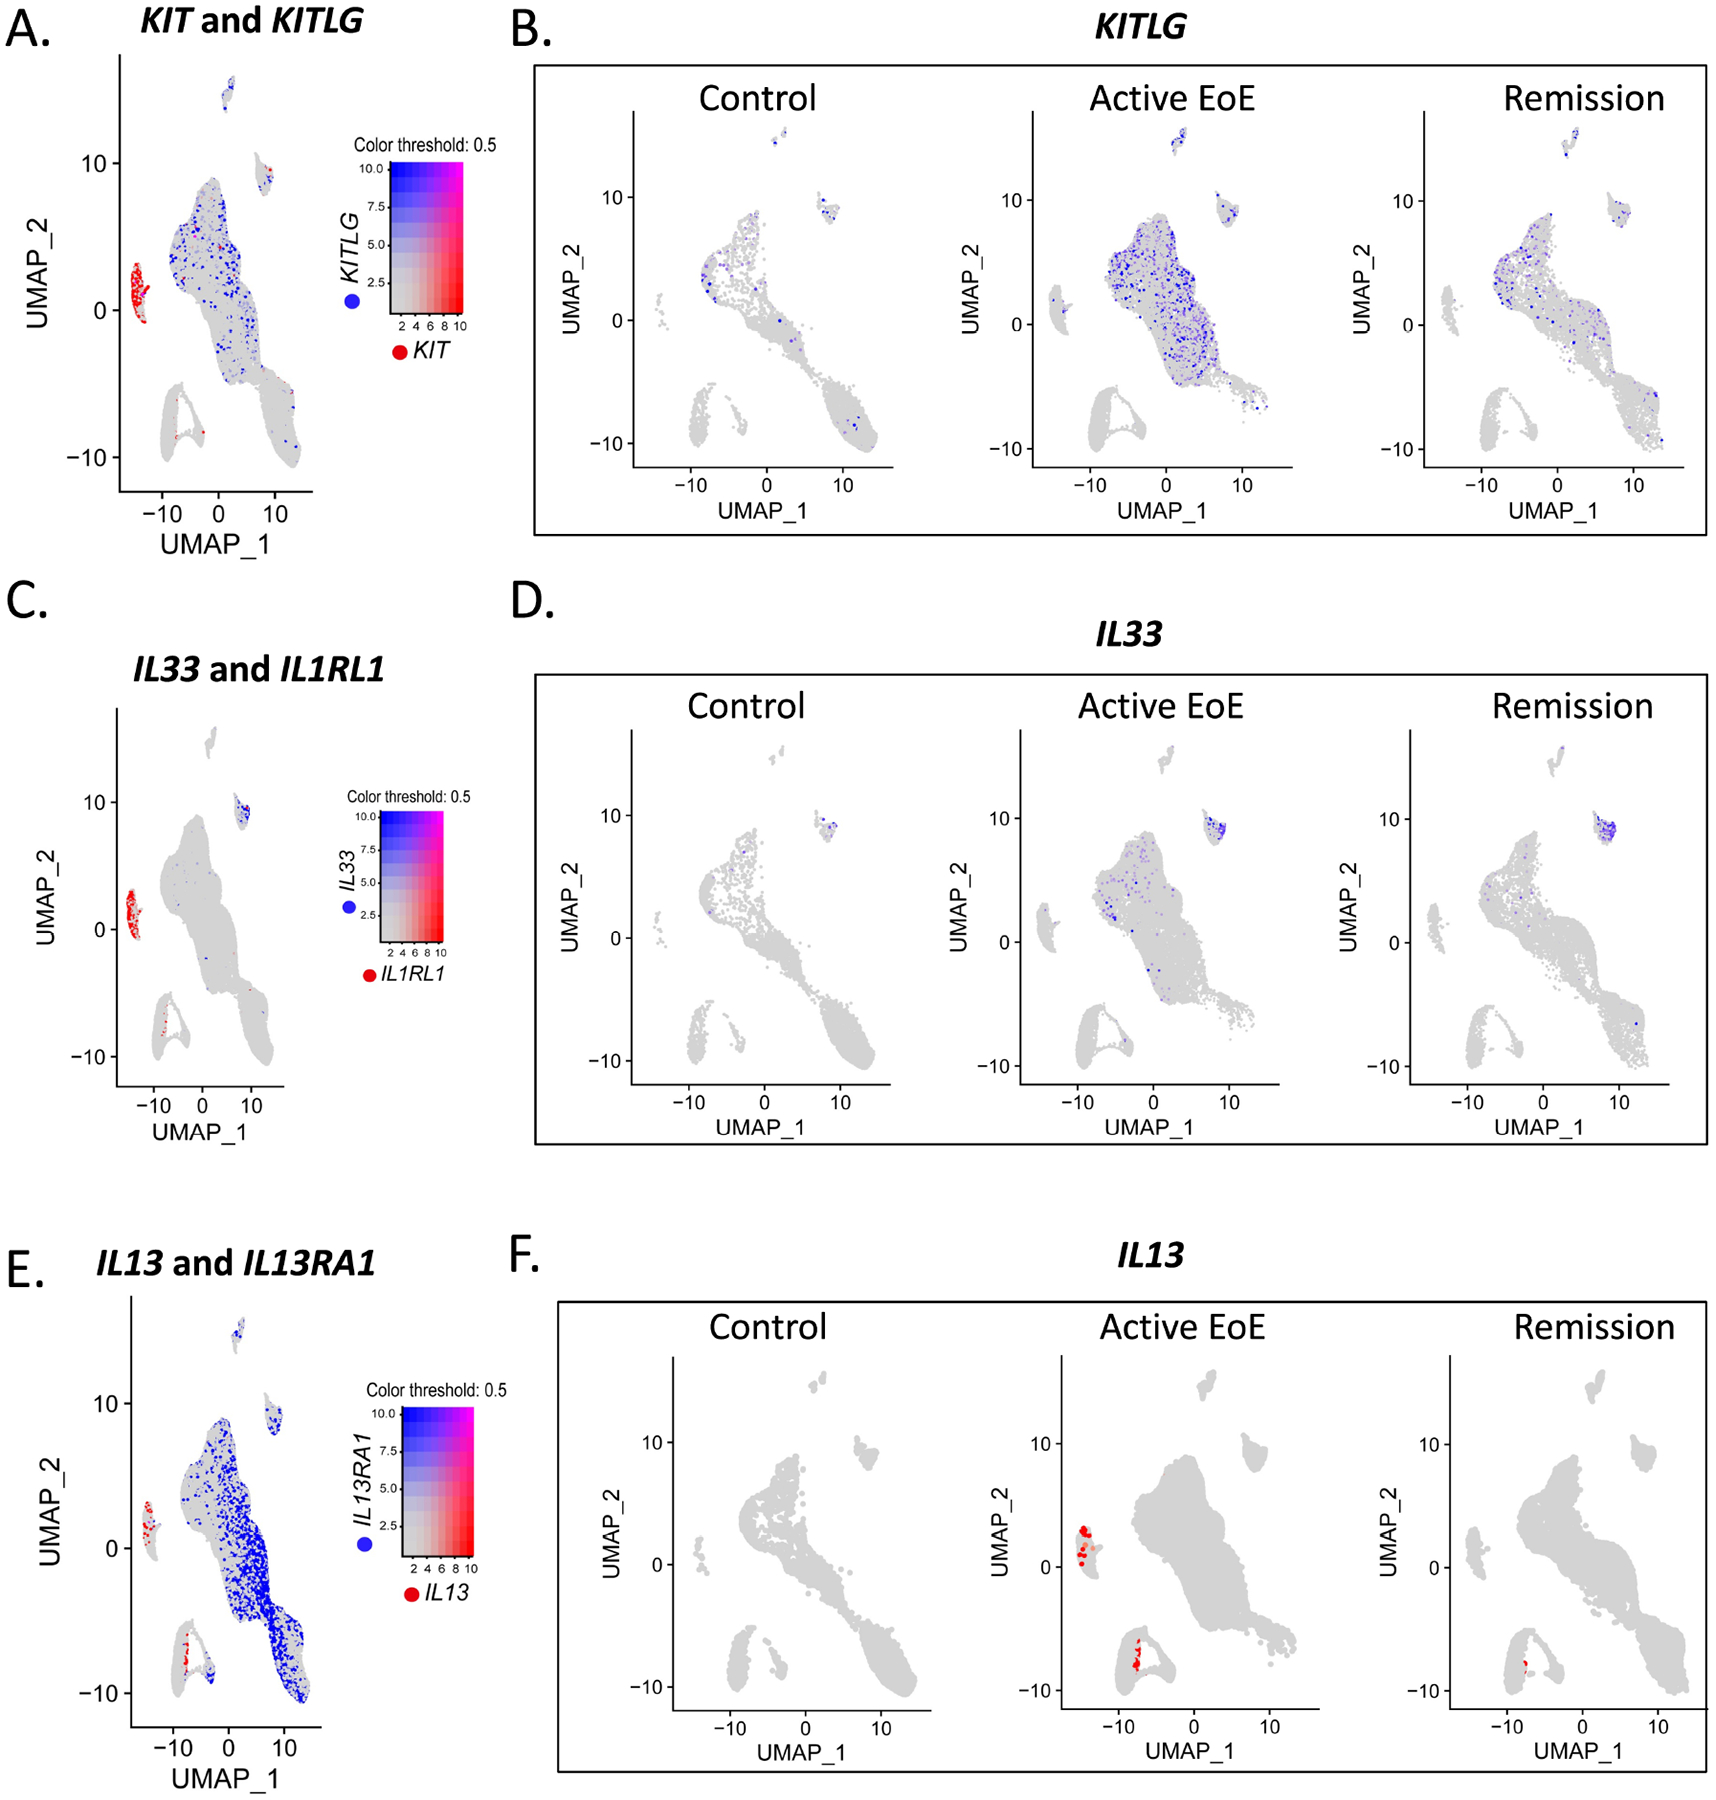
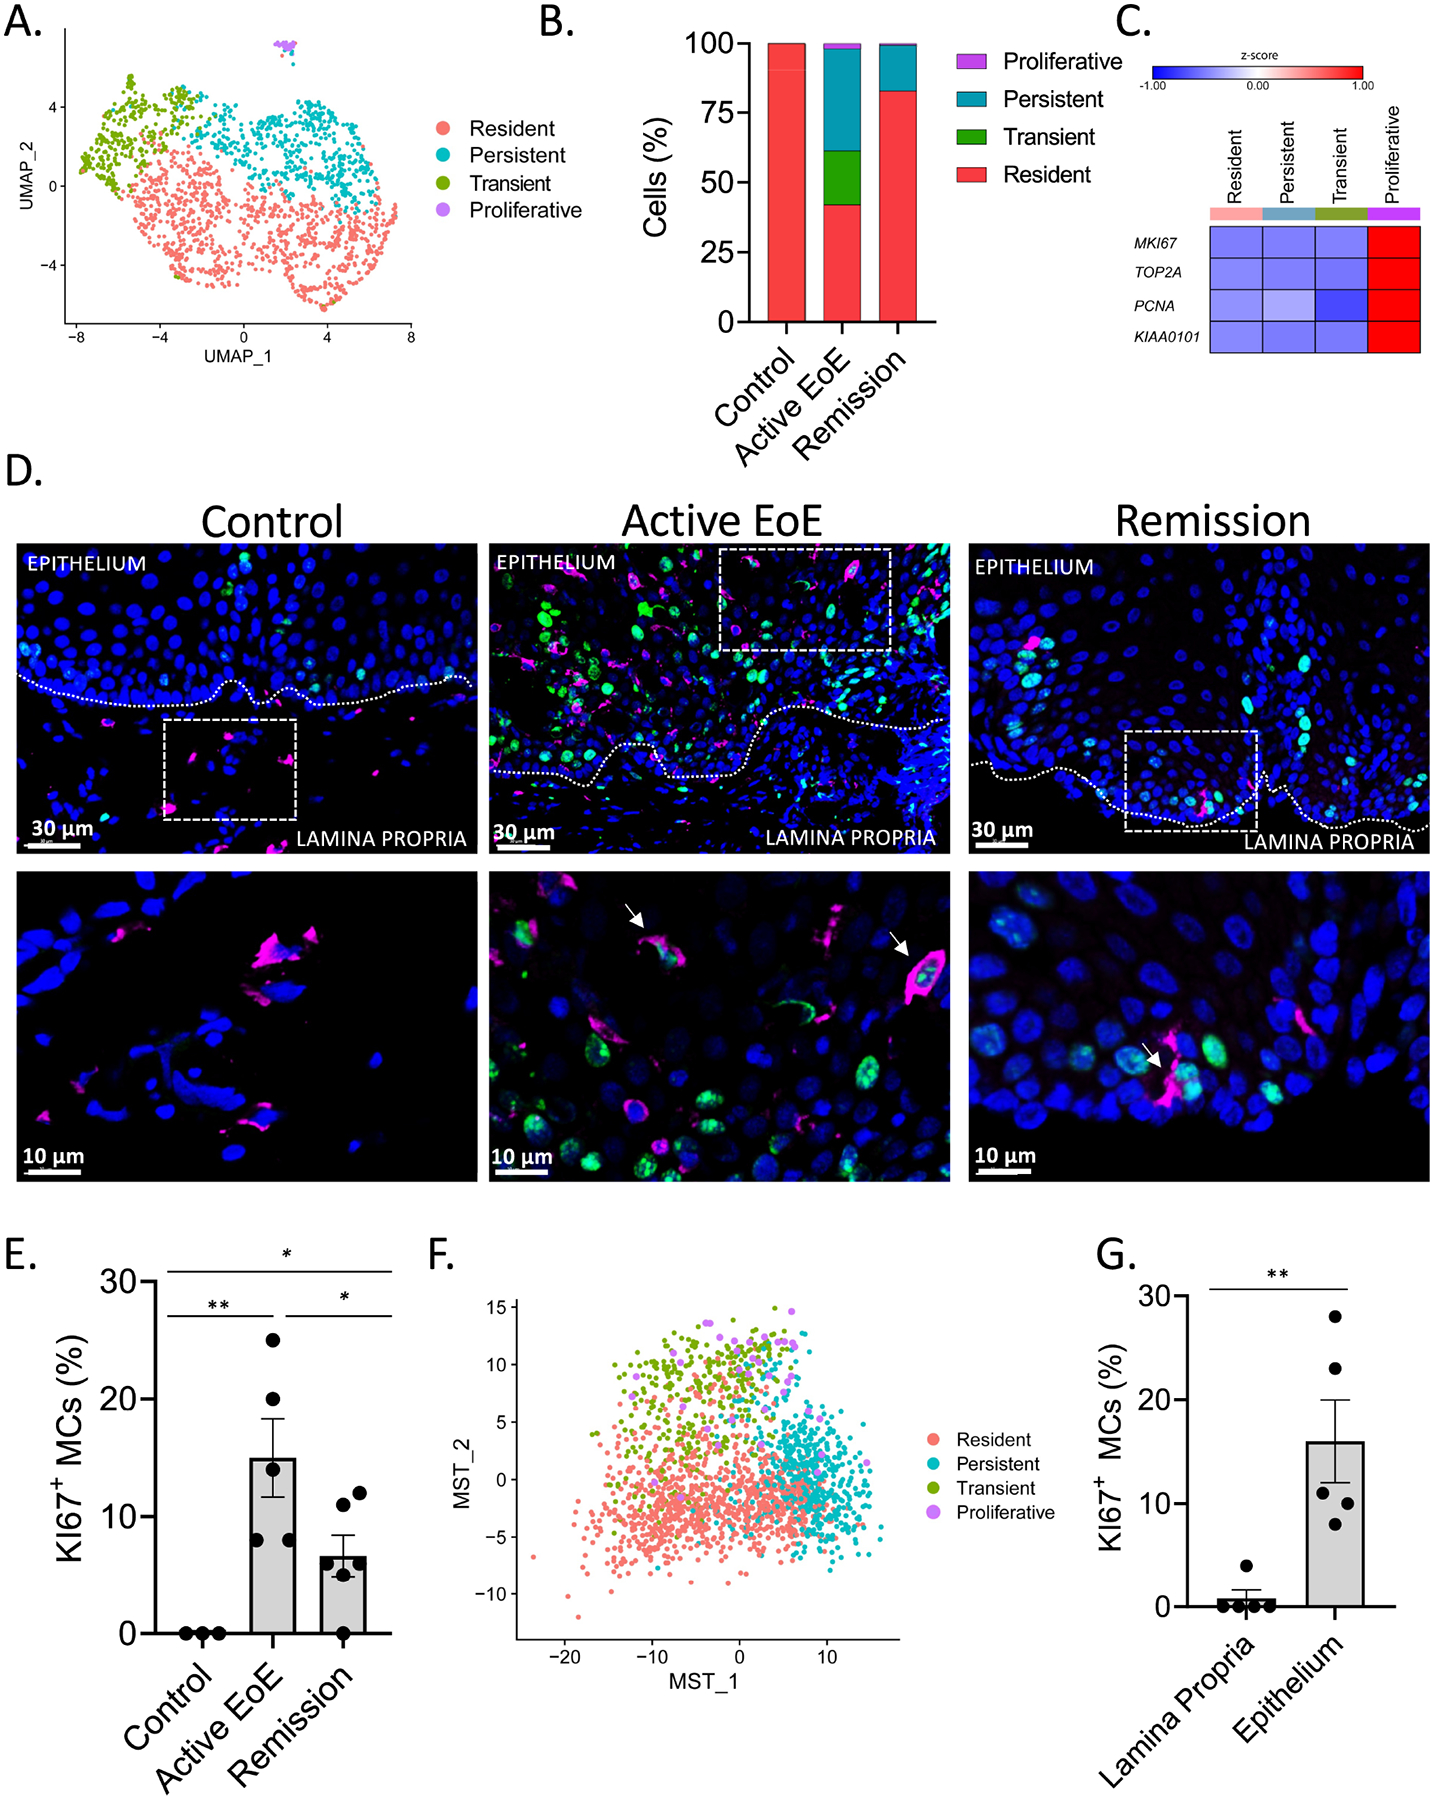
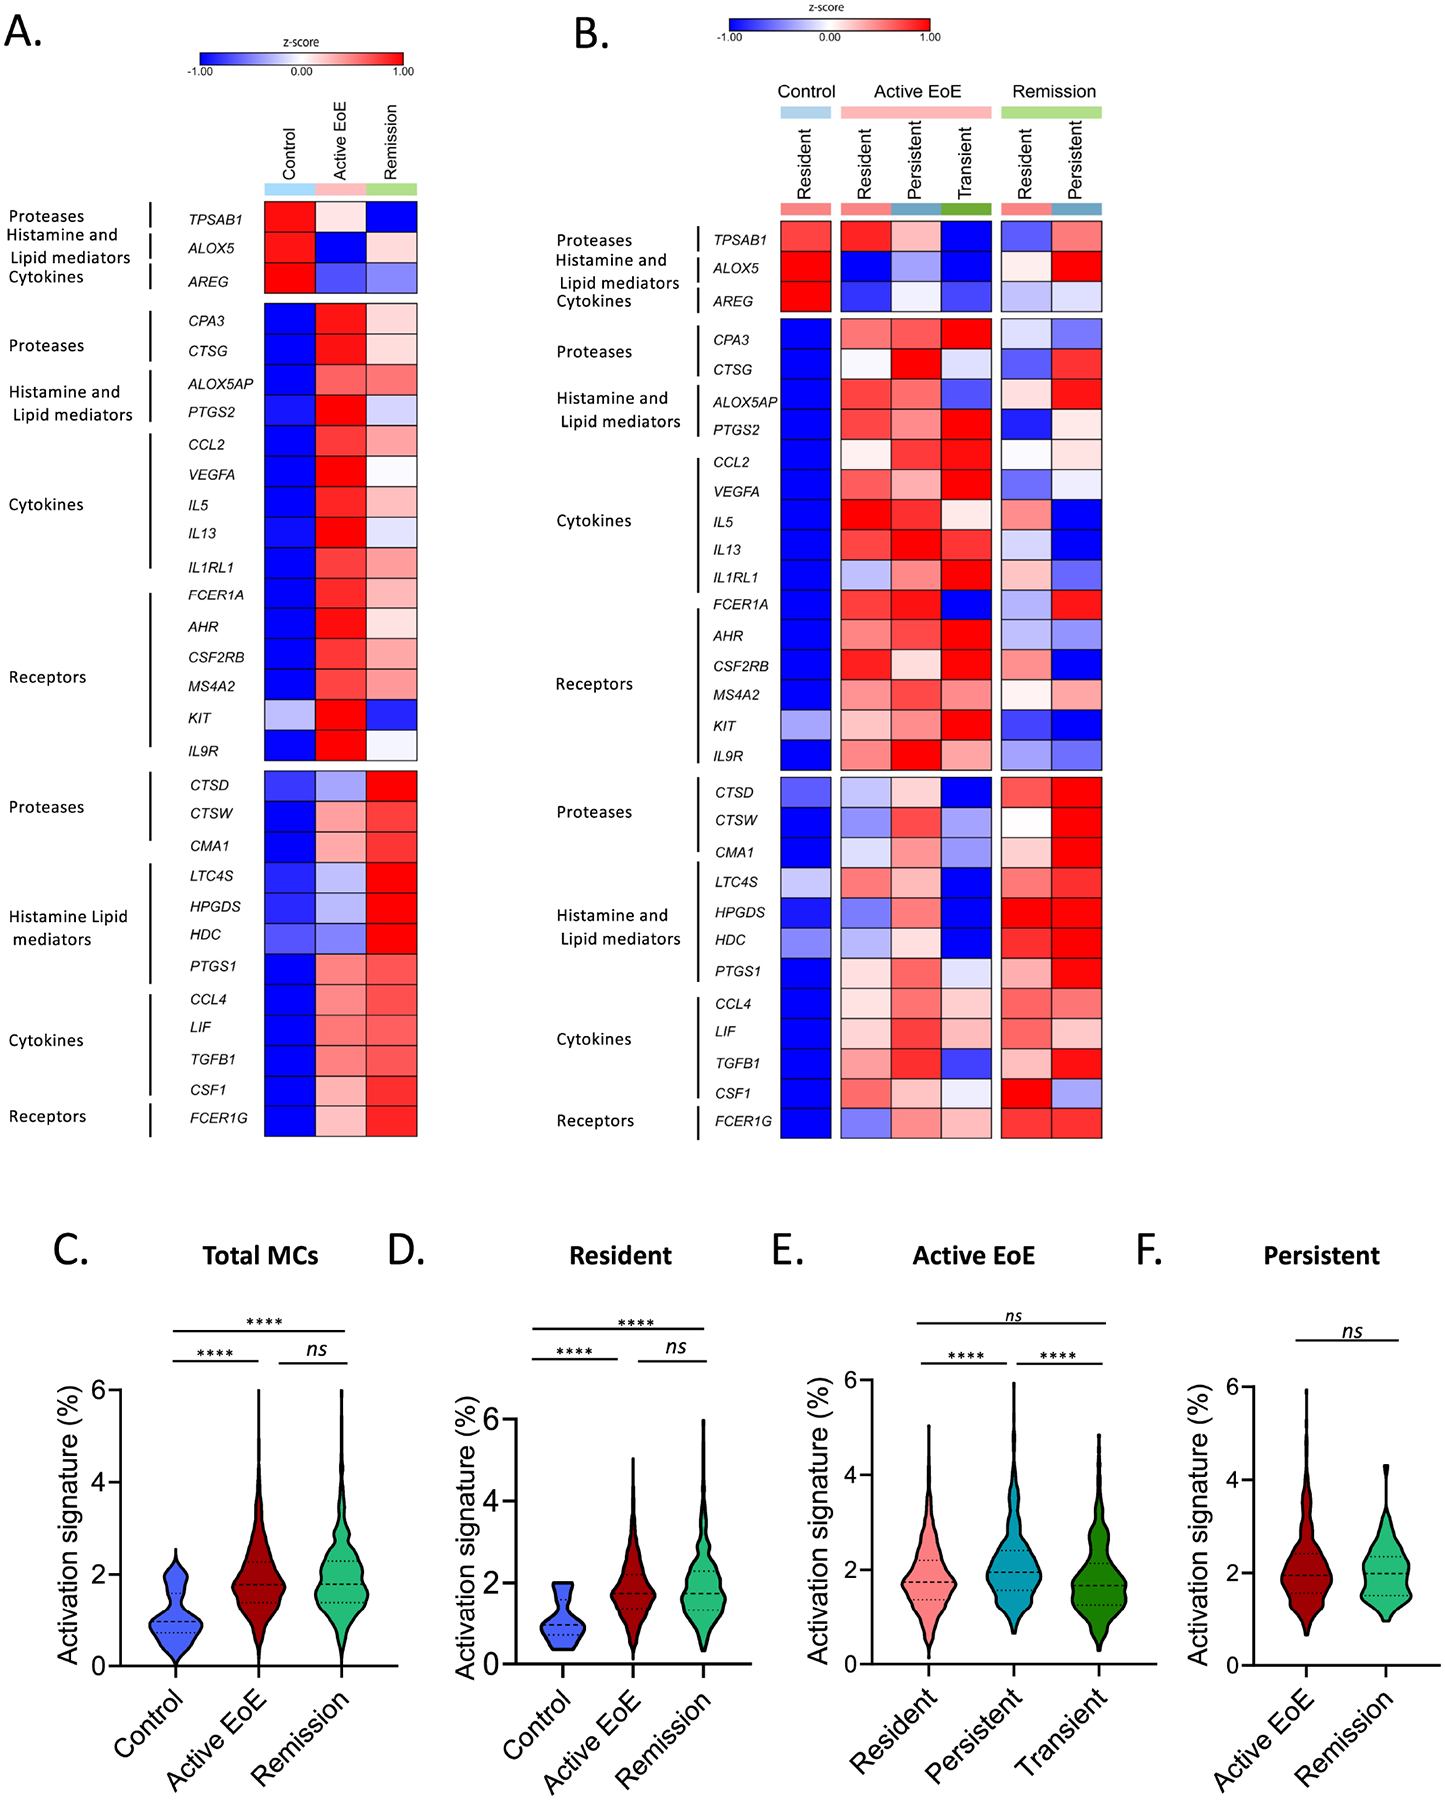
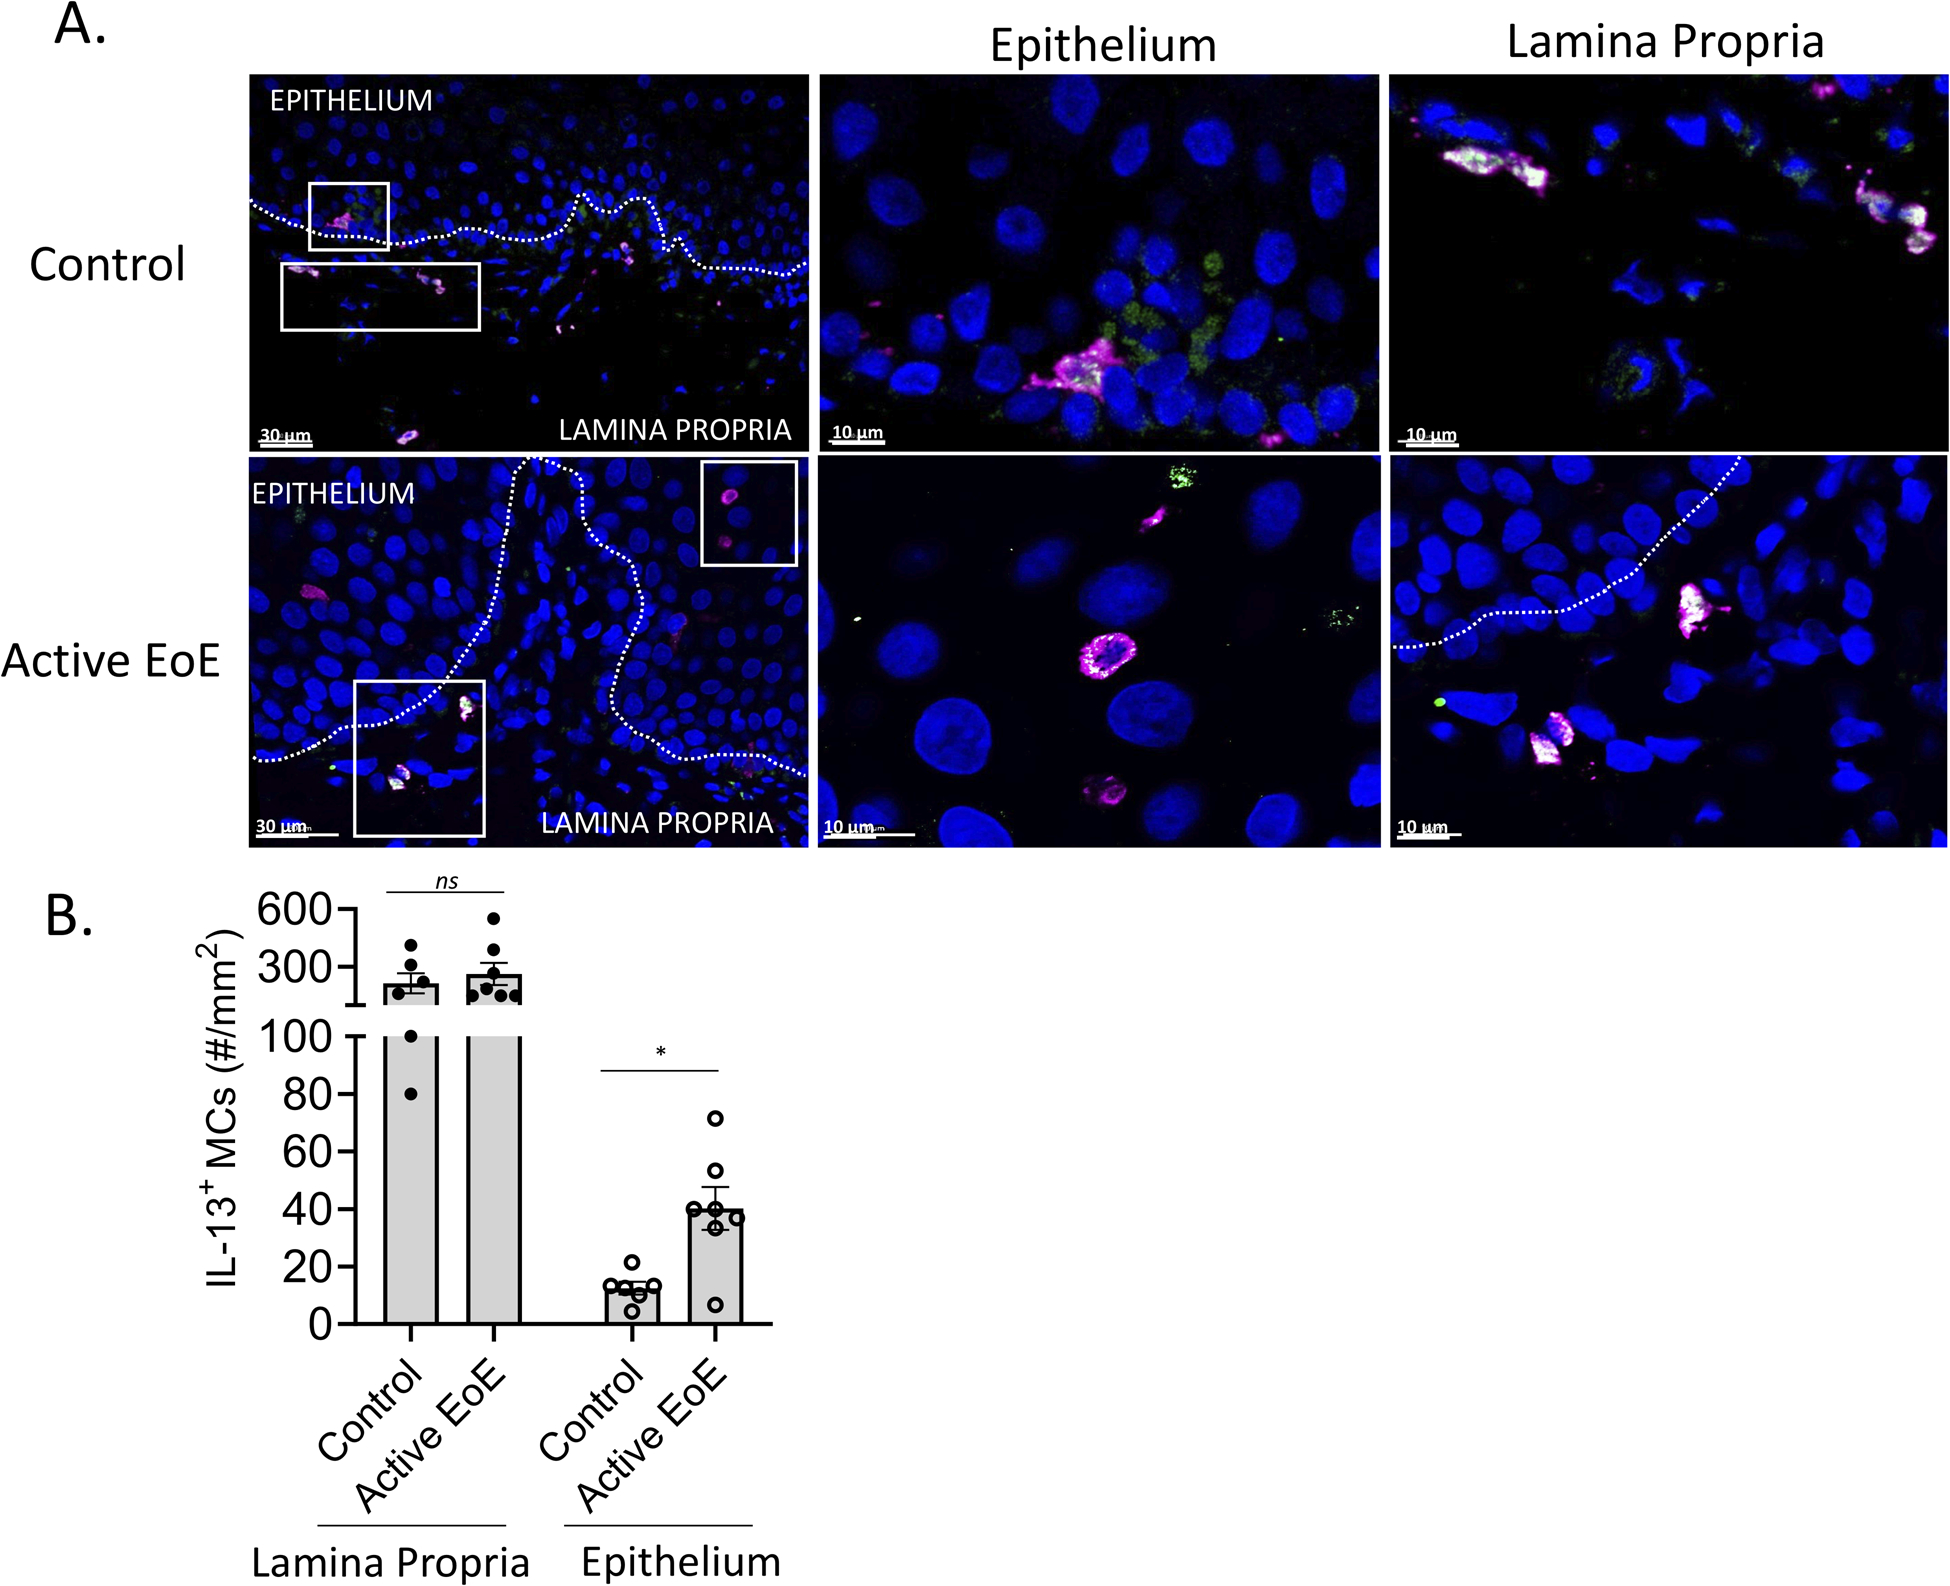
Results: This study probed 39,562 single esophageal cells by single-cell RNA sequencing; approximately 5% of these cells were MCs. Dynamic MC expansion was identified across disease states. During homeostasis, TPSAB1highAREGhigh resident MCs were mainly detected in the lamina propria and exhibited a quiescent phenotype. In patients with active EoE, resident MCs assumed an activated phenotype, and 2 additional proinflammatory MC populations emerged in the intraepithelial compartment, each linked to a proliferating MKI67high cluster. One proinflammatory activated MC population, marked as KIThighIL1RL1highFCER1Alow, was not detected in disease remission (termed "transient MC"), whereas the other population, marked as CMA1highCTSGhigh, was detected in disease remission where it maintained an activated state (termed "persistent MC"). MCs were prominent producers of esophageal IL-13 mRNA and protein, a key therapeutic target in EoE.

Conclusions: Esophageal MCs comprise heterogeneous populations with transcriptional signatures associated with distinct spatial compartmentalization and EoE disease status. In active EoE, they assume a proinflammatory state and locally proliferate, and they remain activated and poised to reinitiate inflammation even during disease remission.

Keywords: Eosinophilic esophagitis; IL-13; mast cells; proliferation; single-cell RNA sequencing.


Figures

Figure 1:
Figure 1:. MC levels by EoE disease state and association with EoE cytokine milieu
A–B A cohort of esophageal tissue (control, n = 3; EoE, n = 6; EoE remission, n = 4) was processed to obtain a single-cell suspension. Cells were stained and analyzed via flow cytometry to identify mast cells (MCs) (CD45highc-KIThighFcεRIα high); (A) the gating strategy is shown, and the L/D X-axis label represents staining for live/dead cells. (B) The percentage of mast cells and eosinophils out of the total white blood cell population (CD45high) is graphed. Individual markers represent distinct individuals, and bars represent mean ± SEM, which was analyzed using a t-test for mean comparison between two groups; **, P < 0.01 *, P < 0.05; ns, not significant. C–F Spearman correlation of mast cell markers (TPSAB1 and CPA3) with key gene expression levels (IL13 and IL5) and comparison to other immunocyte markers in active EoE. Individual markers represent distinct individuals. Data are derived from bulk RNA sequencing of patients with active EoE (n = 10), as reported, . P-value Bonferroni-Dunn’s correction was calculated for each correlation.
Figure 2:
Figure 2:. esophageal MC identification and characterization by scRNA-seq
A–B Examination of esophageal cell populations on the basis of gene expression. (A) Results were analyzed using an experimental workflow that led to a uniform manifold approximation and projection (UMAP) plot for dimension reduction displaying 39,562 single cells. The plot is colored by cell types derived from the shared nearest neighbor (SNN) clustering and enriched marker genes. Red, epithelium; yellow, endothelium; green, fibroblasts; magenta, mast cells (MCs); turquoise, T cells; light blue, B cells; and purple, myeloid cells. (B) A dot plot of marker genes for indicated cell types is shown. C Heatmap of MC–enriched genes for proteases, histamine and lipid mediator related, cytokines and growth factors and receptors in the 5 active EoE donors. The map’s color for each gene is proportional to the average per-cell gene expression within the given patient in the esophageal cell populations. MCs were isolated from esophageal biopsies derived from patients with active EoE (n = 5) or remission EoE (n = 3) and non-EoE controls (n = 2).
Figure 3:
Figure 3:. EoE-associated MCs axes
A–F Examination of mast cells (MC) potential interaction with other esophageal cell populations in cellular networking. Feature plot analyses of EoE hallmarked genes of the scRNA-seq of the ten biopsies obtained from patients with active EoE (n = 5), remission EoE (n = 3), and non-EoE controls (n = 2). Feature plots of co-expression of the key type 2 cytokines and the compatible receptors in MCs (red) and other esophageal cell population(s) (blue) (A, C, E) and feature plots split by diagnosis (B, D, F) are presented.
Figure 4:
Figure 4:. Esophageal MC populations across the diagnostic spectrum
A–C, F Examination of esophageal mast cell (MC) populations on the basis of gene expression. Esophageal biopsies were subjected to scRNA-seq. (A) Results were analyzed using an experimental workflow leading to a UMAP plot of 1,897 single mast cells (n = 10 samples) that were subsetted and reclustered from the total esophageal single cells (39,562 cells) colored by SNN clustering. Red, resident; green, transient; turquoise, persistent; and magenta, proliferative. (B) The stacked bar graph shows a given mast cell subpopulation as a percentage of the total mast cells in each sample. (C) Heatmap of proliferation marker genes; (F) MST plot of pseudotime analysis reclustered and organized mast cell populations on the basis of genetic similarity, colored by the original SNN clusters. A, F Individual markers represent individual cells. D–E, G A separate cohort of esophageal tissue (active EoE, n = 5; remission, n = 6; control, n = 3) was subject to immunofluorescent staining for tryptase (magenta), as a marker of MCs, and KI67 (green), as a marker of proliferation. Representative pictures (D) and quantification of the percentage of KI67+ MC in the entire esophageal biopsy of all patients (E) and specifically in the epithelial and lamina propria in esophageal biopsies of patients with active EoE (G) are being shown in magnifications of 20X (D, upper row) and 100X (D lower row, magnified area of 20X indicated by dashed line boxes). D, double-positive cells for tryptase and KI67 depicted by the arrows E, G Individual markers represent distinct individuals, and bars represent mean ± SEM, which was analyzed using the t-test for comparison between each two groups. *, P < 0.05, **, P < 0.01.
Figure 5:
Figure 5:. Characterization of the diversity of esophageal MC populations
A–F Examination of esophageal mast cell (MC) populations on the basis of gene expression. Heatmaps of enriched marker gene expression in the entire MC population (A) and divided by MC subpopulations (B) as a function of the disease state. The map’s color for each gene is proportional to the average per-cell gene expression within the given MC population. Violin plots indicate the percentage of genes out of the total gene number included in the activation signature expressed by the MC population as a whole (C), the resident population in each diagnostic state (D), all MC populations/cluster present in active EoE (E), and the persistent population in EoE compared to remission (F). Bars represent mean ± SEM, which were analyzed using one-way ANOVA with Tukey post-test; ns = not significant, ****, P ≤ 0.0001.
Figure 6:
Figure 6:. Examination of MC IL-13 protein expression
A–B A cohort of esophageal tissue (control, n = 6; active EoE, n = 7) was subject to immunofluorescent staining of tryptase (magenta) as a marker of mast cells (MCs) and IL-13 (green). (A) Representative pictures from control and active EoE are shown in magnification of 20X (left panels) and 40X (epithelium middle panel and lamina propria right panel). Dashed line boxes represent the magnified area in epithelium and lamina propria, respectively. Double positive staining display as a combination of magenta and green, generating white staining. (B) Quantification of IL-13+ MC numbers per mm2 in the lamina propria and epithelial layers. B Bars represent mean ± SEM, which were analyzed using the t-test; *, P < 0.05, ns = not significant.

References

    1. Richter JE. Endoscopic Treatment of Eosinophilic Esophagitis. Gastrointest Endosc Clin N Am 2018; 28:97–110. - PubMed
    1. Schoepfer AM, Straumann A, Safroneeva E. Pharmacologic Treatment of Eosinophilic Esophagitis: An Update. Gastrointest Endosc Clin N Am 2018; 28:77–88. - PubMed
    1. Schoepfer AM, Gonsalves N, Bussmann C, Conus S, Simon HU, Straumann A, et al. Esophageal dilation in eosinophilic esophagitis: effectiveness, safety, and impact on the underlying inflammation. Am J Gastroenterol 2010; 105:1062–70. - PubMed
    1. Gonsalves NP, Aceves SS. Diagnosis and treatment of eosinophilic esophagitis. J Allergy Clin Immunol 2020; 145:1–7. - PMC - PubMed
    1. Furuta GT, Katzka DA. Eosinophilic Esophagitis. N Engl J Med 2015; 373:1640–8. - PMC - PubMed

Publication types