. 2022 Jun:60:101472.
doi: 10.1016/j.molmet.2022.101472. Epub 2022 Mar 15.

A novel role for GalNAc-T2 dependent glycosylation in energy homeostasis

Affiliations

A novel role for GalNAc-T2 dependent glycosylation in energy homeostasis

Cristy R C Verzijl et al. Mol Metab. 2022 Jun.

Abstract

Objective: GALNT2, encoding polypeptide N-acetylgalactosaminyltransferase 2 (GalNAc-T2), was initially discovered as a regulator of high-density lipoprotein metabolism. GalNAc-T2 is known to exert these effects through post-translational modification, i.e., O-linked glycosylation of secreted proteins with established roles in plasma lipid metabolism. It has recently become clear that loss of GALNT2 in rodents, cattle, nonhuman primates, and humans should be regarded as a novel congenital disorder of glycosylation that affects development and body weight. The role of GALNT2 in metabolic abnormalities other than plasma lipids, including insulin sensitivity and energy homeostasis, is poorly understood.

Methods: GWAS data from the UK Biobank was used to study variation in the GALNT2 locus beyond changes in high-density lipoprotein metabolism. Experimental data were obtained through studies in Galnt2-/- mice and wild-type littermates on both control and high-fat diet.

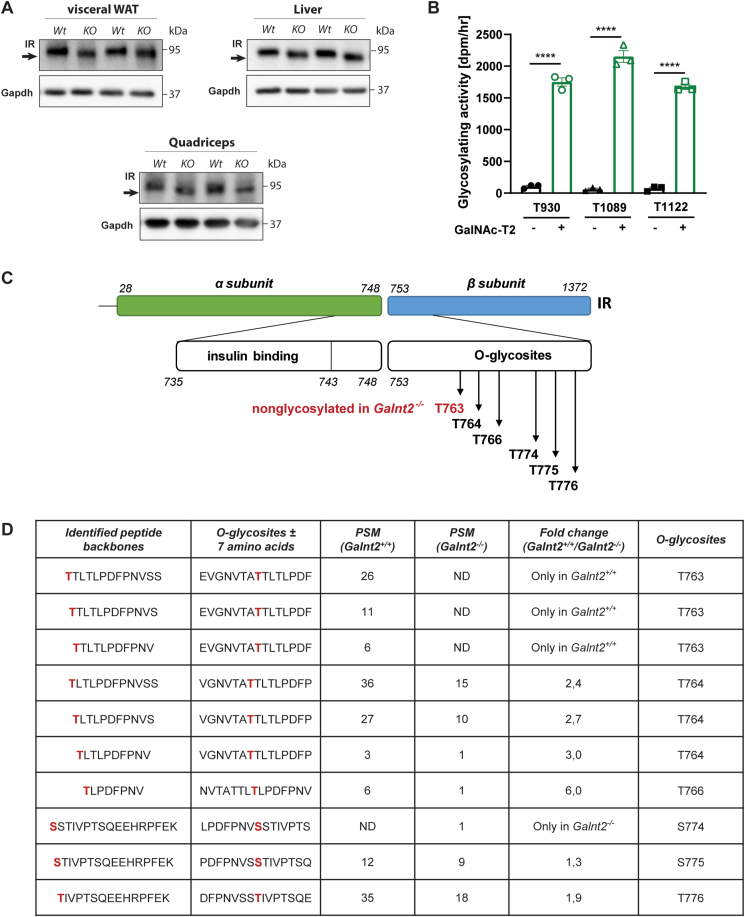
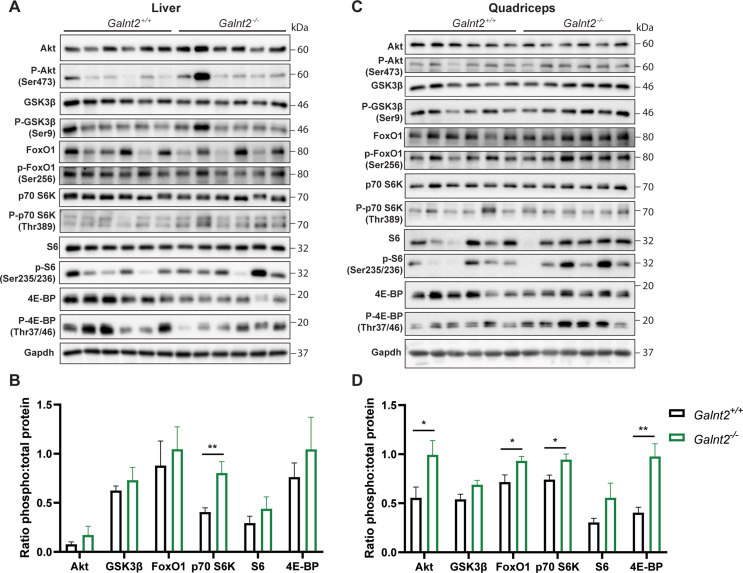
Results: First, we uncovered associations between GALNT2 gene variation, adiposity, and body mass index in humans. In mice, we identify the insulin receptor as a novel substrate of GalNAc-T2 and demonstrate that Galnt2-/- mice exhibit decreased adiposity, alterations in insulin signaling and a shift in energy substrate utilization in the inactive phase.

Conclusions: This study identifies a novel role for GALNT2 in energy homeostasis, and our findings suggest that the local effects of GalNAc-T2 are mediated through posttranslational modification of the insulin receptor.

Keywords: Adipose tissue; Energy metabolism; Genetic disorder; Glycosylation; Insulin signaling.


Figures

Figure 1
Figure 1
GALNT2 SNP rs4846914 is associated with plasma lipids and body fat percentage. Phenotypes associated with rs4846914 versus –log10 (P value) of traits and biomarkers of rs4846914 carriers. (A) Overall phenotype versus –log10 (P value) of traits and biomarkers of rs4846914 carriers. (B) Phenotype versus –log10 (P value) ranging from 0.0 to 10.0. Shown in (A) and (B) are the direction of effects (beta_meta) and p-value threshold and a dotted line indicating the significant threshold for multiple testing of p = 3.21E-04.
Figure 2
Figure 2
Galnt2−/−mice are smaller and exhibit a GALNT2-CDG like phenotype. Male Galnt2−/− mice and wild-type littermates were followed on a control diet (CD) whereby (A) body weight, (B) body weight gain and (C) body composition was monitored (n = 8–9). Male Galnt2−/− mice and wild-type littermates at 12 weeks of age were followed on a high-fat diet (HFD) whereby (D) body weight, (E) body weight gain and (F) body composition was monitored (n = 9–10). (G) Body length (n = 8–10) and (H) tibia length (n = 8–10) along with photographic representations of (I) the body and (J) head of a Galnt2−/− mouse and wild-type littermate (Galnt2+/+). The experiments on control diet were repeated 3 times (A-C), and on HFD 2 times (D-F), (G-J) was determined in one cohort, but the effect was also observed in all other cohorts. Data are presented as mean values ± SEM with ∗p < 0.05, ∗∗p < 0.01, ∗∗∗p < 0.001, ∗∗∗∗p < 0.0001.
Figure 3
Figure 3
Galnt2−/−mice display reduced quadriceps and visceral WAT weight and visceral WAT adipocyte size. Metabolic organs were dissected from mice on a control diet after fasting for 4 h. (A) Liver weight, (B) liver-to-body weight ratio, (C) Quadriceps weight, (D) Quadricep-to-body weight ratio, (E) visceral WAT weight, (F) visceral WAT-to-body weight ratio, (G) subcutaneous WAT and (H) subcutaneous WAT-to-body weight ratio, (I) interscapular BAT and (J) interscapular BAT-to-body weight ratio is shown (n = 6–9, similar results obtained among three cohorts). (K) Adipocyte size quantification shown as relative adipocyte size (n = 5–8, size measures based on pixels). (L) H&E staining of visceral WAT slides from wild-type and Galnt2−/− mice (representative images from n = 5–8). Data are presented as mean values ± SEM with ∗p < 0.05, ∗∗p < 0.01, ∗∗∗∗p < 0.0001.
Figure 4
Figure 4
Glucose tolerance and insulin signaling in Galnt2−/−mice. (A) Fasting plasma glucose and (B) insulin levels (n = 8–9). Wild-type and Galnt2−/− mice on a control diet were fasted for 6 h followed by an intraperitoneal administration of glucose (2  g/kg of body weight) to assess (C) glucose tolerance and (D) the corresponding AUC (n = 9). Wild-type and Galnt2−/− mice were fasted for 6 h followed by an intraperitoneal administration of insulin (0.75 U/kg of body weight) to assess (E) insulin tolerance and (F) the corresponding AUC (n = 9). (G) Insulin signaling in visceral WAT was assessed by immunoblotting the insulin receptor (IR) with the arrow indicating a shift in molecular weight, P-Akt S473 and Akt after insulin stimulation for 0, 5 and 15 min and (H) quantified (n = 3). Data are presented as mean values ± SEM with ∗p < 0.05, ∗∗p < 0.01.
Figure 5
Figure 5
The insulin receptor is novel target of GalNAc-T2 mediated O-glycosylation. (A) The insulin receptor (IR) was immunoblotted in visceral WAT, liver and quadriceps (shown n = 2 animals per genotype, but blot was repeated for each mouse in this study). (B) Activity of GalNAc-T2 as rate of transfer using synthetic IR peptide substrates containing potential glycosylation sites identified using in silico analysis: T930, T1089 and T1122 (n = 3). The background activity was subtracted, and data are presented as mean values ± SEM with ∗p < 0.05, ∗∗p < 0.01. (C) Schematic representation of the insulin receptor containing the identified O-glycosites in vivo. (D) Table with site-specific identification of O-glycosites of the insulin receptor in livers from wild-type and Galnt2−/− mice using the EXoO method. PSM = peptide-to-spectrum matches, ND = not detectable.
Figure 6
Figure 6
Assessment of visceral WAT lipolysis in Galnt2−/−mice. (A) Fasting plasma NEFA levels (n = 8, repeated throughout 4 cohorts of n = 6–10), (B) adiponectin levels (n = 6) and (C) β-hydroxybutyrate (n = 10–12). (D) Ex vivo visceral WAT basal lipolysis as measured by glycerol release, (E) hourly glycerol release and (F) free fatty acid release (n = 5). (G) Western blotting of lipolytic markers and (H) quantification of the western blots (n = 5). Protein levels are normalized against Gapdh and pHSL 660 and pHSL 563 are relative compared to the total HSL. (I) Plasma non-esterified fatty acid levels after 0.75U/kg insulin injection and (J) the corresponding AUC (n = 7). Experiments were performed using mice that were on control diet. Data are presented as mean values ± SEM with ∗p < 0.05, ∗∗p < 0.01.
Figure 7
Figure 7
Global energy homeostasis is affected in Galnt2−/−mice. Wild-type and Galnt2−/− mice were subjected to an indirect calorimetric study with a 12-hour light/dark cycle on a control diet. (A) Food intake of wild-type and Galnt2−/− mice. (B) Oxygen consumption and (C) carbon dioxide production were measured and (D) energy expenditure, (E) respiratory exchange ratio, (F) lipid oxidation and (G) glucose oxidation were calculated (n = 7–8). Generalized linear model (GLM) statistics were used for B-D, and 2-way ANOVA was used for E-G using CalR [13]. The indirect calorimetry experiments were repeated 3 times among different cohorts, and the results were similar. Data are corrected for lean mass and presented as mean values ± SEM with ∗p < 0.05.
Figure 8
Figure 8
Substrates of GALNT2. (A) Targeted proteomics of apoC-III, PLTP and ANGPTL3 in plasma regulating lipid metabolism (n = 6). (B) Targeted proteomics of ANGPTL3 with peptides targeting the N-terminal and C-terminal site. (C) Oral fat tolerance test represented as triglyceride levels at 0, 1, 2, 3, 4 and 5 h after olive oil bolus (n = 9). Data presented as mean values ± SEM with ∗p < 0.05, ∗∗p < 0.01.
Supplementary Figure 1
Generation of Galnt2 deficient mice, gene expression levels of transferases and resulting GalNAc-T2 protein levels in liver and visceral WAT. (A) The gene targeting construct deletes exon 7 of the Galnt2 gene, which encodes a highly conserved region of the catalytic domain of the Galnt2 enzyme. Arrows show positions of the primers used for PCR genotyping (P1: 5′ GGTCCTGACCTTCCTAGACAGTCACTGC 3′, P2: 5′ GCACTCTCCAAGGGCATGACAGAGC 3′) and P3: 5′ GGGGGAGGATTGGGAAGACAATAGC 3′)). On the right is an agarose gel of PCR products from wild-type (+/+) (1029 bp band), Galnt2+/− heterozygotes (1029 and 386 bp bands) and Galnt2−/− mutants (386 bp band). (B) Gene expression levels of Galnts in wild-type livers with average CT levels per Galnt on the right side (n = 4). (C) Galnt gene expression levels abundance in livers of wild-type versus Galnt2−/− mice (n = 4). (D) GalNAc-T2 protein levels in liver and (E) visceral WAT as determined using targeted proteomics (n = 5–6). Data are presented as mean values ±SEM with ∗∗∗p < 0.001, ND = not detected
Supplementary Figure 2
Plasma cholesterol levels are decreased in Galnt2−/−mice. Four-hour fasted plasma cholesterol levels after (A) control diet and (B) HFD. Cholesterol levels after (C) control or (D) HFD in pooled plasma of Galnt2−/− mice and wild-type littermates fractionated by FPLC. Four-hour fasted plasma triglyceride levels after (E) control diet and (F) HFD. Data presented as mean values ±SEM with ∗p < 0.05, ∗∗∗p < 0.001 (n = 7–9)
Supplementary Figure 3
Pup weight of male and female Galnt2−/−mice and wild-type littermates. Body weight of male and female mice aged three to nine weeks
Supplementary Figure 4
No differences in hepatic lipid content in Galnt2−/−mice and wild-type littermates. Hepatic (A) triglycerides, (B) total cholesterol, (C) free cholesterol, (D) cholesterol esters, and (E) phospholipids in control and Galnt2−/− mice fed a control diet (n = 6–8). Data are presented as mean values ±SEM
Supplementary Figure 5
The Akt/mTORC1 signaling pathway in unstimulated and insulin stimulated visceral WAT derived from Galnt2−/−mice and wild-type littermates. (A) Immunoblotting of total and phosphorylated Akt, Gsk3β, FoxO1, p70 S6K, S6, 4E-BP and housekeeping protein Gapdh in unstimulated visceral WAT harvested from control diet fed Galnt2−/− mice and wild-type littermates (n = 5). (B) Quantification of immunoblot results shown by the ratio between phosphorylated versus total protein. (C) Immunoblotting of total and phosphorylated Gsk3β, p70 S6K, S6, 4E-BP and housekeeping protein Gapdh in visceral WAT stimulated with insulin for the indicated time points. Visceral WAT was derived from control diet fed Galnt2−/− mice and wild-type littermates. Results shown are representative of two independent experiments. Data are presented as mean values ±SEM with ∗p < 0.05, ∗∗p < 0.01
Supplementary Figure 6
Sympathetic outflow is not affected in Galnt2−/−mice. Measurement of (A) glucagon, (B) l-DOPA, (C) dopamine, (D) 3-methoxytyramine, (E) noradrenalin, (F) adrenalin, (G) normetanephrine, (H) metanephrine, (I) corticosterone, (J) 11-deoxycorticosterone levels in plasma. Data presented as mean values ±SEM with ∗p < 0.05 (n = 6 per genotype)
Supplementary Figure 7
Proteins involved in mitochondrial respiration in quadriceps, liver and visceral WAT are not affected in Galnt2−/−mice. Targeted proteomics using qConCATamers targeting different proteins involved in mitochondrial respiration in (A) quadriceps, (B) liver and (C) visceral WAT protein lysates derived from Galnt2−/− mice and wild-type littermates (n = 5–6). Data presented as mean values ±SEM
Supplementary Figure 8
The Akt/mTORC1 signaling pathway in liver and quadriceps derived from Galnt2−/−mice and wild-type littermates. (A) Immunoblotting of total and phosphorylated Akt, Gsk3β, FoxO1, p70 S6K, S6, 4E-BP and housekeeping protein Gapdh in livers, (B) ratio phosphorylated protein versus total protein. (C) Immunoblotting of the above mentioned markers in quadriceps, (D) ratio phosphorylated protein versus total protein. Tissues were harvested from control diet fed Galnt2−/− mice and wild-type littermates (n = 6). Data are presented as mean values ±SEM with ∗p < 0.05, ∗∗p < 0.01

References

    1. Teslovich T.M., Musunuru K., Smith A.V., Edmondson A.C., Stylianou I.M., Koseki M., et al. Biological, clinical and population relevance of 95 loci for blood lipids. Nature. 2010;466(7307):707–713. doi: 10.1038/nature09270. - DOI - PMC - PubMed
    1. Young W.W.J., Holcomb D.R., Ten Hagen K.G., Tabak L.A. Expression of UDP-GalNAc:polypeptide N-acetylgalactosaminyltransferase isoforms in murine tissues determined by real-time PCR: a new view of a large family. Glycobiology. 2003;13(7):549–557. doi: 10.1093/glycob/cwg062. - DOI - PubMed
    1. Holleboom A.G., Karlsson H., Lin R.S., Beres T.M., Sierts J.A., Herman D.S., et al. Heterozygosity for a loss-of-function mutation in GALNT2 improves plasma triglyceride clearance in man. Cell Metabolism. 2011;14(6):811–818. doi: 10.1016/j.cmet.2011.11.005. - DOI - PMC - PubMed
    1. Schjoldager K.T.B.G., Vester-Christensen M.B., Bennett E.P., Levery S.B., Schwientek T., Yin W., et al. O-glycosylation modulates proprotein convertase activation of angiopoietin-like protein 3: possible role of polypeptide GalNAc-transferase-2 in regulation of concentrations of plasma lipids. Journal of Biological Chemistry. 2010;285(47):36293–36303. doi: 10.1074/jbc.M110.156950. - DOI - PMC - PubMed
    1. Khetarpal S.A., Schjoldager K.T., Christoffersen C., Raghavan A., Edmondson A.C., Reutter H.M., et al. Loss of function of GALNT2 lowers high-density lipoproteins in humans, nonhuman primates, and rodents. Cell Metabolism. 2016;24(2):234–245. doi: 10.1016/j.cmet.2016.07.012. - DOI - PMC - PubMed

Publication types

Substances