Meta-Analysis
. 2022 Mar 19;12(1):113.
doi: 10.1038/s41398-022-01874-5.

Phenotypic and genetic analysis of a wellbeing factor score in the UK Biobank and the impact of childhood maltreatment and psychiatric illness

Affiliations
Meta-Analysis

Phenotypic and genetic analysis of a wellbeing factor score in the UK Biobank and the impact of childhood maltreatment and psychiatric illness

Javad Jamshidi et al. Transl Psychiatry. .

Abstract

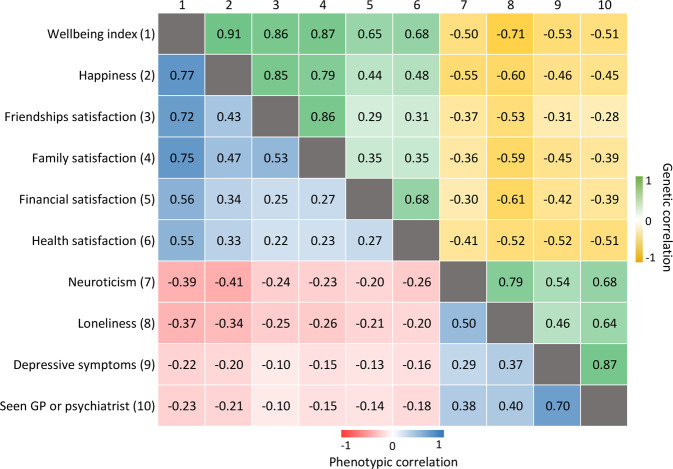
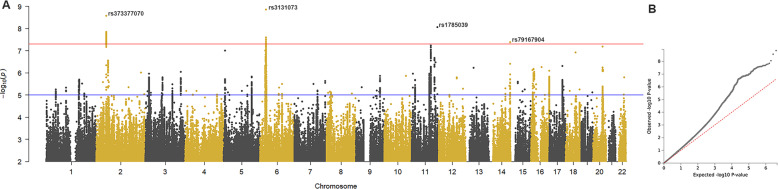
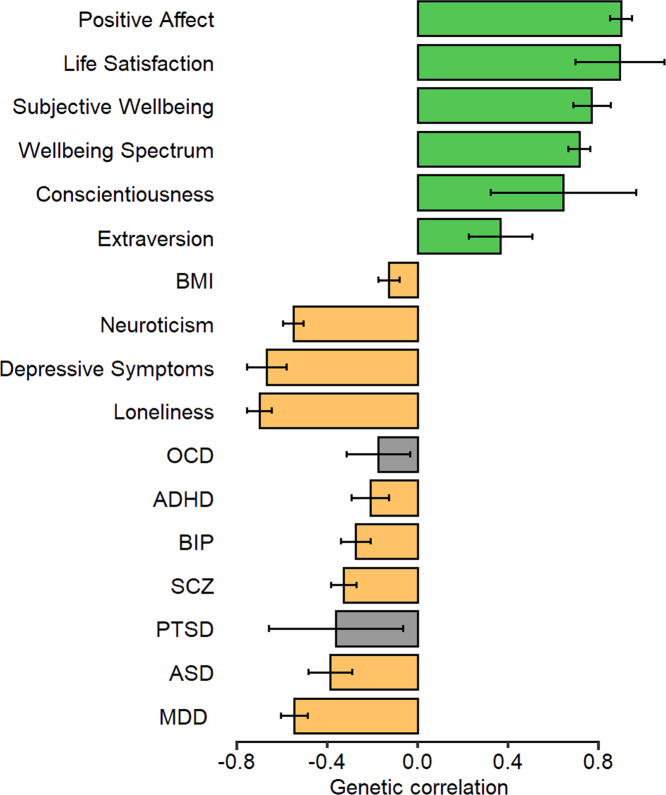
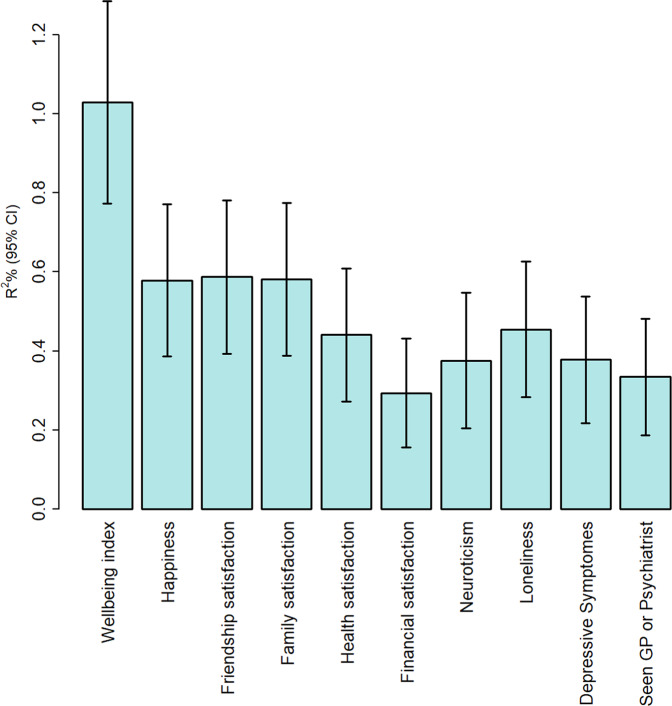
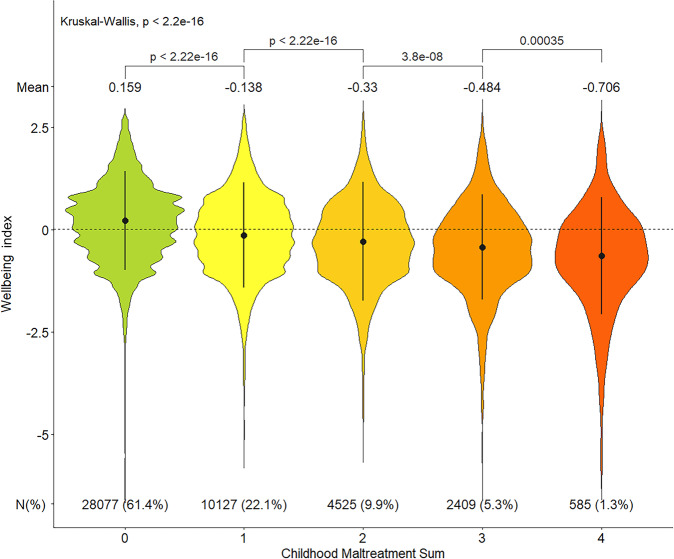
Wellbeing is an important aspect of mental health that is moderately heritable. Specific wellbeing-related variants have been identified via GWAS meta-analysis of individual questionnaire items. However, a multi-item within-subject index score has potential to capture greater heritability, enabling improved delineation of genetic and phenotypic relationships across traits and exposures that are not possible on aggregate-data. This research employed data from the UK Biobank resource, and a wellbeing index score was derived from indices of happiness and satisfaction with family/friendship/finances/health, using principal component analysis. GWAS was performed in Caucasian participants (N = 129,237) using the derived wellbeing index, followed by polygenic profiling (independent sample; N = 23,703). The wellbeing index, its subcomponents, and negative indicators of mental health were compared via phenotypic and genetic correlations, and relationships with psychiatric disorders examined. Lastly, the impact of childhood maltreatment on wellbeing was investigated. Five independent genome-wide significant loci for wellbeing were identified. The wellbeing index had SNP-heritability of ~8.6%, and stronger phenotypic and genetic correlations with its subcomponents (0.55-0.77) than mental health phenotypes (-0.21 to -0.39). The wellbeing score was lower in participants reporting various psychiatric disorders compared to the total sample. Childhood maltreatment exposure was also associated with reduced wellbeing, and a moderate genetic correlation (rg = ~-0.56) suggests an overlap in heritability of maltreatment with wellbeing. Thus, wellbeing is negatively associated with both psychiatric disorders and childhood maltreatment. Although notable limitations, biases and assumptions are discussed, this within-cohort study aids the delineation of relationships between a quantitative wellbeing index and indices of mental health and early maltreatment.


Conflict of interest statement

JMG is a stockholder in MAP Biotech Pty Ltd. There are no other conflicts of interest to report, nor competing financial interests in relation to the work described.

Figures

Fig. 1
Fig. 1. Phenotypic and genetic correlations between the wellbeing index score, its subcomponents and negative mental health indicators in UK Biobank.
All correlations reported here are statistically significant after Bonferroni correction for multiple testing, although many have low (r = 0.3–0.5) to moderate (r = 0.5–0.7) effect size. Manhattan plots for each GWAS are provided in Figure S6.
Fig. 2
Fig. 2. Genome-wide association analysis of the wellbeing index score in UK Biobank discovery sample.
A Manhattan plot representing association at 8,068,119 SNPs across the genome, with chromosome and base pair position is on x-axis and negative logarithm of the p-value from infinitesimal model is on y-axis. The red line indicates the genome-wide significance threshold of p < 5×10⁻⁸. B Quantile-quantile plot showing inflation of observed associations over that expected under null (λGC = 1.2005, mean χ2 = 1.2171, LD score regression intercept=1.005, Total Observed scale h2 = 0.0857 ± 0.005).
Fig. 3
Fig. 3. Genetic correlation (rg) between the wellbeing index score and published GWAS of relevant phenotypes and psychiatric disorders.
Positively and negatively correlated phenotypes and major psychiatric illnesses were examined using Linkage Disequilibrium Score Regression (LDSC). Published wellbeing-related summary statistics from independent studies included: positive affect, life satisfaction, wellbeing spectrum [10], subjective wellbeing [8], conscientiousness [24], extraversion [25], neuroticism [26], depressive symptoms [8], loneliness [27] and body mass index (BMI) [28]. Published disease-specific summary statistics from independent studies included: major depressive disorder (MDD) [29], bipolar disorder (BIP) [30], schizophrenia (SCZ) [31], attention deficit/hyperactivity disorder (ADHD) [32], autism spectrum disorder (ASD) [33], obsessive-compulsive disorder (OCD) [34] and post-traumatic stress disorder (PTSD) [35]. Error bars represent 95% confidence intervals (95% CI). Green bars indicate positive rg, orange bars indicate negative rg and grey bars indicate traits with non-significant genetic correlation after Bonferroni correction (p > 6.94 × 10−4).
Fig. 4
Fig. 4. Variance explained by polygenic scores derived from the wellbeing index discovery GWAS in the replication cohort for wellbeing index score, its subcomponents and related negative mental health indicators.
The y-axis shows the incremental R2% and for binary variables (Loneliness, Depressive symptoms, and Seen GP or Psychiatrist) Nagelkerke R2. Error bars are lower and upper bound of 95% confidence intervals. While variance explained was <1%, P-values were all highly significant (p = 3.55 × 10−14 – 5.68 × 10−56).
Fig. 5
Fig. 5. The impact of multiple childhood maltreatment exposure on the wellbeing index.
The x-axis shows the childhood maltreatment sum score which represents number of childhood traumas in each group (0 = no trauma, 4 = experienced all four types of traumas). The y-axis is the wellbeing index z-score. The mean of wellbeing index z-score for each group is shown above each violin plot. The mean difference in wellbeing index between all categories was examined using Kruskal–Wallis test (p < 2.2 × 10−16). The pairwise mean difference between two adjacent groups employed the Wilcoxon test and the p-values are presented. The interquartile range is represented by vertical black lines inside the violin plots, and the dotted horizontal line is the median wellbeing index score in the sample (n = 45,723). The number of participants in each group is shown at the bottom of each category.

Similar articles

Cited by

References

    1. Ryan RM, Deci EL. On happiness and human potentials: a review of research on hedonic and eudaimonic well-being. Annu Rev Psychol. 2001;52:141–66. - PubMed
    1. Keyes CL, Shmotkin D, Ryff CD. Optimizing well-being: the empirical encounter of two traditions. J Pers Soc Psychol. 2002;82:1007–22. - PubMed
    1. Diener E, Emmons RA, Larsen RJ, Griffin S. The Satisfaction With Life Scale. J Pers Assess. 1985;49:71–5. - PubMed
    1. World Health Organization. Development of the World Health Organization WHOQOL-BREF quality of life assessment. Psychol Med. 1998;28:551–8. - PubMed
    1. Gatt JM, Burton KLO, Schofield PR, Bryant RA, Williams LM. The heritability of mental health and wellbeing defined using COMPAS-W, a new composite measure of wellbeing. Psychiatry Res. 2014;219:204–13. - PubMed

Publication types