. 2022 Mar 18;13(1):1460.
doi: 10.1038/s41467-022-29113-x.

Evolutionary transition from a single RNA replicator to a multiple replicator network

Affiliations

Evolutionary transition from a single RNA replicator to a multiple replicator network

Ryo Mizuuchi et al. Nat Commun. .

Abstract

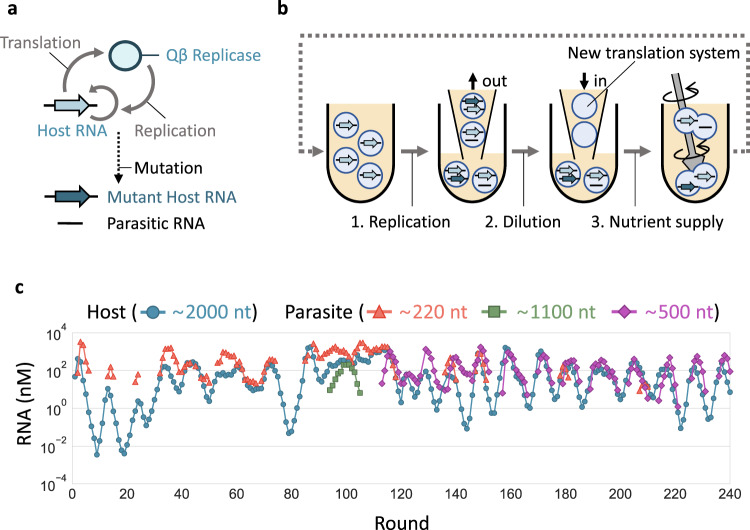
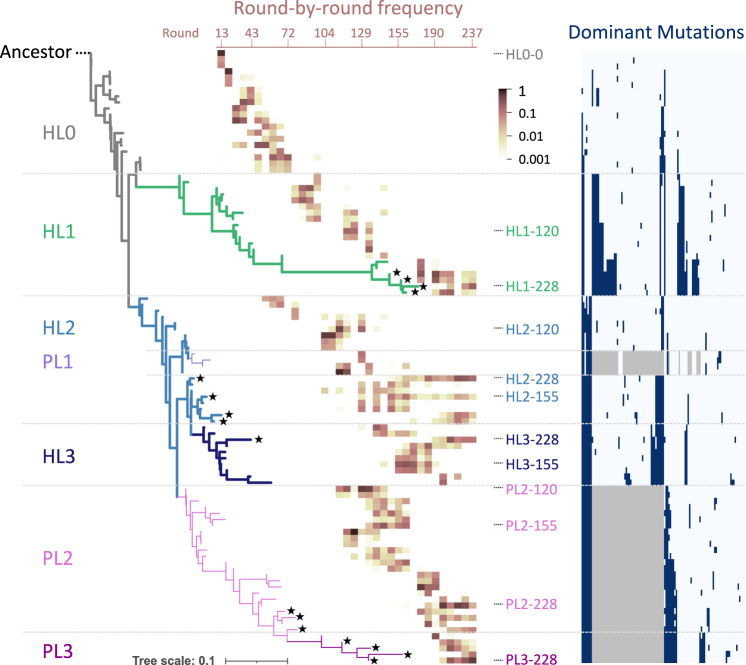
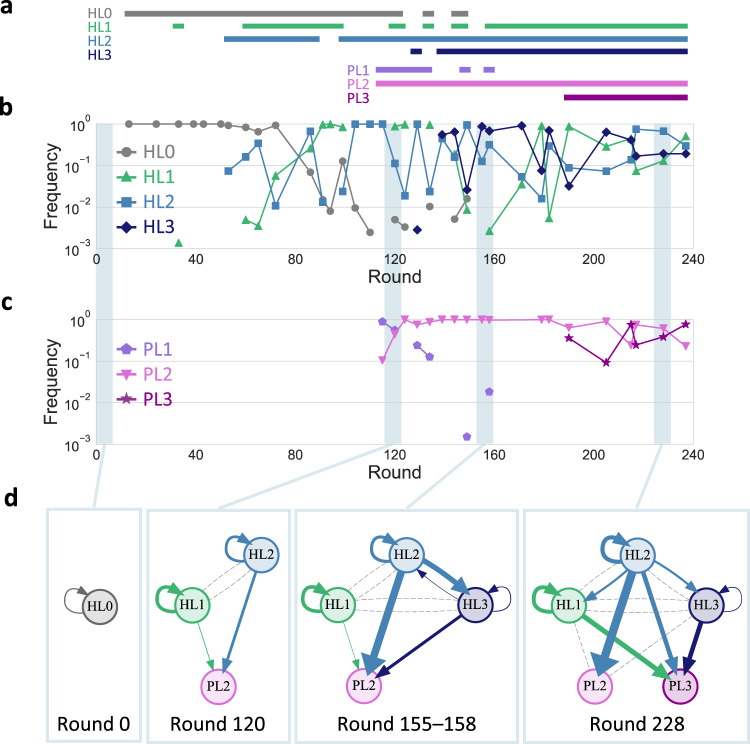
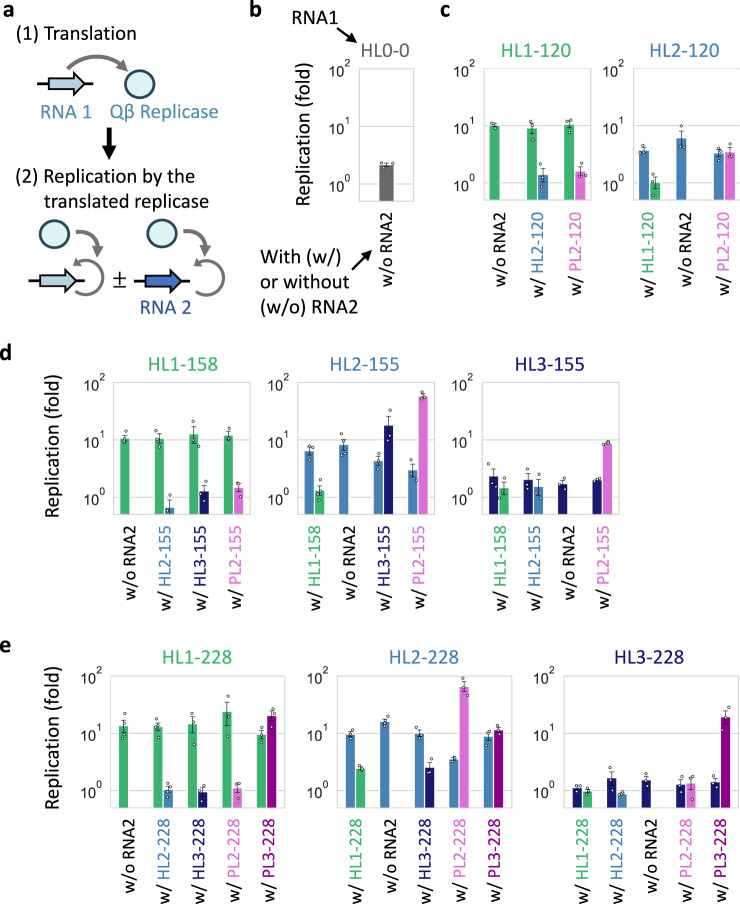
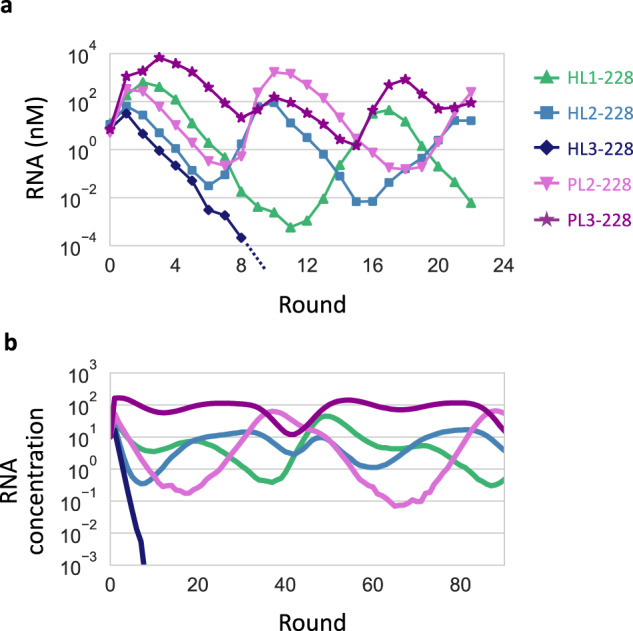
In prebiotic evolution, self-replicating molecules are believed to have evolved into complex living systems by expanding their information and functions open-endedly. Theoretically, such evolutionary complexification could occur through successive appearance of novel replicators that interact with one another to form replication networks. Here we perform long-term evolution experiments of RNA that replicates using a self-encoded RNA replicase. The RNA diversifies into multiple coexisting host and parasite lineages, whose frequencies in the population initially fluctuate and gradually stabilize. The final population, comprising five RNA lineages, forms a replicator network with diverse interactions, including cooperation to help the replication of all other members. These results support the capability of molecular replicators to spontaneously develop complexity through Darwinian evolution, a critical step for the emergence of life.


Conflict of interest statement

The authors declare no competing interests.

Figures

Fig. 1
Fig. 1. Long-term replication experiment.
a The RNA replication system. The original host RNA replicates via translation of the self-encoded replicase, by which mutant host RNAs and parasitic RNAs could be generated. b Schematic representation of long-term replication experiments in water-in-oil droplets. (1) RNA replication was performed at 37 °C for 5 h. (2) Droplets were 5-fold diluted with new droplets containing the translation system. (3) Droplets were vigorously mixed to induce their random fusion and division. c Concentration changes of host and parasitic RNAs of different lengths. Host RNA concentrations were measured by RT-qPCR, and parasitic RNA concentrations were measured from corresponding band intensities after gel electrophoresis. Parasitic RNA concentrations were not plotted in rounds where they were undetectable.
Fig. 2
Fig. 2. Phylogeny of consensus host and parasitic RNA genotypes.
The three most frequent host and parasitic RNA genotypes in all sequenced rounds are shown, with the ancestral host RNA (“Ancestor”) designated as the root of the tree. Branches comprising the defined lineages are colored differently. Host (HL0–3) and parasitic (PL1–3) RNA lineages are shown as thick and thin lines, respectively. The heatmap superimposed on the tree shows the frequencies of each genotype in total host or parasitic RNA reads over all sequenced rounds (from left to right). Black star shapes at the tips of branches mark genotypes that remained in the last sequenced round. Genotypes used for biochemical analysis are indicated with the names of the corresponding RNA clones if presented in the tree. The list of dominant mutations is shown on the right; navy and gray colors indicate the presence of a point mutation and deletion, respectively. An enlarged view of the list is presented in Supplementary Fig. S2.
Fig. 3
Fig. 3. Development of replicator networks.
ac Frequencies of the lineages in total sequence reads of the analyzed genotypes for the host (b) and parasitic (c) RNAs, with horizontal lines above the graphs (a) indicating rounds where the frequency of each lineage is more than 0.1 %. d Directed graphs based on translation-uncoupled experiments (Fig. 4) for representing inter-dependent replication of the RNA clones of each selected round. Nodes represent RNA clones of indicated rounds. Arrows indicate direct replication with widths proportional to binary logarithm of the measured levels of relative replication. Gray dashed lines indicate undetected replication events from host RNA clones.
Fig. 4
Fig. 4. Translation-uncoupled replication experiments.
a The experiments were performed in two steps. (1) First, one of the host RNA clones (RNA 1, 30 nM) was incubated at 37 °C for 2 h to translate the replicase without RNA replication. (2) The reaction mixture was diluted, and RNA replication was initiated with the translated replicase at 37 °C for 2 h while stopping translation, in the presence or absence of the same concentration (10 nM) of another RNA clone (RNA 2). The replication of each RNA was measured by sequence-specific RT-qPCR. be Replication of one or pairs of RNA clones at rounds 0 (b), 120 (c), 155–158 (d), and 228 (e). Colors match those in Fig. 3d. Error bars indicate mean ± SEM (n = 3 or 4 as shown as individual data points). Measurements were taken from distinct samples. Average fold replications (>1.5-fold) were used to draw the directed graphs (Fig. 3d). Source data are provided as a Source data file.
Fig. 5
Fig. 5. Co-replication dynamics of the evolved RNA clones.
a RNA concentration changes in a long-term replication experiment started with 10 nM each of the five RNA clones at round 228, measured by sequence-specific RT-qPCR. b Representative RNA concentration changes in a simulated long-term replication using the theoretical model. The replication rates of the simulated RNAs were based on those of the RNA clones of the same colors in (a).

Comment in

Similar articles

Cited by

References

    1. Gilbert W. The RNA world. Nature. 1986;319:618.
    1. Szostak JW, Bartel DP, Luisi PL. Synthesizing life. Nature. 2001;409:387–390. - PubMed
    1. Joyce GF. The antiquity of RNA-based evolution. Nature. 2002;418:214–221. - PubMed
    1. Eigen M, Schuster P. A principle of natural self-organization—Part A: emergence of the hypercycle. Naturwissenschaften. 1977;64:541–565. - PubMed
    1. Maynard-Smith, J. & Szathmáry, E. The Major Transitions in Evolution (Oxford University Press, Oxford, UK, 1997).

Publication types