. 2022 Mar 18;13(1):1454.
doi: 10.1038/s41467-022-29120-y.

Precise tumor immune rewiring via synthetic CRISPRa circuits gated by concurrent gain/loss of transcription factors

Affiliations

Precise tumor immune rewiring via synthetic CRISPRa circuits gated by concurrent gain/loss of transcription factors

Yafeng Wang et al. Nat Commun. .

Abstract

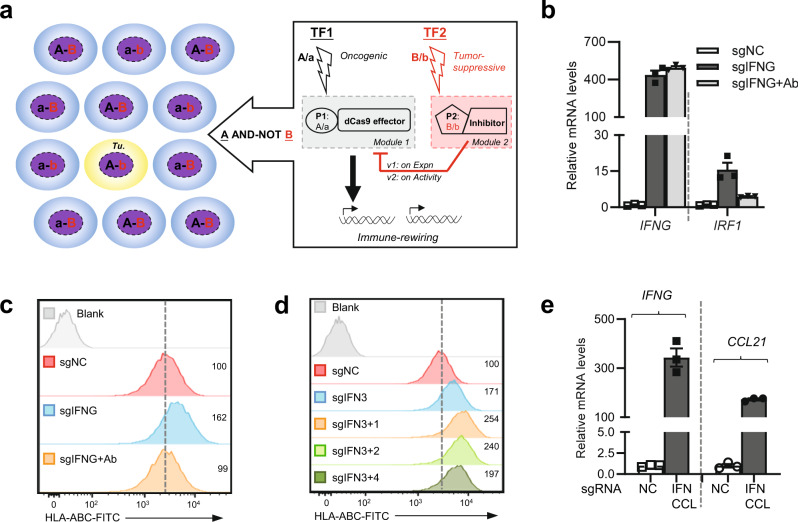
Reinvigoration of antitumor immunity has recently become the central theme for the development of cancer therapies. Nevertheless, the precise delivery of immunotherapeutic activities to the tumors remains challenging. Here, we explore a synthetic gene circuit-based strategy for specific tumor identification, and for subsequently engaging immune activation. By design, these circuits are assembled from two interactive modules, i.e., an oncogenic TF-driven CRISPRa effector, and a corresponding p53-inducible off-switch (NOT gate), which jointly execute an AND-NOT logic for accurate tumor targeting. In particular, two forms of the NOT gate are developed, via the use of an inhibitory sgRNA or an anti-CRISPR protein, with the second form showing a superior performance in gating CRISPRa by p53 loss. Functionally, the optimized AND-NOT logic circuit can empower a highly specific and effective tumor recognition/immune rewiring axis, leading to therapeutic effects in vivo. Taken together, our work presents an adaptable strategy for the development of precisely delivered immunotherapy.


Conflict of interest statement

The authors declare no competing interests.

Figures

Fig. 1
Fig. 1. An active CRISPRa can flexibly program immunostimulatory outputs in tumor cells.
a The overall design for our tumor-targeting synthetic circuit is illustrated. Different cells on the left can be defined by the combinatorial status regarding two TFs (A/a and B/b, in black and red). The upper- and lower-case letters respectively indicate their high and low levels. A tumor cell (Tu.) selectively featuring simultaneous activation of TF1 and inactivation of TF2 (“A-b”) is depicted in yellow. On the right, a synthetic circuit is to specify functional output in the “A-b” tumor cells. Promoters (P1 and P2) are used as sensors for TF1 and TF2, respectively. The circuit adopts CRISPR/dCas9 transcriptional effectors for input processing and actuation. Here, two sequential versions of the circuit are denoted (v1 and v2). They respectively feature a TF2-sensing inhibitory module (pink) against either the expression (v1) or activity (v2) of the dCas9 effector in the activation module (grey). b, c H1299 cells were transfected with dCas9 (under the survivin promoter), MPH, and a high-performance activating sgRNA against IFNG (sgIFNG or a negative control sgNC). Cells were incubated for 48 h in the presence of 10 μg/ml of IgG or anti-IFNγ (Ab) and were then harvested for qPCR (b) or flow cytometry analyses (c). d H1299 cells were transfected similarly as above for 48 h. Combinations of sgRNAs targeting sequences upstream of IFNG (all containing a well-performing sgRNA, i.e., sgIFN3) were included in the plasmid mix. In both (c) and (d), the dotted lines denote the levels in control cells. Additionally, the relative median fluorescence intensity [MFI] values are marked. e The H1299 cells were transfected similarly as in (d), except that sgRNAs against IFNG and CCL21 were introduced for multiplexed activation. Cells were harvested 24 h after transfection for qPCR analyses. In this figure, the qPCR results are presented as mean ± SEM (n = 3 biological replicates). Source data are provided in the Source Data file.
Fig. 2
Fig. 2. Construction of a preliminary dual-input, AND–NOT logic circuit.
a An EGFP reporter whose expression as a fusion protein would be initiated by Cas9/sgRNA-mediated upstream cleavage (frameshift) is illustrated on top. A ribozyme-based, Pol II sgRNA expression system is illustrated right below. 293T cells were transfected with Cas9 and the reporter, as well as the CMV-driven sgRNA for cutting the reporter construct (sgCUT), its Pol III counterpart, or the corresponding control non-targeting sgRNAs (sgCon). Cells were harvested (48 h) and subjected to flow cytometry. Percentages of EGFP+ cells(mRuby+ gate) were marked on the histograms. b The illustration on the top shows a Pol II promoter-controlled CRISPRa SAM complex. The dCas9 and targeting sgRNA for activation (sgTGTa) are both led by 5× ISRE, while the co-activator MPH is constitutively expressed. In the reporter, 3× target sites proceed a minimal promoter-led EGFP. After plasmid transfections, 293T cells were treated with human IFNα (1000 IU/ml) for 24 h. EGFP levels were determined by fluorescence microscopy (inset, scale: 100 μm), and by immunoblotting (IB, lower left). c, d In c, the illustration shows a circuit with one Pol II promoter (5× ISREs) controlling all three CRISPRa components (activating an EGFP reporter) and another (CMV) driving an off-switching sgRNA (sgOFF, targeting all three CRISPRa components). A non-targeting sgRNA (sgCon-i) serves as a control for the sgOFF. Transfected cells were treated (1000 IU/ml IFN, 48 h) and harvested for IB. In d, some cells were subjected to flow cytometry and followed by quantitation (EGFP+%×MFI, mean ± range, n = 2 from independent experiments). e, f The circuit was similar to (c), except that the sgOFF was led by 5× NκRE. The cells were treated ±IFN (1000 IU/ml) and ±TNF (50 ng/ml) for 48 h and harvested either for IB analyses (e), or for flow cytometry (f). In f, the histogram shows the fluorescence pattern for EGFP+ cells. The dotted lines mark high levels of EGFP positivity definitively attributed to CRISPRa activity. Relative levels of EGFP+%×MFI are marked on the histogram. The IB results in b, c, e are representative of two independent experiments. Source data are provided in the Source Data file.
Fig. 3
Fig. 3. Construction of a customized AND-NOT logic circuit (v1) targeting a malignant state.
a The left box contains a two-input table based on activities of an onco-TF(I) and a tumor-suppressive TF(II). The tumorous state can be gated by the status of this TFs using an AND–NOT logic (“ON” in green). The right box illustrates the strategy for an AND–NOT logic, tumor-targeting circuit based on the activities of HIF1α and p53. An output is engaged only in cells featuring high HIF1α activity in conjunction with p53 deficiency. b H1299 cells were transfected with a 3× HRE-luciferase reporter and treated with 150 μM CoCl2 for 24 h. Relative levels of luciferase activities were presented (mean ± SD, n = 3 biological replicates). c H1299 cells were introduced with tetracycline-inducible p53 via a lentiviral vector (“p53-tet”). These cells were transfected with a p53-responsive PM2-luciferase construct and treated with 50 ng/ml of DOX for 48 h. The cells were harvested for luciferase assay (mean ± SD, n = 3 biological replicates). d The illustration on the left shows the design for an AND–NOT circuit (“v1.1”). Each CRISPRa component (to activate EGFP transcription) is controlled individually by a 3× HRE promoter, whereas the sgOFF is driven by a p53-responsive promoter (PM2). In the results shown on the right, the effects of PM2-sg#4-i were compared to sg-Con-i in p53-tet H1299 cells. The circuit-introduced cells were treated with ±150 μM CoCl2 and ±DOX (with indicated doses) for 24 h. Cell lysates were examined by IB. The dCas9 levels were represented by their Flag tag (Flag-dC). e All CRISPRa components were assembled into one single 3× HRE-controlled unit, as shown in the illustration on the top. Other designs and experiments were similar to those in (d). According to its stage of development, the circuit is named “v1.2”. In d, e, the blotting results are representative of two independent experiments. In addition, quantitation for the basal, CoCl2, and co-addition (DOX at 50 ng/ml) groups pooled from four independent experiments are marked below the corresponding EGFP panel (E/G, EGFP normalized to GAPDH, mean ± SEM). Source data are provided in the Source Data file.
Fig. 4
Fig. 4. Development of a more accurate NOT gate for CRISPRa by employing the anti-CRISPR AcrIIA4.
a 293T cells were co-transfected with the AcrIIA4 in bacterial codons [“A”] or its human codon-optimized version [ACRmax, “Amax”] (both under CMV promoter), and the constitutively expressed SAM components. Thirty-six hours after transfection, cell lysates were harvested and subjected to IB for levels of EGFP and Flag-dCas9. b The p53-tet H1299 cells were transfected with a single promoter-driven CRISPRa expression unit targeting an EGFP reporter, and ACRmax led by PM2 (illustration on the left, PSuv: survivin promoter). The effects of DOX (10 ng/ml) treatment were analyzed by IB (middle). Quantitation of EGFP band intensities (normalized to those of GAPDH) is shown on the right (mean ± SEM, n = 3 measurements from independent experiments). c, d In c, the illustration shows the circuit featuring a strong CRISPRa actuator (CMV-dCas9 and U6-sgTGTa for EGFP), and an inhibitory module of PM2-ACRmax. In d, the circuit was introduced into A549 and H1299 cells. A non-targeting sgRNA (sgCon-a) was the control. A representative histogram shows the fluorescence pattern for EGFP+ cells (“Ta”: sgTGTa). The dotted lines mark high levels of EGFP positivity definitively attributed to CRISPRa. The quantitation is shown next to the histogram (EGFP+%×MFI, mean ± SEM, n = 3 biological replicates). e Isogenic clones (six each) of WT or p53-deficient A549 cells were prepared after CRISPR/Cas9-mediated genome editing. The circuit in c was introduced into the cells and their EGFP signals were determined by flow cytometry (left). The dotted lines highlight p53/PM2-ACR-driven inhibition of CRISPRa activities. The quantitation for fluorescence (EGFP+%×MFI) is presented on the right (mean ± SEM, n = 6 independent WT and p53−/− cell lines transfected in parallel). f WT or p53−/ MEFs were prepared. The inset shows a representative genotype analysis. The circuit in c was introduced to the cells (sgCon-a as a control). The cell lysates were subjected to IB. One-sided Student’s t-tests were used for statistical analyses in this figure (P values provided). Blotting results in (ac) are representative of 2, 3, and 2 independent experiments, respectively. Source data are provided in the Source Data file.
Fig. 5
Fig. 5. An improved PSuv/PM2 AND-NOT logic circuit (v2) rewires p53-deficient tumor cells to produce IFNγ.
ac In a, the p53-tet H1299 cells (±10 ng/ml DOX) were introduced with the circuit shown on the left (“v2”). The PSuv-driven CRISPRa is programmed to activate transcription of endogenous IFNG, whereas PM2-ACRmax forms an inhibitory module (compared to a non-expression construct, PM2-Con). The non-targeting sgNC was used as a negative control for circuit actuation. The cell lysates were harvested 48 h after transfection and were subjected to IB. The data shown are representative of two independent experiments. b The conditioned media from the cells were also collected and were added to freshly prepared PBMC for 24 h. The cells were subjected to flow cytometry of Class II HLA levels (CD45+CD11b+-gated). The relative MFI values are marked on the histograms. The dotted lines denote the control levels. In c, p53-tet cells were transfected with the circuit at low confluency (~20%). For target activation, a construct containing a tandem of U6-dependent IFNG-targeting sgRNAs (sgIFN3 + 1) was used. Ninety-six hours after transfection, the cells were subjected to MTT assay. A quantitative summary from three independent experiments is presented (mean ± SEM, two-sided t-test, P values provided). d Co-cultures containing LLC cells (p53-deficient, labeled with mCherry) and their p53+ knock-in derivatives in equal proportion were established. The mixed cells were transfected with the PSuv-CRISPRa/PM2-ACRmax circuit (v2) targeting EGFP (sgTa: sgTGTa) for 24 h. Cells were subjected to flow cytometry analyses for mCherry and EGFP fluorescence (pseudo-color). The EGFP+ subpopulation in either the mCherry+ and mCherry- gates are further resolved in an EGFP fluorescence histogram, respectively in red and blue. The insets in the histograms show the averaged EGFP levels (EGFP+%×MFI) in these different gates from two independent experiments. e The parental and p53+ LLC cells were respectively transfected with the PSuv/PM2 circuit (v2) for conditional mouse Ifng activation by CRISPRa. The mRNA levels for IFNγ and its target gene Irf1 are shown. Cdkn1a levels report p53 status. These qPCR results are presented as mean ± SEM (n = 3 biological replicates). Source data are provided in the Source Data file.
Fig. 6
Fig. 6. The PSuv/PM2 AND–NOT circuit (v2) empowers immune rewiring of p53-deficient tumors, driving inhibition of tumor progression in vivo.
a, b The parental and p53+ LLC cells were respectively transfected with the PSuv/PM2 circuit (v2) for conditional mouse Ifng activation by CRISPRa. The RNA samples were subjected to RNAseq analyses. a The principal component analyses were performed on the datasets. b The genes with circuit-dependent induction (FC ≥ 4, Padj < 0.05) in parental LLC cells are selected. Their overall expression patterns are shown in a heatmap. The annotation for Ifng is highlighted in red, whereas the known IFNγ targets are highlighted in orange. c As illustrated on the left, the PSuv-CRISPRa-Ifng/PM2-ACRmax circuit (a circuit with sgNC as a control) was packaged using a mix of two lentiviral vectors with fluorescent labels (LVFL), where the fluorescent labels would enable determination of transduction efficiency. The LLC cells and their p53+ derivatives were respectively transduced in vitro. After determination of transduction efficiency (see Supplementary Fig. 6e), the unselected cells were implanted subcutaneously to the flanks of mice (2 × 106). The trends of tumor growth [size] are shown on the right (n = 10, mean ± SEM, two-sided t-tests performed between the sgNC and sgIfn groups at different time points). Asterisks are used to denote statistical significance (*P < 0.05; **P < 0.01; ***P < 0.001), and the exact P values between the two groups on day-9, 11, 13, 15, 17 are 0.00053, 0.0095, 0.022, 0.022, and 0.022, respectively. The inset shows the individual tumor weights determined at the harvest. d The above tumor samples were subjected to preparation of total RNA. The RNA samples corresponding to individual tumors were analyzed for the levels of indicated markers via qPCR analyses (n = 10, mean ± SEM). One-sided Student t-tests were performed. Some apparent differences in markers are found between the two groups of LLC tumors (except for Cd8a), while parallel comparisons between the two groups of p53+ tumors do not show significant differences. Source data are provided in the Source Data file.

Similar articles

Cited by

References

    1. Ribas A, Wolchok JD. Cancer immunotherapy using checkpoint blockade. Science. 2018;359:1350–1355. - PMC - PubMed
    1. June CH, O’Connor RS, Kawalekar OU, Ghassemi S, Milone MC. CAR T cell immunotherapy for human cancer. Science. 2018;359:1361–1365. - PubMed
    1. Melero I, Castanon E, Alvarez M, Champiat S, Marabelle A. Intratumoural administration and tumour tissue targeting of cancer immunotherapies. Nat. Rev. Clin. Oncol. 2021;18:558–576. - PMC - PubMed
    1. Kitada T, DiAndreth B, Teague B, Weiss R. Programming gene and engineered-cell therapies with synthetic biology. Science. 2018;359:eaad1067. - PMC - PubMed
    1. Wu MR, Jusiak B, Lu TK. Engineering advanced cancer therapies with synthetic biology. Nat. Rev. Cancer. 2019;19:187–195. - PubMed

Publication types

MeSH terms

Substances