. 2022 Mar 18;13(1):1479.
doi: 10.1038/s41467-022-29121-x.

Thermosensitive hydrogel releasing nitric oxide donor and anti-CTLA-4 micelles for anti-tumor immunotherapy

Affiliations

Thermosensitive hydrogel releasing nitric oxide donor and anti-CTLA-4 micelles for anti-tumor immunotherapy

Jihoon Kim et al. Nat Commun. .

Abstract

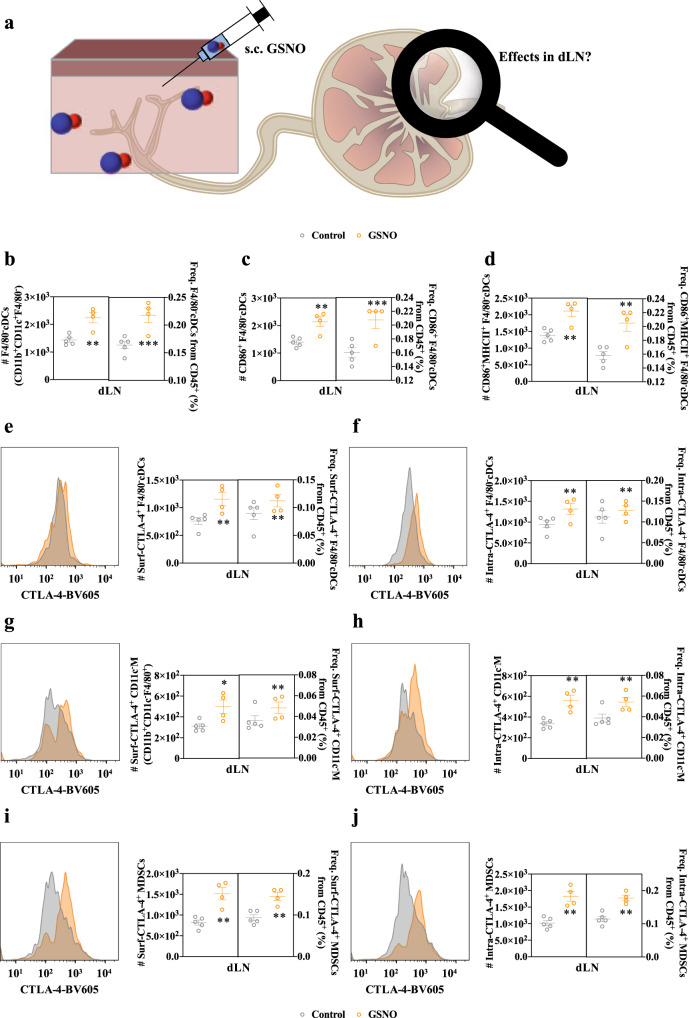
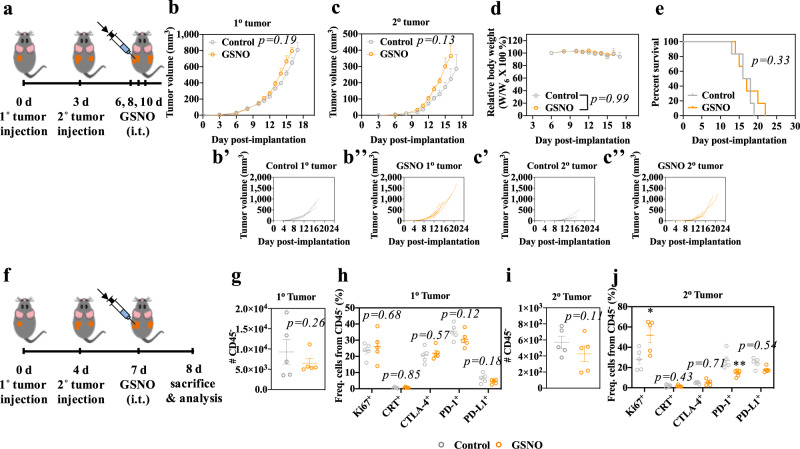
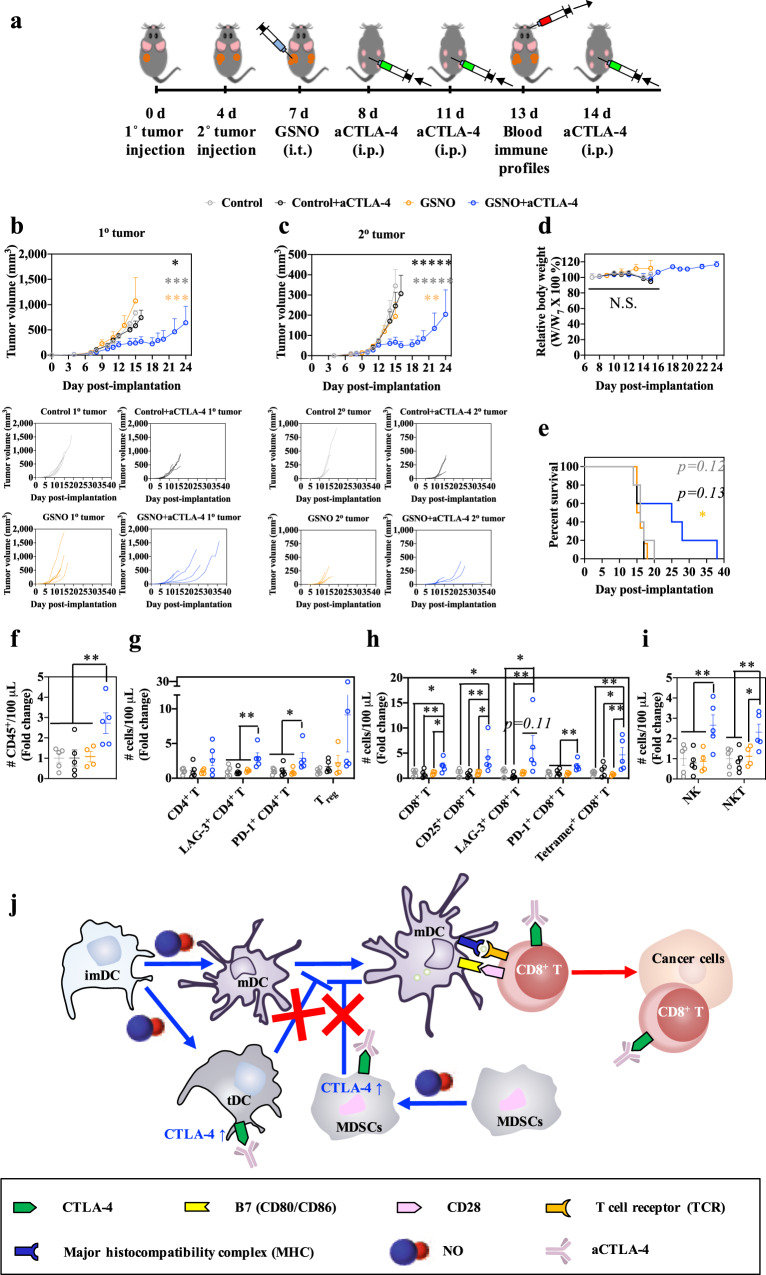
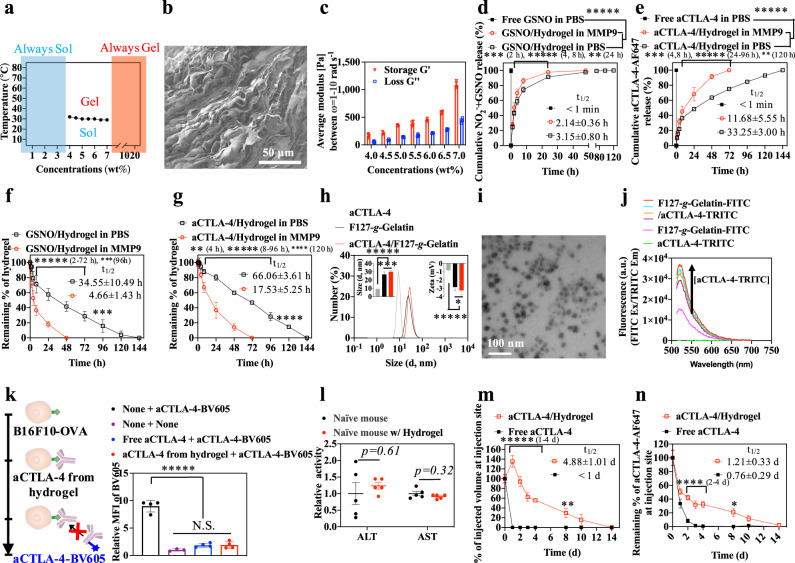
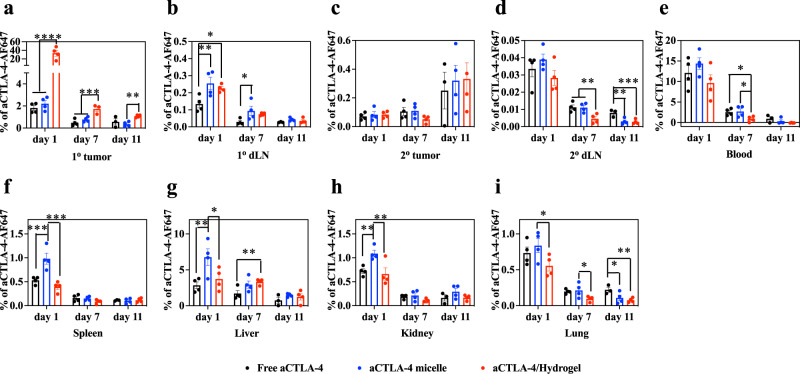
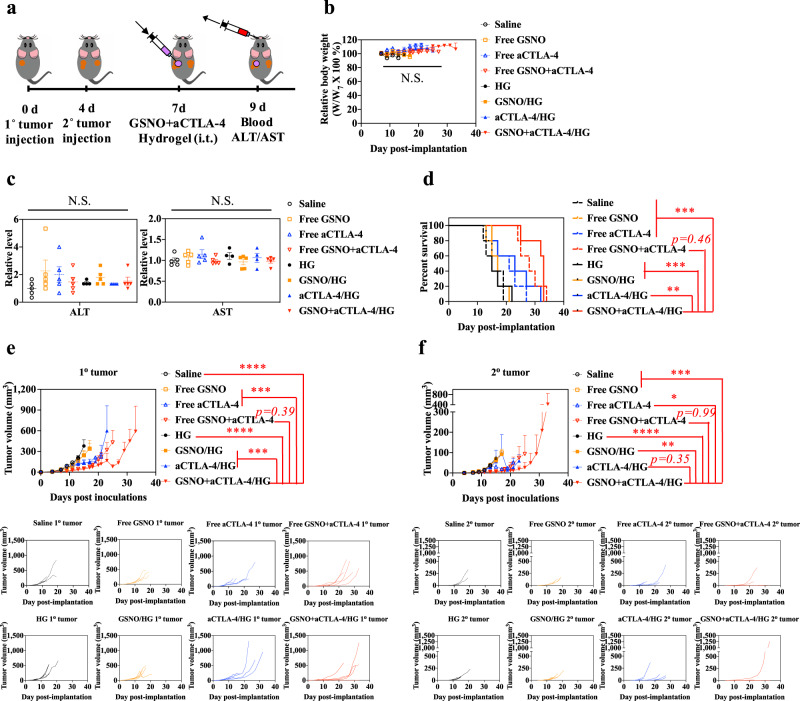
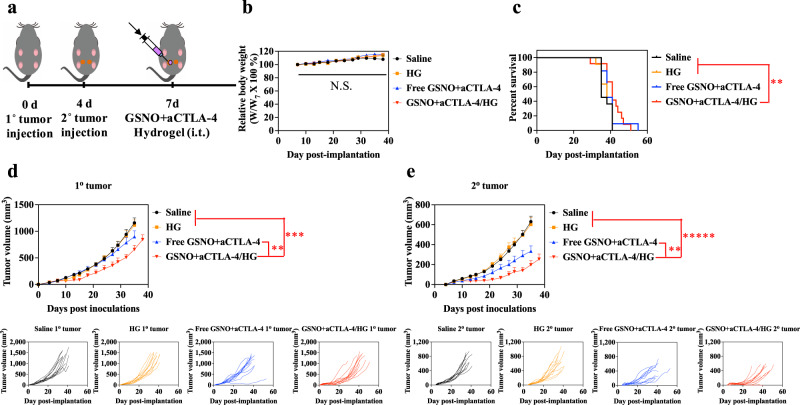
Due to their autosynchronous roles in shaping the anti-tumor immune response, complex immune regulatory networks acting both locally within the tumor microenvironment as well as in its draining lymph nodes play critical roles in the cancer immunotherapy response. We describe herein a thermosensitive co-polymer hydrogel system formed from biocompatible polymers gelatin and Pluronic® F127 that are widely used in humans to enable the sustained release of a nitric oxide donor and antibody blocking immune checkpoint cytotoxic T-lymphocyte-associated protein-4 for efficient and durable anti-tumor immunotherapy. By virtue of its unique gel formation and degradation properties that sustain drug retention at the tumor tissue site for triggered release by the tumor microenvironment and formation of in situ micelles optimum in size for lymphatic uptake, this rationally designed thermosensitive hydrogel facilitates modulation of two orthogonal immune signaling networks relevant to the regulation of the anti-tumor immune response to improve local and abscopal effects of cancer immunotherapy.


Conflict of interest statement

J.K. and S.N.T. are inventors on submitted patents related to the technology described in this manuscript. The remaining authors declare no competing interests.

Figures

Fig. 1
Fig. 1. Subcutaneously injected GSNO influences on antigen presenting cell levels and expression of CTLA-4 in LNs draining the tissue site of injection.
Immune phenotyping of dLN leukocyte populations 1 day after treatment of GSNO (570 μg kg−1) in 30 μL saline. Gating strategy can be found in Supplementary Fig. 1. a Schematic illustration to investigate the effects of subcutaneously injected GSNO on immune cells in dLN. bd Number and frequency of (b) CD45+CD11b+CD11c+F4/80 cDCs (F4/80cDCs) (left p = 0.0321 and right p = 0.0046), (c) CD86+ activated F4/80cDCs (CD86+ F4/80cDCs) (left p = 0.0485 and right p = 0.0087), and (d) CD86+ and MHCII+ activated F4/80cDCs (CD86+MHCII+ F4/80cDCs) (left p = 0.0466 and right p = 0.0120) within dLNs. ej Representative histograms (left) and number and frequency of cell subpopulation (right) of (e, g, i) surface and (f, h, j) intracellularly expressed CTLA-4 by various dLN leukocyte populations. e, f F4/80cDCs (e left p = 0.0277, e right p = 0.0480, f left p = 0.0298, and f right p = 0.0321). g, h CD11b+CD11c-F4/80+ macrophages (CD11c-M) (g left p = 0.0772, g right p = 0.0377, h left p = 0.0396, and h right p = 0.0123). i, j CD45+CD11b+GR-1+ (MDSCs) (i left p = 0.0353, i right p = 0.0285, j left p = 0.0375, and j right p = 0.0192). Number and frequency data are presented as individual biological replicates and mean ± SEM. bj n = 5 for control and n = 4 for GSNO. *****p < 0.0001, ****p < 0.001, ***p < 0.01, **p < 0.05, and *p < 0.1 by two-tailed Student t-test. Source data are available in a Source Data file.
Fig. 2
Fig. 2. Intratumorally administered GSNO effects on tumor growth.
a Tumor model and treatment schedule. 1o and 2o tumors were formed in C57Bl/6 mice by inoculation of 105 B16F10-OVA cells in 30 μL saline on day 0 and day 3, respectively. GSNO (570 μg kg−1) in 30 μL saline was administered on day 6, 8, and 10. b, c Average and (B', B'', C', C'') individual volumes of (b) 1o (directly injected) and (c) 2o tumors (uninjected). d Relative body weight changes post treatment. e Kaplan–Meier survival curves. f Tumor model and treatment schedule. 1o and 2o tumors were formed by inoculation of 105 B16F10-OVA cells in 30 μL saline on day 0 and day 4, respectively. GSNO (570 μg kg−1) was administered i.t. on day 7. Gating strategy can be found in Supplementary Fig. 22. gj Number or frequency of each population of the indicated parent gate in the (g, h) 1o or (i, j) 2o tumor. g, i CD45; h, j Ki-67+ (j p = 0.0677), CRT+, CTLA-4+, PD-1+ (j p = 0.0144), and PD-L1+ of CD45. Data are presented as individual biological replicates and mean ± SEM. be n = 6. gj n = 5. *****p < 0.0001, ****p < 0.001, ***p < 0.01, **p < 0.05, and *p < 0.1. b, c ANOVA using linear mixed-effects model. d Two-way ANOVA using Tukey post-hoc statistical hypothesis. e Log-rank using Mantel–Cox statistical hypothesis. gj Two-tailed Student t-test. Source data are available in a Source Data file.
Fig. 3
Fig. 3. Direct and abscopal therapeutic effects and immunomodulation by GSNO and aCTLA-4 combination therapy.
a Tumor model and treatment schedule. 1o and 2o tumors were formed in C57Bl/6 mice by inoculation of 105 B16F10-OVA cells in 30 μL saline on day 0 and day 4, respectively. GSNO (480 μg kg−1) in 30 μL saline was intratumorally treated on day 7, and aCTLA-4 (100 μg mouse−1) in 30 μL saline was intraperitoneally administered on day 8, 11, and 14. Blood was harvested from the facial vein on day 13 for the profiling of blood immune cells. b Average and individual volumes of 1o (directly injected) tumors. c Average and individual volumes of 2o (uninjected) tumors. d Relative body weight changes post treatment. e Kaplan–Meier survival curves. fi Relative blood abundance of f CD45+, g CD45+CD3+CD4+ T (CD4+ T), LAG-3+ CD4+ T, PD-1+ CD4+ T, and CD45+CD3+CD4+CD25+Foxp3+ (Treg), h CD45+CD3+CD8+ T (CD8+ T), CD25+ CD8+ T, LAG-3+ CD8+ T, PD-1+ CD8+ T, and tetramer+ CD8+ T, and i CD45+CD3-NK1.1+ (NK) and CD45+CD3+NK1.1+ (NKT). Data are presented as individual biological replicates and mean ± SEM. be n = 5 for Control, Control+aCTLA-4, and GSNO + aCTLA-4, and n = 6 for GSNO. fi n = 5 for Control, Control+aCTLA-4, and GSNO + aCTLA-4, and n = 4 for GSNO. *****p < 0.0001, ****p < 0.001, ***p < 0.01, **p < 0.05, and *p < 0.1. Exact p-values for b, c and ei are reported in Supplementary Table 1 and 2. b, c ANOVA using linear mixed-effects model. d Two-way ANOVA using Tukey post-hoc statistical hypothesis. e Log-rank using Mantel–Cox statistical hypothesis by comparing the GSNO + aCTLA-4 with control groups. fi One-way ANOVA using Tukey post-hoc statistical hypothesis. j Proposed actions of combinational use of GSNO and aCTLA-4 on immune response. Blue arrows indicate the mechanism associated with GSNO. Red arrows and crosses represent mechanisms associated with aCTLA-4. Source data are available in a Source Data file.
Fig. 4
Fig. 4. In vitro and in vivo physicochemical properties, residence stability, and drug release behavior of thermosensitive hydrogels formed from F127-g-Gelatin.
a Concentration-dependent sol-gel transition properties of F127-g-Gelatin. b Representative SEM image of F127-g-Gelatin hydrogel (n = 3). c Concentration-dependent storage (G') and loss (G'') modulus of F127-g-Gelatin at 37 °C (n = 3 for 4.5 wt.%, n = 4 for 5.5, 6.0, 6.5, and 7.0 wt.%, and n = 5 for 4.0 and 5.0 wt.%.). d, e Cumulative release of (d) NO2 + GSNO (n = 4) and (e) Alexa FluorTM 647 labeled aCTLA-4 (n = 3) from 4.5 wt% F127-g-Gelatin into PBS with or without MMP9. f, g In vitro residence stability of (f) GSNO (n = 4) and (g) Alexa FluorTM 647 labeled aCTLA-4 (n = 3) containing 4.5 wt% F127-g-Gelatin in PBS with or without MMP9. h DLS size distribution of aCTLA-4 and supernatants released from F127-g-Gelatin hydrogel (F127-g-Gelatin) or F127-g-Gelatin hydrogel containing aCTLA-4 (aCTLA-4/F127-g-Gelatin) (n = 12). The left and right insets represent the average size (n = 12) and zeta potentials (n = 6 for aCTLA-4, and n = 12 for the other) of materials, respectively. i Representative TEM image of F127-g-Gelatin micelles in situ released from F127-g-Gelatin thermosensitive hydrogel (n = 3). j FRET analysis with aCTLA-4-TRITC and F127-g-Gelatin-FITC at FITC excitation and TRITC emission (n = 4). k Competitive assay to verify the activity of aCTLA-4 released from F127-g-Gelatin hydrogel (n = 3 for None+None, and n = 4 for the other). l ALT/AST activities of blood taken from mice 2 d after subcutaneous administration of 4.5 wt.% F127-g-Gelatin hydrogel (n = 5). m In vivo residence stability of 4.5 wt.% F127-g-Gelatin hydrogel quantified by time-resolved volume of hydrogel remaining at the injection site (n = 4). n In vivo quantification of aCTLA-4-AF647 remaining at the injection site by using IVIS® resulting from formulation in the 4.5 wt.% F127-g-Gelatin hydrogel (n = 4). Data are presented as mean ± SD for ch and j, k, and mean ± SEM for ln. *****p < 0.0001, ****p < 0.001, ***p < 0.01, **p < 0.05, and *p < 0.1. Exact p-values for dh, k, m, and n are reported in the source file. dg, m, n Two-way ANOVA using Tukey post-hoc statistical hypothesis. h, k One-way ANOVA using Tukey post-hoc statistical hypothesis. l Two-tailed Student t-test. Source data are available in a Source Data file.
Fig. 5
Fig. 5. In vivo biodistribution of aCTLA-4 released from F127-g-Gelatin thermosensitive hydrogels.
ai Biodistribution of free aCTLA-4-AF647, aCTLA-4-AF647 with 0.45 wt.% F127-g-Gelatin micelles (aCTLA-4 micelle), and aCTLA-4-AF647 with 4.5 wt.% F127-g-Gelatin hydrogel (aCTLA-4 dose equivalent to 162 µg mouse−1) administered into the 1o tumor of C57Bl/6 mice bearing 1o and 2o tumors inoculated with B16F10-OVA 105 cells in 30 μL saline on day 0 and day 4, respectively. a 1o (directly injected) tumor; b LN draining the 1o tumor (1o dLN); c 2o (uninjected) tumor; d LN draining the 2o tumor (2o dLN); e blood; f spleen; g liver; h kidney; i lung. Data are presented as mean ± SEM. n = 4 except (a-i) Free aCTLA-4 groups on day 11 (n = 3) and (a) aCTLA-4/Hydrogel on day 7 (n = 3). *****p < 0.0001, ****p < 0.001, ***p < 0.01, **p < 0.05, and *p < 0.1 with one-way ANOVA using Tukey post-hoc statistical hypothesis. Exact p-values for a–i are reported in Supplementary Table 7. Source data are available in a Source Data file.
Fig. 6
Fig. 6. Direct and abscopal effects of GSNO and aCTLA-4 loaded F127-g-Gelatin hydrogel.
a Tumor model and treatment schedule. 1o and 2o tumors were formed in C57Bl/6 mice by inoculation of 105 B16F10-OVA cells in 30 μL saline on day 0 and day 4, respectively. GSNO (570 μg kg−1) and aCTLA-4 (50 μg mouse−1) were administered intratumorally on day 7 in a total volume of 30 μL in saline or 4.5 wt.% F127-g-Gelatin hydrogel. Blood was harvested from the facial vein on day 9 for assessment using the ALT/AST assay (n = 4 for HG and aCTLA-4/HG, and n = 5 for the other). b Relative body weight changes post treatment (n = 5). c ALT/AST activities of blood taken from mice 2 d after treatment (n = 5). d Kaplan–Meier survival curves (n = 5). e 1o (directly injected) tumor size (n = 5). f 2o (uninjected) tumor size (n = 5). Data are presented as individual biological replicates and mean ± SEM. *****p < 0.0001, ****p < 0.001, ***p < 0.01, **p < 0.05, and *p < 0.1. Exact p-values for df are reported in Supplementary Tables 8 and 9. b Two-way ANOVA using Tukey post-hoc statistical hypothesis. c One-way ANOVA using Tukey post-hoc statistical hypothesis. d Log-rank using Mantel–Cox statistical hypothesis. e, f ANOVA using linear mixed-effects model. Source data are available in a Source Data file.
Fig. 7
Fig. 7. Antitumor effects of GSNO and aCTLA-4 loaded F127-g-Gelatin hydrogel on 4T1 tumor models.
a Tumor model and treatment schedule. 1o and 2o tumors were formed in Balb/C mice by inoculation of 3 × 105 4T1 cells in 30 μL saline to left mammary fat pad on day 0 and at right mammary fat pad on day 4, respectively. GSNO (570 μg kg−1) and aCTLA-4 (50 μg mouse−1) were administered intratumorally on day 7 in a total volume of 30 μL in saline or 4.5 wt.% F127-g-Gelatin hydrogel. b Relative body weight changes post treatment. c Kaplan–Meier survival curves. d 1o (directly injected) tumor size. e 2o (uninjected) tumor size. Data are presented as individual biological replicates and mean ± SEM. n = 11 for saline, HG, and Free GSNO + aCTLA-4. n = 12 for GSNO + aCTLA-4/HG. *****p < 0.0001, ****p < 0.001, ***p < 0.01, **p < 0.05, and *p < 0.1. Exact p-values for ce are reported in Supplementary Tables 11 and 12. b Two-way ANOVA using Tukey post-hoc statistical hypothesis. c Log-rank using Mantel–Cox statistical hypothesis. d, e ANOVA using linear mixed-effects model. Source data are available in a Source Data file.

References

    1. Paredoll DM. The blockade of immune checkpoints in cancer immunotherapy. Nat. Rev. Cancer. 2012;12:252–264. - PMC - PubMed
    1. Francis DM, Thomas SN. Progress and opportunities for enhancing the delivery and efficacy of checkpoint inhibitors for cancer immunotherapy. Adv. Drug Deliv. Rev. 2017;114:33–42. - PMC - PubMed
    1. Waldman, A. D., Fritz, J. M. & Lenardo, M. J. A guide to cancer immunotherapy: from T cell basic science to clinical practice. Nat. Rev. Immunol. 20, 651–668 (2020). - PMC - PubMed
    1. Allison JP, Sharma P. Immune checkpoint targeting in cancer therapy: toward combination strategies with curative potential. Cell. 2015;161:205–214. - PMC - PubMed
    1. Chao Y, et al. Combined local immunostimulatory radioisotope therapy and systemic immune checkpoint blockade imparts potent antitumour responses. Nat. Biomed. Eng. 2018;2:611–621. - PubMed

Publication types