. 2022 Mar 18;13(1):1481.
doi: 10.1038/s41467-022-29151-5.

S100A9-CXCL12 activation in BRCA1-mutant breast cancer promotes an immunosuppressive microenvironment associated with resistance to immunotherapy

Affiliations

S100A9-CXCL12 activation in BRCA1-mutant breast cancer promotes an immunosuppressive microenvironment associated with resistance to immunotherapy

Jianjie Li et al. Nat Commun. .

Abstract

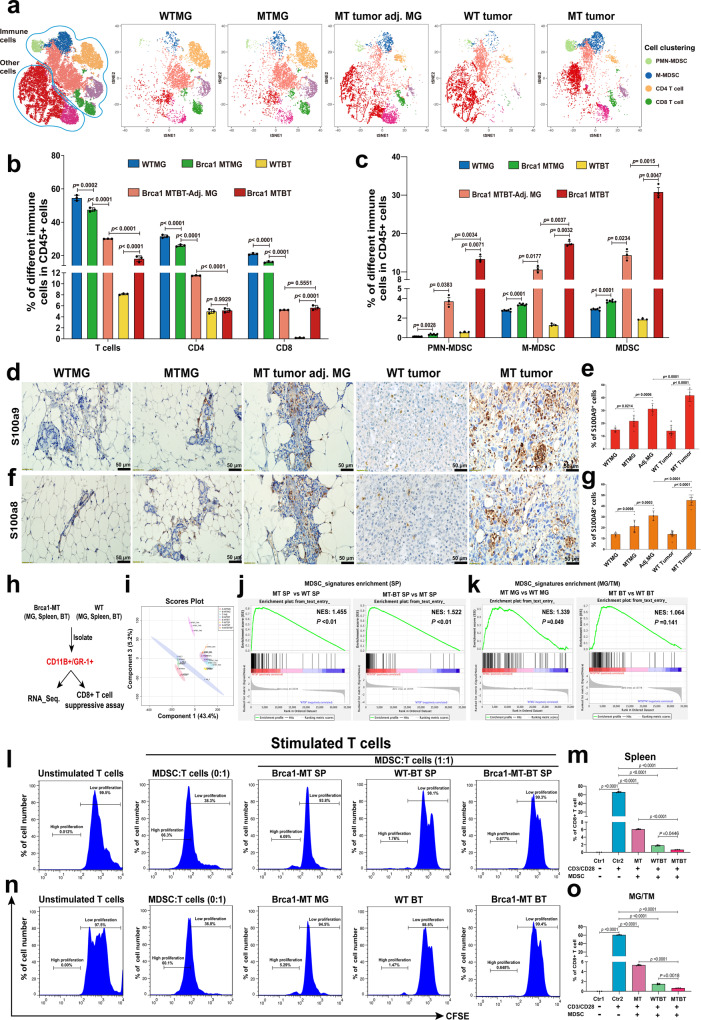
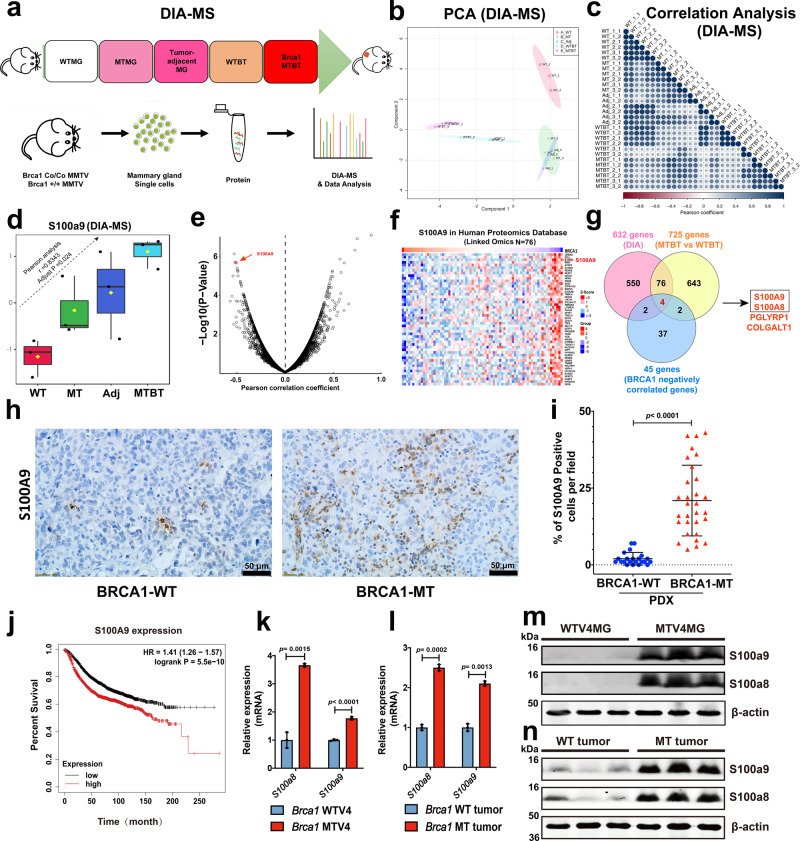
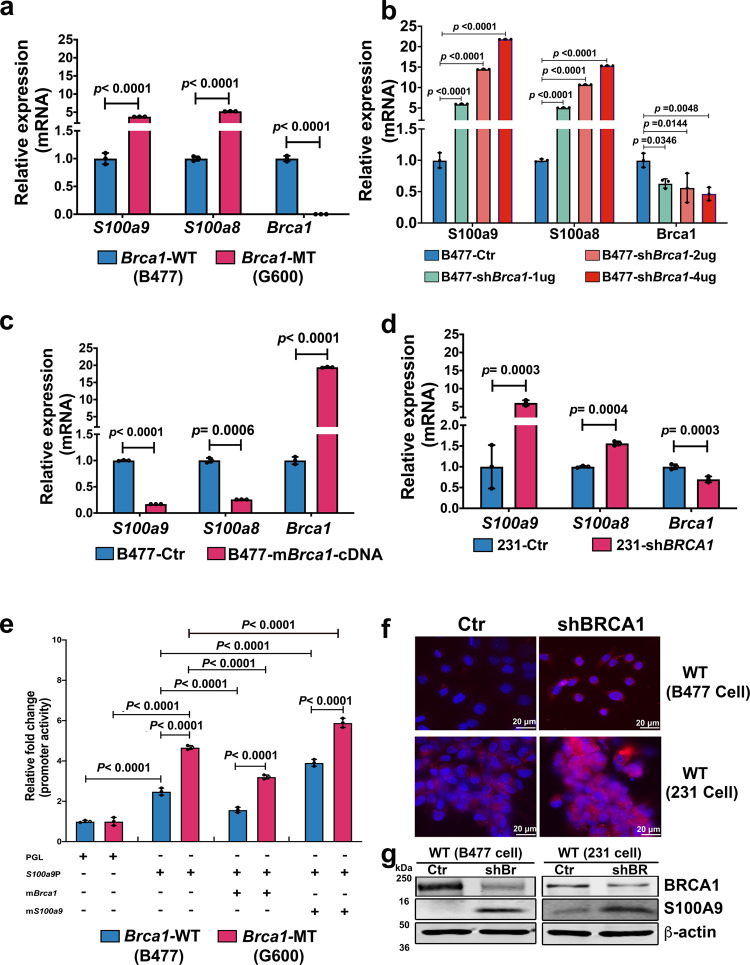
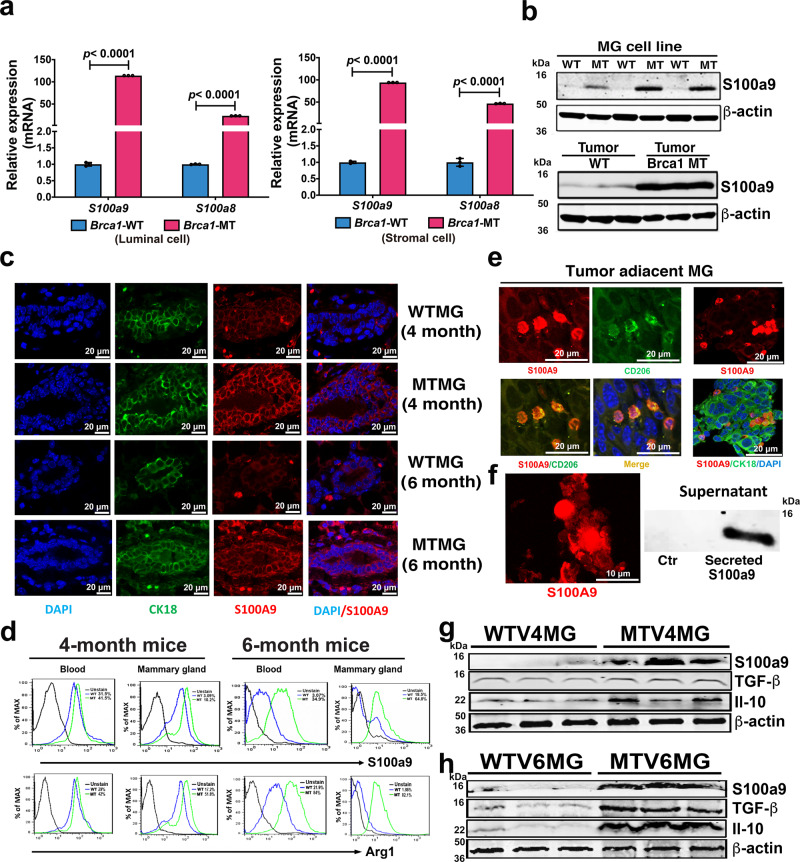
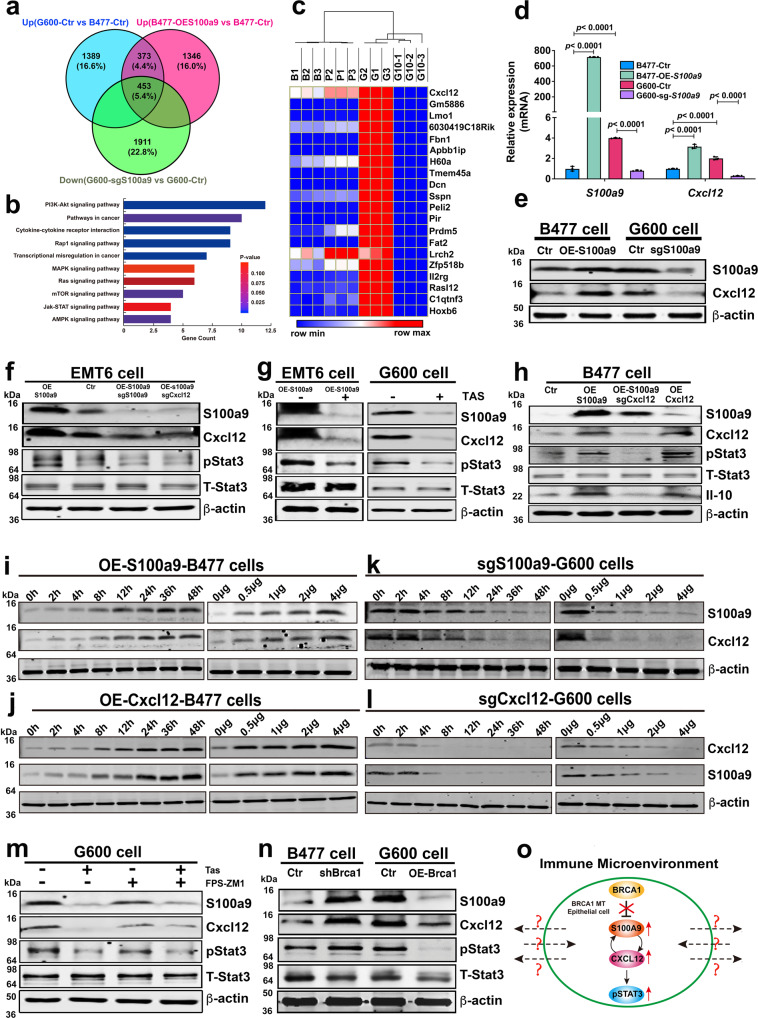
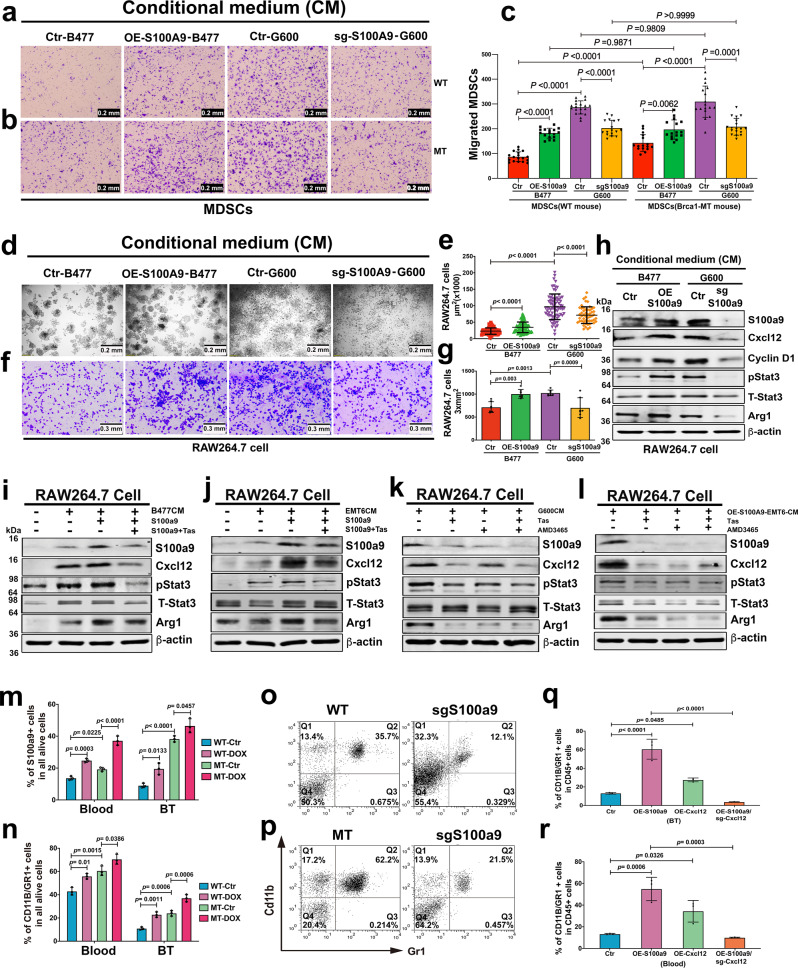
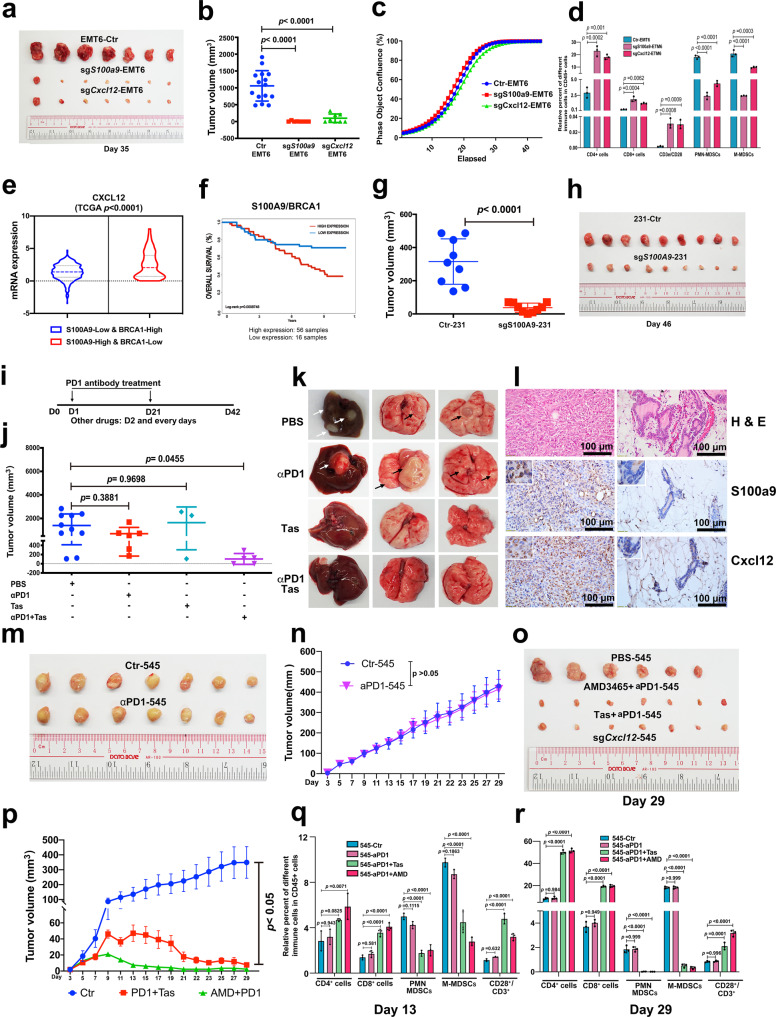
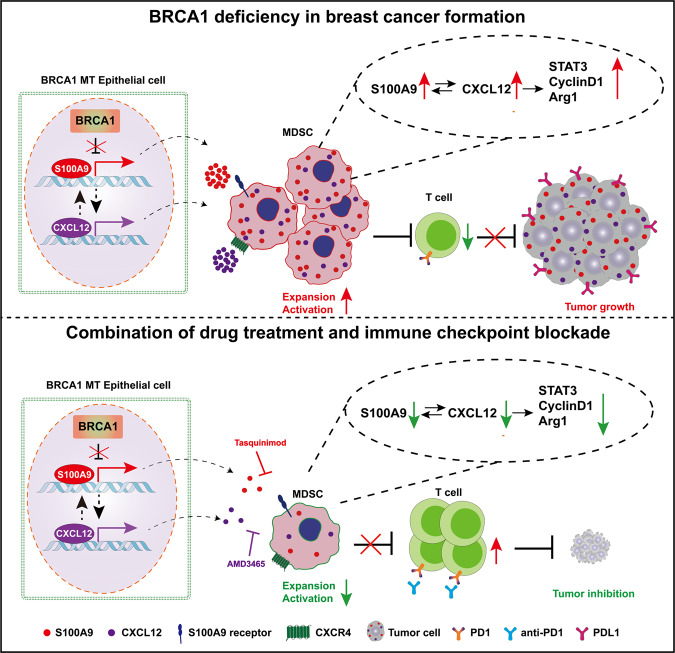
Immune checkpoint blockade (ICB) is a powerful approach for cancer therapy although good responses are only observed in a fraction of cancer patients. Breast cancers caused by deficiency of breast cancer-associated gene 1 (BRCA1) do not have an improved response to the treatment. To investigate this, here we analyze BRCA1 mutant mammary tissues and tumors derived from both BRCA1 mutant mouse models and human xenograft models to identify intrinsic determinants governing tumor progression and ICB responses. We show that BRCA1 deficiency activates S100A9-CXCL12 signaling for cancer progression and triggers the expansion and accumulation of myeloid-derived suppressor cells (MDSCs), creating a tumor-permissive microenvironment and rendering cancers insensitive to ICB. These oncogenic actions can be effectively suppressed by the combinatory treatment of inhibitors for S100A9-CXCL12 signaling with αPD-1 antibody. This study provides a selective strategy for effective immunotherapy in patients with elevated S100A9 and/or CXCL12 protein levels.


Conflict of interest statement

The authors declare no competing interests.

Figures

Fig. 1
Fig. 1. Brca1 deficiency induces immunosuppression in mammary glands and tumors.
a tSNE analysis of immune cells from wildtype (WTMG, n = 6 mice), Brca1-mutant mammary glands (MTMG, n = 6 mice), Tu-Adj. mammary tissues (MT tumor adj. MG, n = 3 mice) from Brca1-MT mice, WT breast tumor (WT BT, n = 3 mice) and breast tumor (MT BT, n = 3 mice) from Brca1-MT mice. b, c The cell populations were classified as total T-cells (CD45+CD3e+), CD4+ T cells (CD45+CD3e+CD4+ and CD8-), CD8+ T cells (CD45+CD3e+CD4-CD8+), MDSCs (CD45+CD11b+Gr1+), PMN-MDSCs (CD45+CD11b+Ly6G+Ly6C-), and M-MDSCs (CD45+CD11b+Ly6G-Ly6C+). b Quantifications of total T-cells, CD4, and CD8 cells. c Quantifications of PMN-MDSCs, M-MDSCs, and total MDSCs by FlowJo analysis (Cytof gating strategies see in Supplementary Fig. 8a, n = 3–6 mice same in a). dg Representative images of IHC staining with antibodies of S100a9 (d) or S100a8 (f), and quantifications of S100a9 (e) or S100a8 (g), (n = 6–15 pictures from 3 mice/group, 6 pictures from WTMG, 9 from MTMG, 6 from adj.MG, 15 from WTBT, and 9 from MTBT, the number of each group same in e and g). h The strategy of isolating CD11B+/GR1+ cells from mammary gland (MG), breast tumor (BT), and spleens (SP) for RNA-sequence and CD8 + T cells suppressive assay from the mice in a. i Principal Component Analysis (PCA) analysis of RNA-sequence data of CD11B+/GR1+cells in h (n = 3 mice/group). j MDSC signature genes enrichment in spleen by GSEA analysis by comparing gene expression from spleens of Brca1-MT (MT SP) vs WT (WT SP) mice and Brca1-MT mice with breast tumor (MT-BT SP) vs MT SP. k MDSC signature genes enrichment in mammary gland (MG) and breast tumor tissues (BT) by GSEA analysis by comparing gene expression from Brca1-MT mammary glands (MT MG) vs wild-type mammary glands (WT MG), and tumors from Brca1-MT (MT BT) and WT (WT BT) mice. l Representative CFSE flow-cytometry histograms and statistics from co-culture of WT T-cells with MDSCs from spleens. m Quantifications of % of CD8 + cells in each sample in l. The T-cell were from 2 months WT mice and MDSCs from spleens of 10-month Brca1-MT mice (Brca1-MT SP), Brca1-WT tumor-bearing mice (WT-BT SP) and Brca1-MT tumor-bearing mice (Brca1-MT-BT SP). Ratio of MDSC to T cells was 1:1 (n = 3 mice/group). n Representative CFSE flow-cytometry histograms and statistics from co-culture of WT T-cells with MDSCs from MG and BT. o Quantifications of % of CD8 + cells in each sample in n. The T-cell were from 2 months WT mice and MDSCs from MG of 10-month Brca1-MT mice (Brca1-MT MG), breast tumor tissues of Brca1-WT tumor-bearing mice (WT BT) and Brca1-MT tumor-bearing mice (Brca1-MT BT). Ratio of MDSC to T cells was 1:1 (n = 3 mice/group) (FACS gating strategies see in Supplementary Fig. 8b). The data are expressed as means ± SD (b, c, e, g, mo) and P values determined by one-way ANOVA followed by Tukey’s multiple comparisons and permutation test. Scale bar: black color, 50 μM. Source data are provided as a Source data file.
Fig. 2
Fig. 2. Oncogenic activation of S100A9 in both Brca1-MT mice and human breast cancer patients.
a Workflow of DIA-MS analysis with mammary tissues during tumorigenesis, including mammary gland tissues from 8–10 months Wild type (WTMG) and Brca1-MT (MTMG) virgin mice, tumor- adjacent mammary tissues (Tu-Adj. MG), and tumors from both Wild type (WTBT) and Brca1-MT (MTBT) mice (n = 3 mice/per genotype). b Plot of Principal Component Analysis (PCA) of samples from the same cohort of samples in (a). c Pearson correlation analysis of duplicate of each sample from the same cohort samples in a. d The patterns of increased the protein level of S100A9 during tumorigenesis with the same cohort of samples in a from DIA data analysis with Spectronaut and statistics analysis by Pearson correlation (FDR < 1, r = 0.8343, adjust p value = 0.024. The raw data are transformed by log10,the box and whisker plots summarize the normalized values, line show the SD). The data are from n = 3 biologically independent replicates. e Pearson correlation of BRCA1 and S100A9 at protein level by volcano plot from Clinical Proteomics Tumor Analysis Consortium (CPTAC) for The Cancer Genomic Atlas (TCGA) database (http://www.linkedomics.org/admin.php). f Heatmap of top 50 genes which are negatively correlated with BRCA1 at protein level from e. g Overlapping of mouse candidate gene lists from DIA analysis with top 45 genes which are negatively regulated by BRCA1 genes. h The representative images of S100A9 antibody staining on BRCA1-WT and BRCA1-MT breast cancer tissues (n = 2 in each group from PDX models) were obtained from Jackson Laboratory. i Quantifications of S100A9 positive cells per field in h, (n = 22 pictures from WT and 30 from MT in h models). j Survival outcome based on S100A9 expression of breast cancer patients (n = 4934) from Kaplan–Meier Plotter website (https://kmplot.com/analysis/index.php?p=service&cancer=breast). k, l Relative expression of S100a9 and S100a8 of mammary tissues in 4-months Brca1-WT and MT virgin mice (k) and Brca1 MT and WT mammary tumors (l) revealed by qPCR (n = 3 mice/group) and the number of dots represents biological replicates). m, n Protein levels of S100a9 and S100a8 in 4-month-old mammary tissues (m), and in Brca1 MT and WT tumors (n) as determined by western blots (n = 3 mice/group). The data are expressed as means ± SD (d, i, k, l) and P values determined by unpaired two-tailed Student’s t test (i, k, l). Scale bar: black color, 50 μM. Source data are provided as a Source data file.
Fig. 3
Fig. 3. S100a9 gene is regulated by both Brca1 and S100a9.
a Expression of S100a9 and S100a8 in Brca1 MT (G600) and WT (B477) mammary epithelial cell lines. b Expression of S100a9 and S100a8 in B477 cells with the expression of shBrca1 at different concentrations. c Expression of S100a9 and S100a8 in B477 cells in which the mBrca1 gene was overexpressed. d Expression of S100A9 and S100A8 in MDA-MB-231 (231) control and 231 cells with the expression of shBRCA1(knock down BRCA1). e Luciferase activity assay of mouse S100a9 promoter after 72 h transfection with PGL vector only, S100a9 promotor, S100a9 promotor with Brca1 cDNA, and S100a9 promotor with S100a9 cDNA in B477 and G600 cells. f S100A9 proteins in B477 mouse mammary epithelial cells and 231 cells with the expression of shBrca1 or shBRCA1, respectively by IF. g BRCA1 and S100A9 protein levels in B477 mouse WT mammary epithelial cells and 231 cells without or with the expression of shBRCA1(shBr/shBR). The data are expressed as means ± SD (ae) and P values determined by unpaired two-tailed Student’s t test (a, c, d) and by one-way ANOVA followed by Tukey’s multiple comparisons (b) or two-way ANOVA (e). The experiments were independently repeated three times with similar results (ag). Scale bar: white color, 20 μM. Source data are provided as a Source data file.
Fig. 4
Fig. 4. Tumor permissive microenvironment in Brca1 MT mammary glands.
a S100a9/S100a8 mRNA expression in the subpopulations of luminal and stromal cells of WT 4-month mammary gland (WTV4MG) and MT 4-months-old virgin mammary gland (MTV4MG) (n = 3 mice). b Protein level of S100a9 in both WT (B477) and MT (G600) mammary epithelial cell lines and tumor tissues by Western blots (n = 3 individual experiment-up and n = 3 mice-down). c Co-staining of S100a9 (red) and CK18 (green) with antibodies on WTV4MG, MTV4MG, WTV6MG, and MTV6MG tissues (n = 3 pairs in each group, Scale bar: 20 μM). d The S100a9 and Arg1 positive cell populations by FACS analysis from the blood and mammary tissues of both WT and MT mice at 4-month and 6-month, respectively (FACS gating strategies see in Supplementary Fig. 8c, n = 3 mice/ group). e Co-staining with S100a9 (red) and CD206 (green) antibodies (left panel) and co-staining with S100a9 (red) and CK18 (green) antibodies (right panel) on tumor-adjacent tissues by IF (40X confocal microscope, Scale bar: 20 μM.) (n = 3 mice and 3 individual experiment). f Secreted S100a9 proteins (left) from both tumor cell and MDSC cells in tumor-adjacent mammary gland (n = 3 mice) and present in the supernatant of cultured cancer cells (right) (n = 3 individual experiment, Scale bar: 10 μM). g Protein levels of S100a9, TGF-β, and Il-10 in mammary gland tissues of both WT and Brca1 MT mice at 4-month (n = 3 mice). h Protein levels of S100a9, TGF-β, and IL-10 in mammary tissues of both WT and Brca1 MT mice at 6-month (n = 3 mice). The data are expressed as means ± SD (a) and P values determined by unpaired two-tailed Student’s t test. The experiments were independently repeated three times with similar results (a, b). Source data are provided as a Source data file.
Fig. 5
Fig. 5. Positive regulation loop between S100a9 and Cxcl12 amplifies oncogenic signals in Brca1-MT epithelial cells.
a The Venn diagram analysis of upregulated genes in G600, Over-Expression-S100a9 in B477 cells (B477-OE-S100a9), and down-regulated genes in G600 cells expressing sgS100A9 (G600-sgS100a9) (n = 3 biological replicates/group). b KEGG Pathway analysis with 453 common (p value was calculated by hypergeometric test with KOBAS 3.0 website). c Top 20 differentially expressed genes by comparison of the gene expression profiles of four different group cells, including B477-Ctr (B1-3), B477-OES100a9 (P1-3), G600-Ctr (G1-3), and G600-sgS100a9 (G10-1-3) (the heatmap was drawn by Morpheus website and clustered by One minus Pearson Correlation). d, e Expressions of S100a9 and Cxcl12 at mRNA level by qPCR (d) at protein levels by western blotting (e) from four group cells in c. f Protein levels of S100a9, Cxcl12 and pStat3 in OE-S100a9-EMT6 cells, sgS100a9/OE-S100a9-EMT6, and sgCxcl12/OE-S100a9-EMT6 cells. g Protein levels of S100a9, Cxcl12 and pStat3 in OE-S100a9-EMT6 and G600 cells without or with S100A9 inhibitor, Tasquinimod (Tas-50 μM) by western blotting. h Protein levels of S100a9, Cxcl12, and pStat3 in WT (B477) cells with the expression of OE-S100a9, OE-S100a9/sgCxcl12, or OE-Cxcl12 by western blotting. i, k Protein levels of Cxcl12 in B477 (i) cells with OE-S100a9 and in G600 (k) cells expressing sgS100a9 at different time courses (0–48 h) and different amounts (0–4 μg) by western blotting. j, l Protein levels of S100a9 in B477 (j) cells with OE-Cxcl12 and in G600 (l) cells expressing sgCxcl12 at different time courses (0–48 h) and different amounts (0–4 μg) by western blotting. m Protein levels of S100a9, Cxcl12, and pStat3 in G600 cells after treating with Tas and FPS-ZM1, inhibitor for RAGE receptors on cell membranes by western blotting. n Protein levels of S100a9, Cxcl12, and pStat3 in B477 cells with the expression of shBrca1 and MT G600 cells with over-expression of Brca1 (OE-Brca1). o A diagram summarizing the relationship of Brca1, S100a9, Cxcl12 and pStat3 in Brca1-MT mammary epithelial cells, and their potential interaction with the surrounding immune microenvironment, which remains elusive. The data are expressed as means ± SD (d) and P values determined by one-way ANOVA followed by Tukey’s multiple comparisons. The experiments were independently repeated three times with similar results (dn). Source data are provided as a Source data file.
Fig. 6
Fig. 6. Expansion and accumulations of MDSCs in Brca1 MT in vivo and in vitro.
ac Migration assay of MDSCs from spleens of WT (a) and Brca1-MT (b) mice in conditional mediums (CM), including CMs from B477 cells (Ctr-B477), OE-S100a9 in B477 cells (OE-S100a9-B477), G600 cells (Ctr-G600), and G600 cells expressing S100a9 (sg-S100a9-G600). Quantification c in (a and b, Scale bar: 0.2 mm, n = 16–19 pictures from independently repeated three times, a panel: n = 18 from Ctr-B477, 17 from OE-S100a9-B477, 19 from Ctr-G600 and 17 from sg-S100a9-G600; b panel: n = 16 from Ctr-B477, 16 from OE-S100a9-B477, 17 from Ctr-G600 and 18 from sg-S100a9-G600). dg Colony formation (d) and migrating cells (f) of RAW 264.7 cells in different condition mediums (CMs) of Ctr-B477, OE-S100a9-B477, Ctr-G600, and sg-S100a9-G600. Quantifications (e, n = 52–100 cell colony area from independently repeated three times, n = 87 cells from Ctr-B477, 100 from OE-S100a9-B477, 76 from Ctr-G600 and 52 from sg-S100a9-G600) in d and (g, n = 7 pictures in each group from independently repeated three times) in f, Scale bar: 0.2 mm. h Protein levels of S100a9, Cxcl12, Cyclin D1, and Arg1 in RAW 264.7 cells with CMs of Ctr-B477, OE-S100a9-B477, Ctr-G600, and sg-S100a9-G600 by western blotting. i, j Protein levels of S100a9, Cxcl12, pStat3, and Arg1 in RAW 264.7 cells treated with CMs from either B477 (i) or EMT6 (j) cell lines with either S100a9 protein (0.1 mg/ml) or S100a9 protein together with Tas inhibitor by western blotting. kl The protein levels of S100a9, Cxcl12, pStat3 and Arg1 in RAW264.7 cells treated with CMs from G600 (k) and OE-S100a9-EMT6 (l) cells without or with Tas, or AMD3465, or Tas and AMD3465 together, respectively, by western blotting. m, n The populations of S100a9 positive (m) and MDSC (n) cells in both blood and tumors tissues after doxycycline (DOX) induction for 48 h in WT-DOX and MT-DOX mice by FACS analysis with antibodies of S100a9 and CD11b/Gr1(n = 4 mice/group) (FACS gating strategies see in Supplementary Fig. 8d). o, p MDSC populations from the blood of tumor-bearing mice with implantation of B477 (o) or G600 (p) cells without or with the expression of sgS100a9 by FACS analysis (n = 4 mice/group) (FACS gating strategies see in Supplementary Fig. 8e). q, r MDSC from breast tumor tissues (q) and blood samples (r) in Balb/c mice with fat pad implantation of Ctr-EMT6 cells, or OE-S100a9-EMT6 cells, or OE-Cxcl12 cells, or OE-S100a9/sgCxcl12 cells by CyTOF analysis (n = 6–10 mice in each group and randomly mixed them into 3 samples to do CyTOF analysis, q panel: 6 from Ctr, 10 from OE-S100a9, 8 from OE-Cxcl12, 8 from OE-S100a9/sgCxcl12, r panel: 6 from Ctr, 10 from OE-S100a9, 8 from OE-Cxcl12, 8 from OE-S100a9/sgCxcl12, gating strategies see in Supplementary Fig. 8a). The data are expressed as means ± SD (c, e, g, m, n, q, r) and P values determined by one-way ANOVA followed by Tukey’s multiple comparisons. The experiments were independently repeated three times with similar results (al). Source data are provided as a Source data file.
Fig. 7
Fig. 7. Efficiency of combinatory treatments for breast cancer.
a, b Representative tumor images (a) and volume (b) from Balb/C mice after 35 days pad implantation with EMT6-Ctr cells, sgS100A9-EMT6, and sgCxcl12-EMT6 cells at 1 × 106 cells per fat pad (n = 15 mice). c Proliferation of EMT6 cells and EMT6 cells expressing either sgS100a9 or sgCxcl12 in vitro. d The percent of different immune cells in tumor tissues without or with expression of sgS100a9 and sgCxcl12 in Balb/C mice by CyTOF analysis with antibodies to CD3/CD4, CD3/CD8, CD11b/Ly6G, CD11b/Ly6C, and CD3/CD28 (n = 3 mice/group). e CXCL12 expression in either BRCA1-high and S100A9-low (n = 498) or BRCA1-low and S100A9-high (n = 160) breast cancer patients from the TCGA breast database. f Overall survival of breast cancer patients with low expression of BRCA1 and high expression of S100A9 from the GSE19783-GPL6480 database (n = 216). g, h Tumor volumes and representative images of tumors formed from 231 cells without or with expression of sgS100A9 in nude mice (n = 9 mice/group). il Outline of treatment strategy with PBS (n = 10 mice), PD1 antibody (n = 6 mice), Tas (n = 3 mice), or PD1 antibody together with Tas (n = 5 mice) for Brca1-MT mice (i). Volumes and numbers of tumors (j), representative images of lungs and livers (k), and sections of the primary tumor (l) before treatment (left) and the residual mammary tissue of the same mouse after treatment (right). PD1 antibody was administered at day one (D1) and D21, respectively, after removing the primary tumor when the size of tumors reached 1 cm in size. Other drugs were used every day starting from D2. m, n Tumor images (m) and volume (n) at D29 from FVB mice with fat pad implantation of 545 cells and treatment with PBS and αPD1 (n = 7 mice/group). o, p Tumor volumes and representative images at the D29 from FVB mice with implantation of 545 cells (4 × 106 cells/fat pad) and treatment with PBS (n = 6 mice), AMD3465 (AMD) + αPD1 (n = 7 mice), and Tas + αPD1 (n = 7 mice). q, r Immune cell populations in CD45+ cells from the same cohorts of mice in (M-P) by CyTOF analysis at D13 and D29 (n = 3 mice/group, CyTOF gating strategies see in Supplementary Fig. 8a). The data are expressed as means ± SD (b, d, g, j, n, p) and P values determined by unpaired two-tailed Student’s t test (g, n) and by one-way ANOVA followed by Tukey’s multiple comparisons (b, d, j, p, q, r). The experiments were independently repeated three times with similar results (c). Scale bar: black color, 100 μM. Source data are provided as a Source data file.
Fig. 8
Fig. 8. Schematic for the mechanisms by which BRCA1 deficiency in breast cancer formation and improves responses to anti–PD1 antibody.
In BRCA1 deficiency epithelial cells, S100A9 expression level constantly increases in early stages and secrets out to recruit and activate MDSCs, which creates an immunosuppression microenvironment by inhibit expansion and activation of T cells. This process can be further enhanced by CXCL12 that positively regulated by S100A9 and form a positive feedback loop. And this immunosuppression microenvironment is beneficial for tumor growth. The inhibitors of S100A9 and CXCL12, Tasquinimod and AMD3465, combine with anti-PD1 antibody can rescue the immunosuppression microenvironment and repress tumor growth. Green arrows indicate a decrease; red arrows indicate an increase.

References

    1. Narod SA, Foulkes WD. BRCA1 and BRCA2: 1994 and beyond. Nat. Rev. Cancer. 2004;4:665–676. - PubMed
    1. Takaoka M, Miki Y. BRCA1 gene: function and deficiency. Int J. Clin. Oncol. 2018;23:36–44. - PubMed
    1. Bianchini G, Balko JM, Mayer IA, Sanders ME, Gianni L. Triple-negative breast cancer: challenges and opportunities of a heterogeneous disease. Nat. Rev. Clin. Oncol. 2016;13:674–690. - PMC - PubMed
    1. Sharma B, Preet Kaur R, Raut S, Munshi A. BRCA1 mutation spectrum, functions, and therapeutic strategies: the story so far. Curr. Probl. Cancer. 2018;42:189–207. - PubMed
    1. Miao K, et al. NOTCH1 activation compensates BRCA1 deficiency and promotes triple-negative breast cancer formation. Nat. Commun. 2020;11:3256. - PMC - PubMed

Publication types