. 2022 Mar 18;13(1):1478.
doi: 10.1038/s41467-022-29125-7.

N7-methylguanosine tRNA modification promotes esophageal squamous cell carcinoma tumorigenesis via the RPTOR/ULK1/autophagy axis

Affiliations

N7-methylguanosine tRNA modification promotes esophageal squamous cell carcinoma tumorigenesis via the RPTOR/ULK1/autophagy axis

Hui Han et al. Nat Commun. .

Abstract

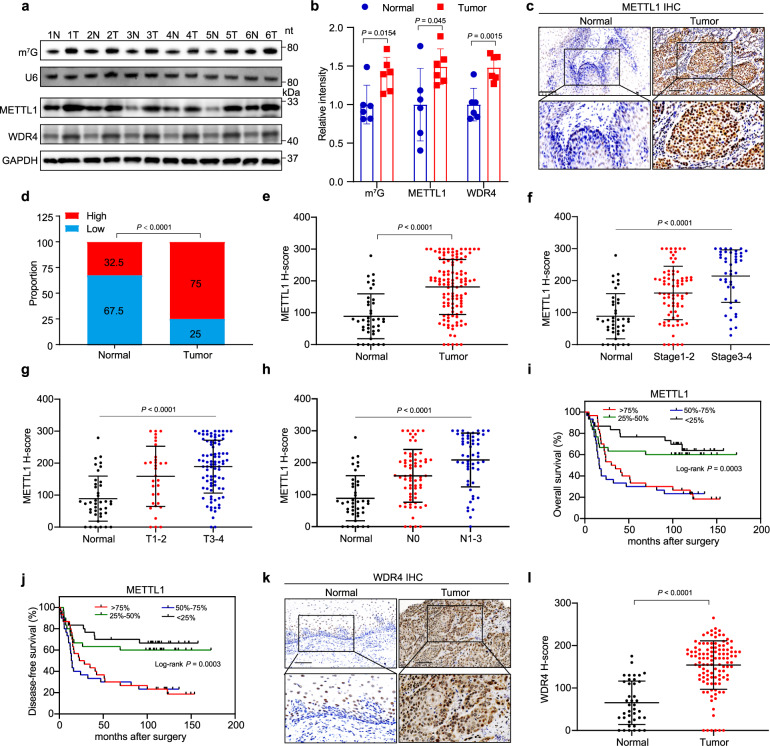
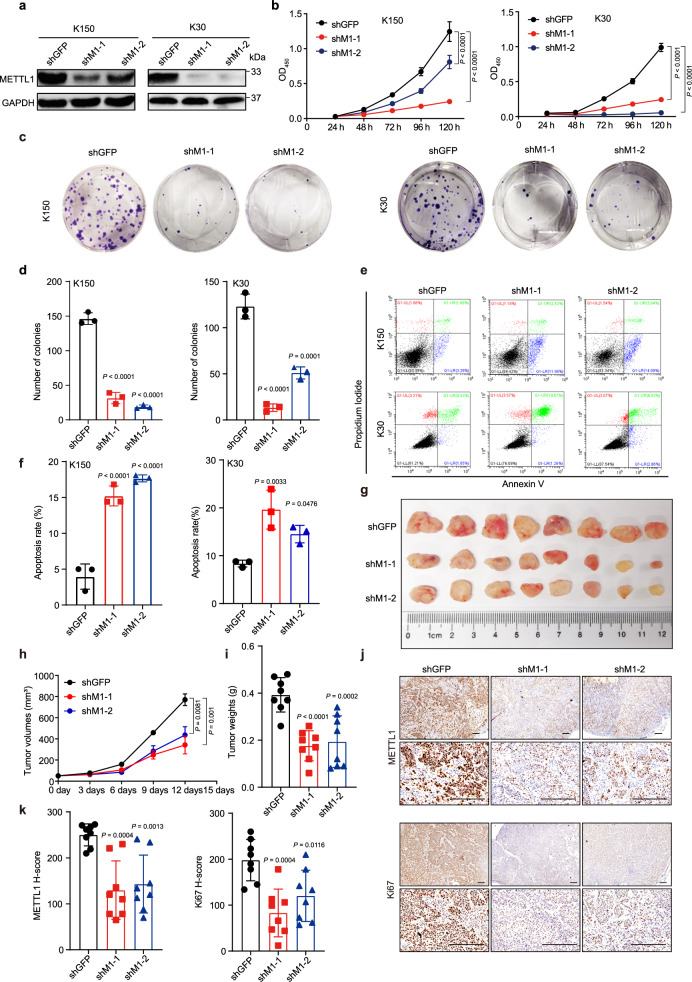
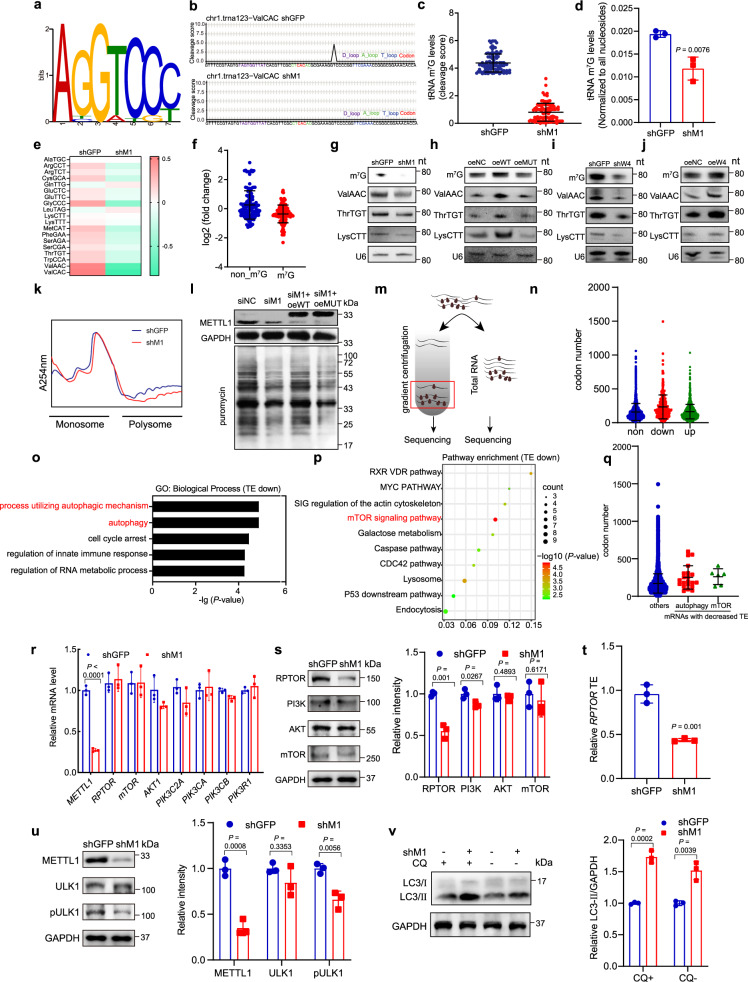
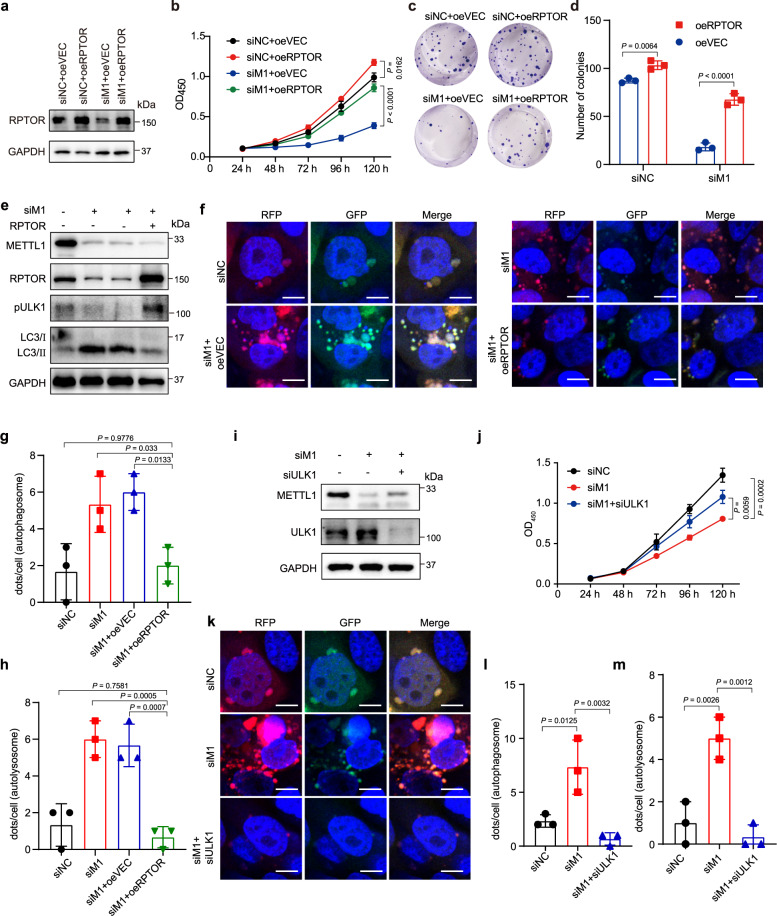
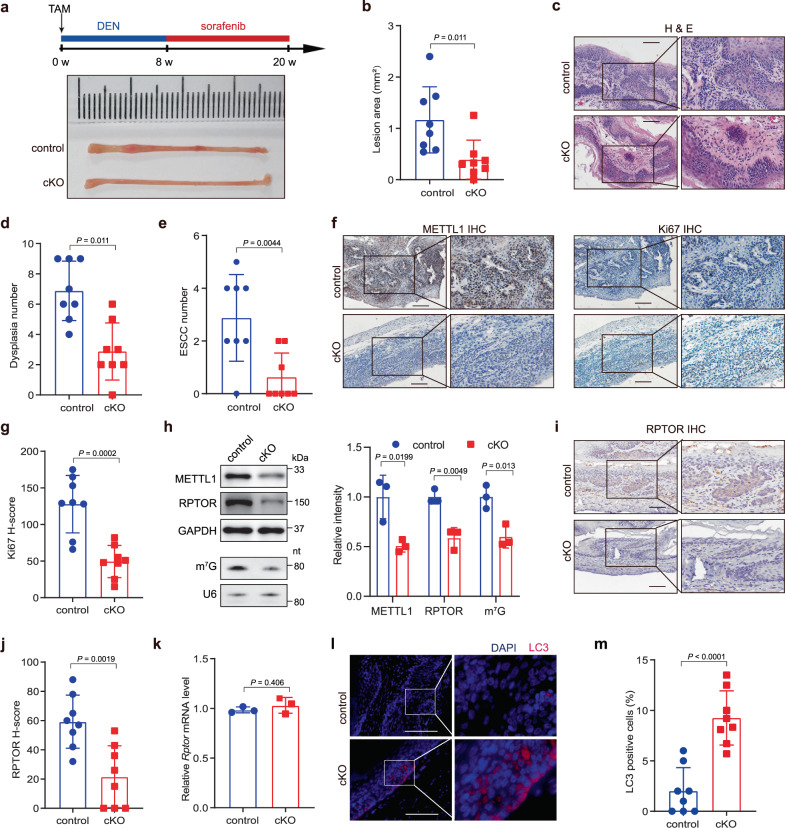
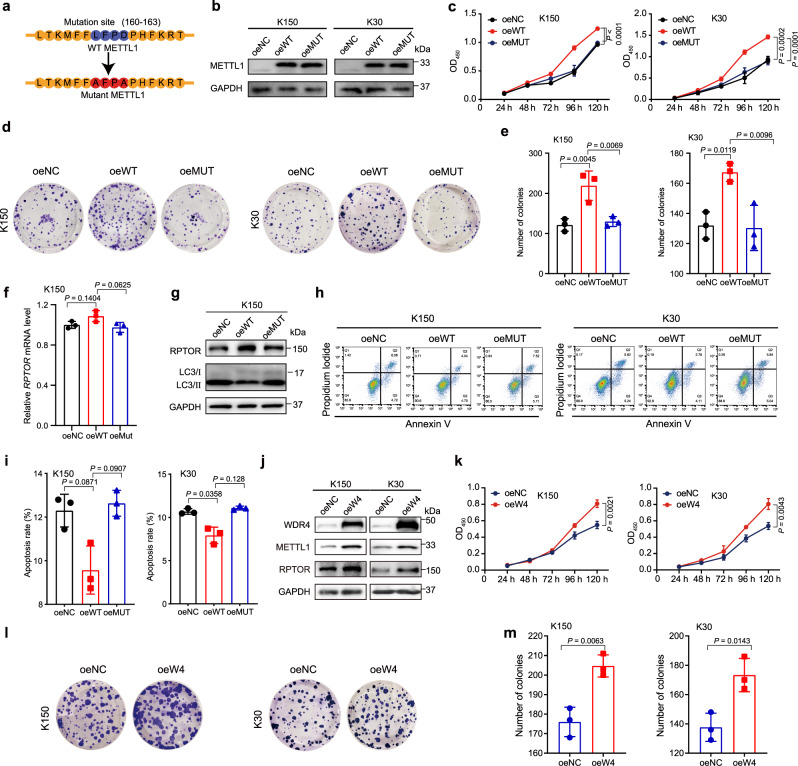
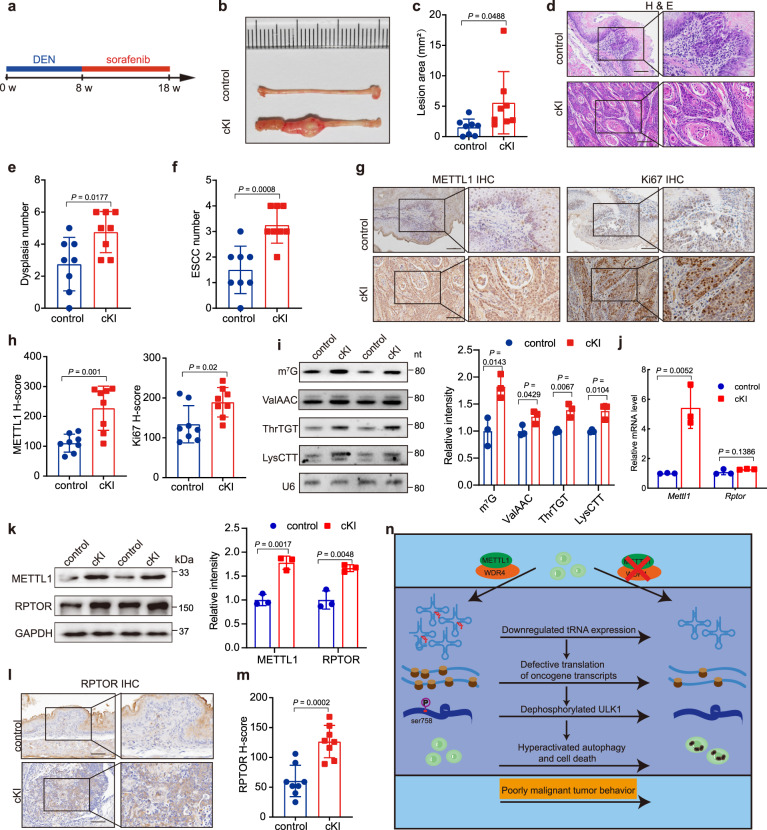
Mis-regulated RNA modifications promote the processing and translation of oncogenic mRNAs to facilitate cancer progression, while the molecular mechanisms remain unclear. Here we reveal that tRNA m7G methyltransferase complex proteins METTL1 and WDR4 are significantly up-regulated in esophageal squamous cell carcinoma (ESCC) tissues and associated with poor ESCC prognosis. In addition, METTL1 and WDR4 promote ESCC progression via the tRNA m7G methyltransferase activity in vitro and in vivo. Mechanistically, METTL1 or WDR4 knockdown leads to decreased expression of m7G-modified tRNAs and reduces the translation of a subset of oncogenic transcripts enriched in RPTOR/ULK1/autophagy pathway. Furthermore, ESCC models using Mettl1 conditional knockout and knockin mice uncover the essential function of METTL1 in promoting ESCC tumorigenesis in vivo. Our study demonstrates the important oncogenic function of mis-regulated tRNA m7G modification in ESCC, and suggest that targeting METTL1 and its downstream signaling axis could be a promising therapeutic target for ESCC treatment.


Conflict of interest statement

The authors declare no competing interests.

Figures

Fig. 1
Fig. 1. METTL1 is elevated in ESCCs and is a negative prognostic factor for ESCC patients.
a, b Blotting assays (a) and the quantitative analysis (b) of METTL1, WDR4, and m7G levels in ESCC tumors and adjacent control normal tissues. N, Normal. T, Tumor. c Representative images of METTL1 IHC staining in esophageal tumor tissues and adjacent normal tissues. Scale bar, 100 μm. d Proportion of METTL1 expression cases in adjacent normal tissues and esophageal tumor tissues. e Quantification of METTL1 H-scores in esophageal tumor tissues and adjacent normal tissues. f Quantification of METTL1 H-scores in adjacent normal tissues and different stages of esophageal tumor tissues. g Quantification of METTL1 H-scores in adjacent normal tissues and different grades of esophageal tumor tissues. h Quantification of METTL1 H-scores in adjacent normal tissues and esophageal tumor tissues with different stages of lymph node metastasis. i, j Kaplan–Meier analysis of the overall survival (i) and disease-free survival (j) of ESCC patients based on H-scores of METTL1. k Representative images of WDR4 IHC staining in esophageal tumor tissues and adjacent normal tissues. l Quantification of WDR4 H-scores in esophageal tumor tissues and adjacent normal tissues. Data are presented as mean ± SD from six independent patient samples for (b) and 120 patient samples for (c, eh, and l). P values are indicated by two-tailed unpaired Student’s t test for (b), Pearson chi-square test for (d), Mann–Whitney U test for (e, l), Kruskal–Wallis test for (fh), and log-rank test for (i, j). Source data are provided as a Source data file. The source data of (i, j) are protected and are not available due to data privacy laws.
Fig. 2
Fig. 2. METTL1 knockdown impairs ESCC progression in vitro and in xenograft model.
a Western blotting of METTL1 in K150 and K30 ESCC cells. b Cell Counting Kit-8 assay (CCK8) of cell growth with METTL1 knockdown and control cells. c, d Colony-formation assay (c) and the quantitative analysis (d) of METTL1 knockdown and control cells. e, f Apoptosis assay (e) and the quantitative analysis (f) of METTL1 knockdown and control cells. g Overview of tumors in xenograft mice model subcutaneously implanted with METTL1 knockdown and control K150 ESCC cells. h Growth curves of tumor volumes in METTL1 knockdown and control K150 ESCC cells. i Tumor weights in METTL1 knockdown and control K150 ESCC cells. j, k Representative images of METTL1 and Ki67 IHC staining (j) and the quantitative H-scores (k) of tumors obtained from the K150 xenograft model. Scale bar, 200 μm. Data represented as mean ± SD from three independent experiments for (b, d, and f), and eight biological independent samples for (hk). Significant difference from control group calculated by one-way ANOVA with Dunnett’s multiple comparison test was indicated on graph. Source data are provided as a Source data file.
Fig. 3
Fig. 3. METTL1 regulates tRNA m7G modification, tRNA expression, and oncogenic mRNA translation.
a Motif sequence at m7G site. b Representative image of cleavage score. c Quantification of m7G level on m7G-modified tRNAs. d LC-MS-based detection of m7G tRNA modification levels on tRNAs. e Expression profile of m7G-modified tRNAs in the METTL1 knockdown and control cells. Each cell shows the relative expression of all isodecoders of a specific tRNA type. Expression of each tRNA type was normalized by its overall average level in both groups and transformed by log2. f Mann–Whitney U test on the expression of the m7G-modified and non-m7G tRNAs. gj Northern blot of indicated tRNAs. U6 snRNA was used as a loading control. k Polysome profiling of METTL1 depleted and control K150 cells. l Puromycin intake assay of K150 cells. m Schematic of polyribosome-seq. n The numbers of m7G tRNA-decoded codons in mRNAs with upregulated TEs (up), downregulated TEs (down), and unaltered TEs (non) in the METTL1 depleted cells. o Gene ontology analysis using the TE-down genes. p Pathway analysis using the TE-down genes. q m7G tRNA-decoded codon numbers in TE-decreased mRNAs enriched in the negative regulation of autophagy or mTOR signaling pathway and other mRNAs. r qRT-PCR analysis of representative genes in K150 cells. s Western blot analysis of indicated proteins in K150 cells, right panel: quantification of the western blot signals. t qRT-PCR based TE analysis of RPTOR using the polyribosome mRNAs. u Western blot analysis of ULK1 and pULK1 in K150 cells, right panel: quantification of the western blot signals. v Western blot analysis of LC3 in K150 cells, right panel: quantification of the western blot signals. Data presented as mean ± SD from two independent biological samples for each group for (c, e, and f), three independent biological samples for (d), one biological sample for (n, q), and three independent experiments for (rv). P values are calculated by Mann–Whitney U test for (c, f, n, and q), and two-tailed unpaired Student’s t test for (d, r, s, t, u, and v). Source data are provided as a Source data file.
Fig. 4
Fig. 4. METTL1/RPTOR/ULK1 axis plays essential roles in ESCC progression.
a Western blot analysis with indicated antibodies in METTL1 knockdown K150 cells with or without RPTOR overexpression. b CCK8 assay of METTL1 knockdown K150 cells with or without RPTOR overexpression. c, d Colony-formation assay (c) and the quantification analysis (d) of METTL1 knockdown K150 cells with or without RPTOR overexpression. e Western blot analysis with indicated antibodies in METTL1 knockdown K150 cells with or without RPTOR overexpression. fh The autophagic fluxes (f) and the quantification analysis (g, h) of K150 cells stably expressed mRFP-EGFP-LC3 fusion protein. Scale bar, 10 μm. i Western blot analysis with indicated antibodies. j CCK8 assay of METTL1 knockdown K150 cells with or without ULK1 knockdown. km The autophagic fluxes (k) and the quantification analysis (l, m) of K150 cells stably expressed mRFP-EGFP-LC3 fusion protein. Scale bar, 10 μm. Data represented as mean ± SD from three independent experiments. P values are presented by one-way ANOVA with Tukey’s multiple comparison test for (b, d), and one-way ANOVA with Dunnett’s multiple comparison test for (g, jh, and l, m).
Fig. 5
Fig. 5. Knockout of Mettl1 inhibits in vivo ESCC tumorigenesis.
a Experimental design for ESCC tumorigenesis model and the representative images of esophageal lesions from Mettl1 cKO and control mice. b Quantification of lesion areas in Mettl1 cKO and control mice. c Representative H&E staining of esophagus tissues in Mettl1 cKO and control mice. Scale bar, 100 μm. d Quantification of dysplasia numbers in Mettl1 cKO and control mice. e Quantification of ESCC numbers in Mettl1 cKO and control mice. f, g Representative images of METTL1 and Ki67 IHC staining (f) and the quantification of Ki67 H-scores (g) in Mettl1 cKO and control mice. Scale bar, 100 μm. h Western blot analysis and northwestern blot analysis showed the m7G modification level and indicated protein levels, right panel: quantification of the blot signals, n = 3 biological independent samples for each group. i, j Representative images (i) and the quantification of H-scores (j) of RPTOR IHC staining in Mettl1 cKO and control mice. Scale bar, 100 μm. k qRT-PCR analysis of Rptor mRNA level in cKO and control mice, n = 3 biological independent samples for each group. l, m IF assay (l) and the quantification (m) of LC3 levels in Mettl1 cKO and control mice. Scale bar, 100 μm. Data represented as mean ± SD by two-tailed unpaired Student’s t test for all. n = 8 mice for each group for (ag, i, j, and l, m).
Fig. 6
Fig. 6. Overexpression of METTL1 or WDR4 promotes ESCC progression.
a The catalytic mutation site of METTL1. b Western blot confirmed the overexpression of wild-type METTL1 (oeWT) and catalytic inactive METTL1 (oeMUT) compared with the negative control (oeNC) in ESCC cells. c CCK8 assay of growth of oeNC, oeWT, and oeMUT ESCC cells. d, e Colony-formation assay (d) and the quantification analysis (e) of oeNC, oeWT, and oeMUT ESCC cells. f qRT-PCR assay of RPTOR mRNA level. g Western blot assay showed the indicated protein levels. h, i Apoptosis assay (h) and the quantitative analysis (i) of METTL1 overexpression and control cells. j Western blot assay showed the indicated protein levels. k CCK8 assay of growth of oeNC and oeWDR4 ESCC cells. l, m Colony-formation assay (l) and the quantification analysis (m) of oeNC and oeWDR4 ESCC cells. Data represented as mean ± SD from three independent experiments. P values are presented by one-way ANOVA with Dunnett’s multiple comparison test for (c, e, f, and i), and two-tailed unpaired Student’s t test for (k and m).
Fig. 7
Fig. 7. METTL1 overexpression promotes in vivo ESCC tumorigenesis.
a Experimental design for ESCC tumorigenesis model in Mettl1 cKI and control mice. b Representative images of esophageal lesions from Mettl1 cKI and control mice. c Quantification of lesion areas in Mettl1 cKI and control mice. d Representative H&E staining of esophagus tissues in Mettl1 cKI and control mice. Scale bar, 100 μm. e, f Quantification of dysplasia numbers (e) and ESCC numbers (f) in Mettl1 cKI and control mice. g, h Representative images (g) and the quantification (h) of METTL1 and Ki67 IHC staining in Mettl1 cKI and control mice. Scale bar, 100 μm. i Northwestern blot and northern blot detected the m7G level and m7G-modified tRNA expression level in tumors from Mettl1 cKI and control mice, right panel: quantification of the blot signals. j qRT-PCR assay showed the mRNA levels of indicated mRNAs. k Western blot showed the indicated protein levels in the cKI and control mice, right panel: quantification of the western blot signals. l, m Representative images (l) and the quantification (m) of RPTOR IHC staining in Mettl1 cKI and control mice. Scale bar, 100 μm. n Working model for METTL1/WDR4 mediated tRNA m7G modification in regulation of ESCC tumorigenesis. Data represented as mean ± SD by two-tailed unpaired Student’s t test for all. n = 3 biological independent samples for (ik) and n = 8 biological independent samples for (bh and l, m).

References

    1. Bray F, et al. Global cancer statistics 2018: GLOBOCAN estimates of incidence and mortality worldwide for 36 cancers in 185 countries. CA Cancer J. Clin. 2018;68:394–424. - PubMed
    1. Ferlay J, et al. Estimating the global cancer incidence and mortality in 2018: GLOBOCAN sources and methods. Int. J. Cancer. 2019;144:1941–1953. - PubMed
    1. Cancer Genome Atlas Research, N. et al. Integrated genomic characterization of oesophageal carcinoma. Nature. 2017;541:169–175. - PMC - PubMed
    1. Smyth EC, et al. Oesophageal cancer. Nat. Rev. Dis. Prim. 2017;3:17048. - PMC - PubMed
    1. Liu J, et al. Which factors are associated with actual 5-year survival of oesophageal squamous cell carcinoma? Eur. J. Cardio-Thorac. Surg. 2011;41:e7–e11. - PubMed

Publication types

MeSH terms