. 2022 Mar 18;13(1):1453.
doi: 10.1038/s41467-022-29191-x.

Aged bone matrix-derived extracellular vesicles as a messenger for calcification paradox

Affiliations

Aged bone matrix-derived extracellular vesicles as a messenger for calcification paradox

Zhen-Xing Wang et al. Nat Commun. .

Abstract

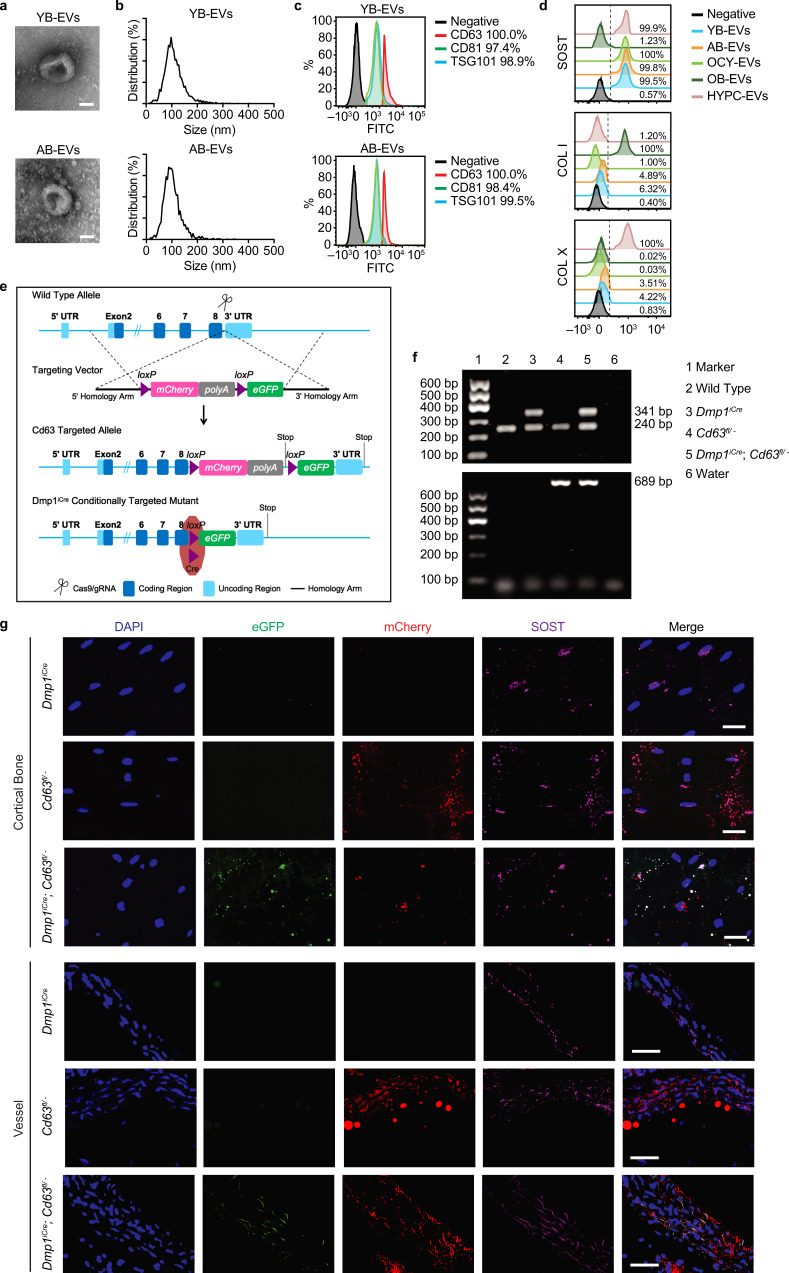
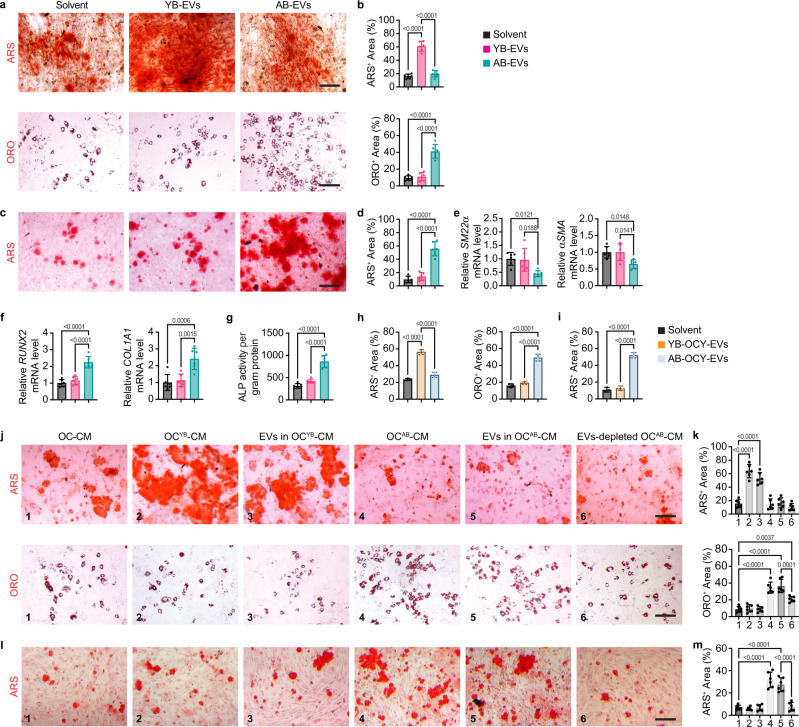
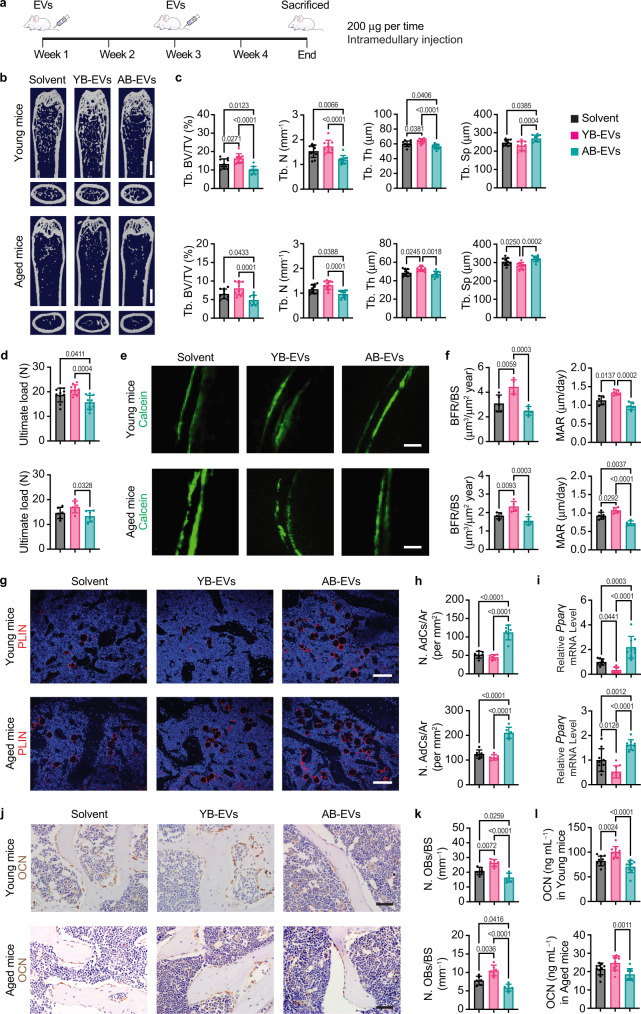
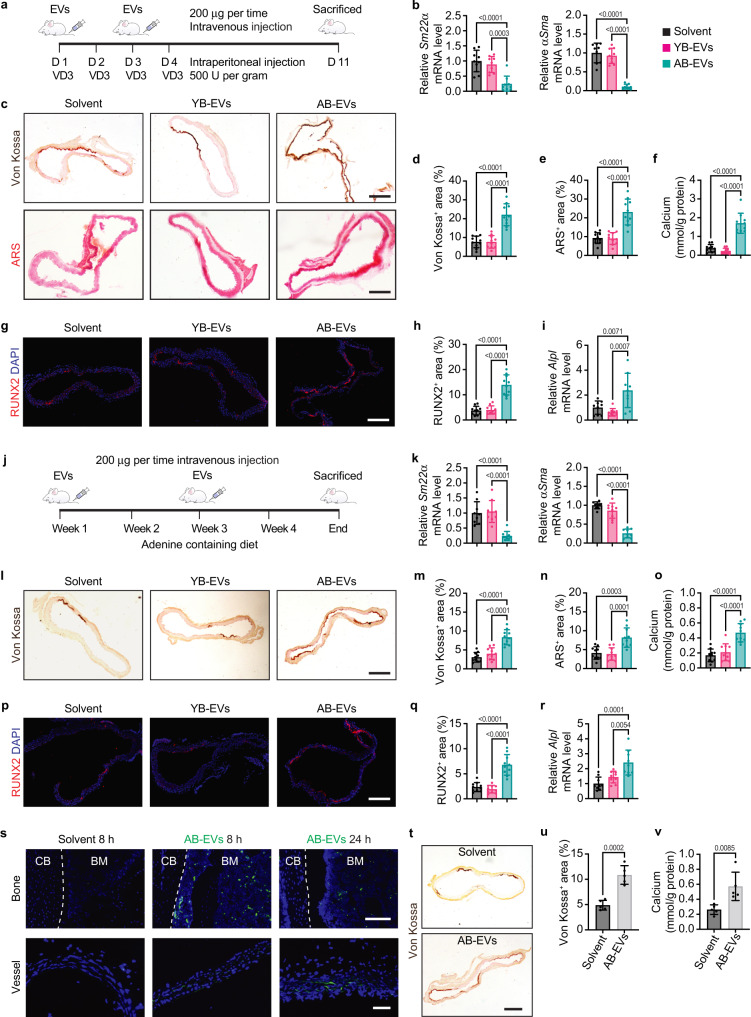
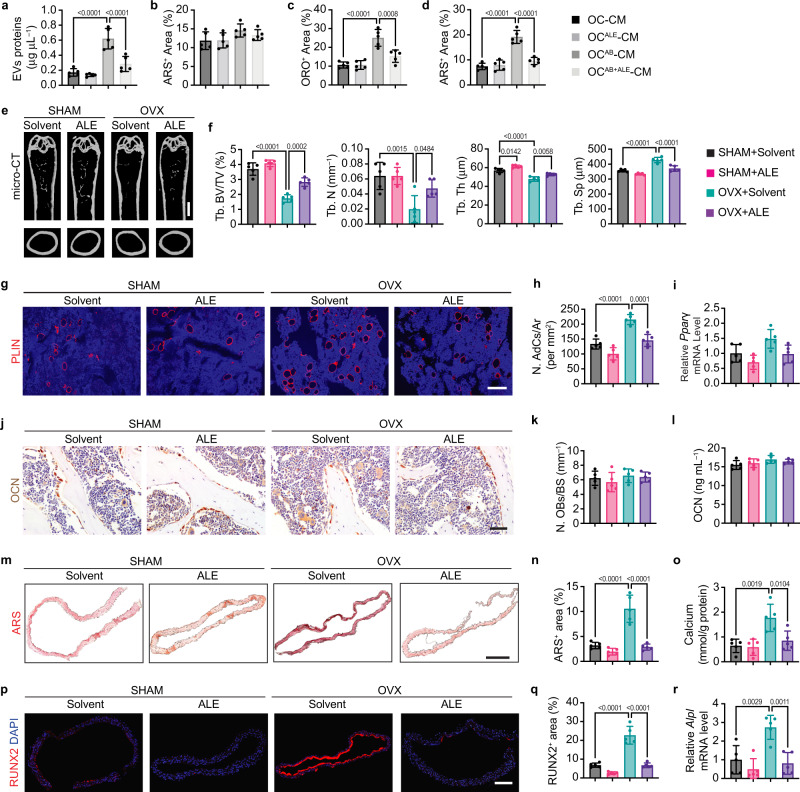
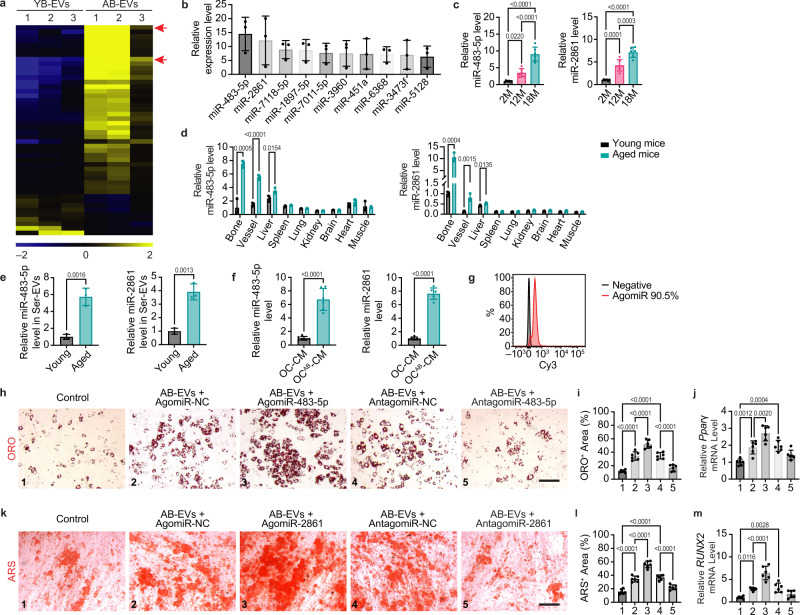
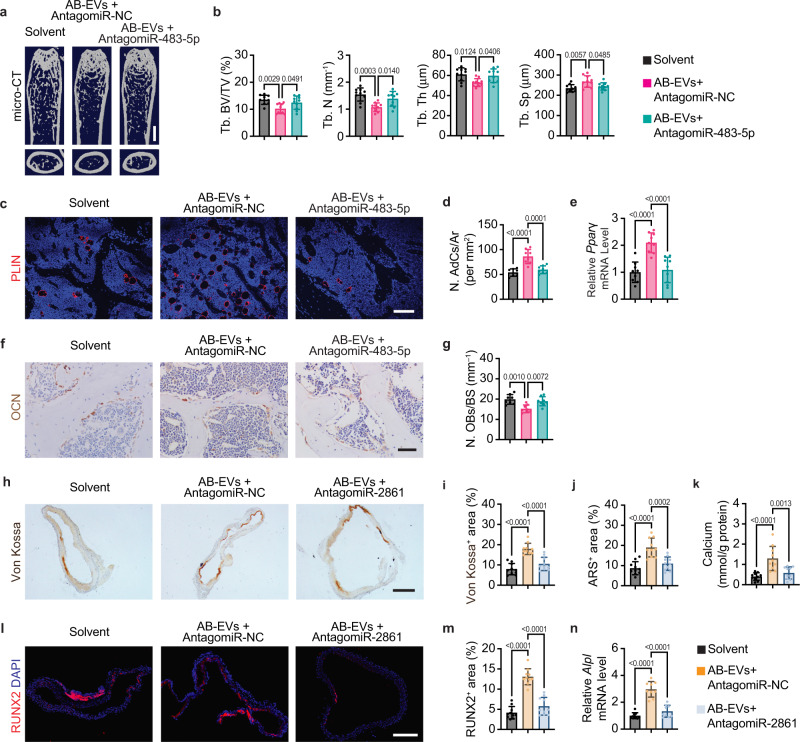
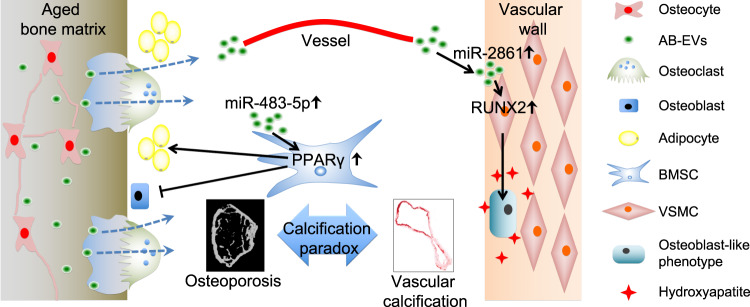
Adipocyte differentiation of bone marrow mesenchymal stem/stromal cells (BMSCs) instead of osteoblast formation contributes to age- and menopause-related marrow adiposity and osteoporosis. Vascular calcification often occurs with osteoporosis, a contradictory association called "calcification paradox". Here we show that extracellular vesicles derived from aged bone matrix (AB-EVs) during bone resorption favor BMSC adipogenesis rather than osteogenesis and augment calcification of vascular smooth muscle cells. Intravenous or intramedullary injection of AB-EVs promotes bone-fat imbalance and exacerbates Vitamin D3 (VD3)-induced vascular calcification in young or old mice. Alendronate (ALE), a bone resorption inhibitor, down-regulates AB-EVs release and attenuates aging- and ovariectomy-induced bone-fat imbalance. In the VD3-treated aged mice, ALE suppresses the ovariectomy-induced aggravation of vascular calcification. MiR-483-5p and miR-2861 are enriched in AB-EVs and essential for the AB-EVs-induced bone-fat imbalance and exacerbation of vascular calcification. Our study uncovers the role of AB-EVs as a messenger for calcification paradox by transferring miR-483-5p and miR-2861.


Conflict of interest statement

The authors declare no competing interests.

Figures

Fig. 1
Fig. 1. Identification and characterization of B-EVs.
ad, Morphology (a), diameter distribution (b), exosomal marker analysis (c), and expression of SOST, COL I, and COL X (d) in the indicated EVs. Scale bar: 50 nm. e Schematic diagram of the gene targeting strategy for the generation of Cd63em(loxp-mCherry-loxp-eGFP)3 mice by inserting a mCherry reporter gene flanked by two loxP sites and an eGFP reporter gene in the stop codon in exon 8 at the 3’ UTR of Cd63 gene. f PCR genotyping of wild-type mice, Dmp1iCre mice, Cd63em(loxp-mCherry-loxp-eGFP)3 mice, and Dmp1iCre; Cd63em(loxp-mCherry-loxp-eGFP)3 mice using primers for determining the insertion of iCre (up) and eGFP (down). n = 3 biologically independent animals. g Localization of eGFP (green) and mCherry (red), and immunofluorescence staining for SOST (purple) in bone and vessel from Dmp1iCre mice, Cd63em(loxp-mCherry-loxp-eGFP)3 mice, and Dmp1iCre; Cd63em(loxp-mCherry-loxp-eGFP)3 mice. Scale bar: 20 μm (for bone) or 50 μm (for vessel). n = 3 biologically independent animals. Experiments in ad were repeated independently three times with similar results. Experiments in fg were repeated independently two times with similar results. The illustrated results represented one of the three or two independent experiments. Source data are provided as a Source Data file.
Fig. 2
Fig. 2. AB-EVs favor adipogenesis rather than osteogenesis of BMSCs and augment osteogenic transdifferentiation of VSMCs.
a,b, ARS or ORO staining of BMSCs treated with solvent, YB-EVs, or AB-EVs under osteogenic or adipogenic induction (a) and quantification of the percentages of ARS+ (red) and ORO+ (red) areas (b). Scale bar: 50 μm. n = 6 biologically independent cells per group. cg, ARS staining (c), quantification of the percentage of ARS+ areas (red; d), qRT-PCR analysis of SM22α and αSMA (e), RUNX2 and COL1A1 (f) expression, and ALP activity (g) in VSMCs treated with solvent, YB-EVs, or AB-EVs under osteogenic induction. Scale bar: 50 μm. n = 6 biologically independent cells per group. h Quantification of the percentages of ARS+ and ORO+ areas in BMSCs treated with solvent, YB-OCY-EVs, or AB-OCY-EVs under osteogenic or adipogenic induction. n = 3 biologically independent cells per group. i Quantification of the percentages of ARS+ areas in VSMCs treated with solvent, YB-OCY-EVs, or AB-OCY-EVs under osteogenic induction. n = 3 biologically independent cells per group. jk, ARS and ORO staining (j) and quantification of the percentages of ARS+ (red) and ORO+ (red) areas (k) in BMSCs with different treatments under osteogenic or adipogenic induction. OC: osteoclasts; CM: conditioned media. Scale bar: 50 μm. n = 6 biologically independent cells per group. lm, ARS staining (l) and quantification of the percentage of ARS+ areas (red; m) in VSMCs with different treatments under osteogenic induction. Scale bar: 50 μm. n = 6 biologically independent per group. Experiments in ad and hm were repeated independently three times with similar results. The illustrated results represented one of the three independent experiments. Experiments in eg were performed with six biological replicates per group without independent repetition. Data were presented as mean ± SD. Statistical significance was determined by one-way ANOVA with Bonferroni post hoc test. Source data are provided as a Source Data file.
Fig. 3
Fig. 3. AB-EVs promote bone-fat imbalance in young and aged mice.
a Schematic diagram of the experimental design for assessing the effects of YB-EVs and AB-EVs on bone phenotypes in young and aged mice. b μCT-reconstructed images of femurs. Scale bars: 1 mm. c Quantification of Tb. BV/TV, Tb. N, Tb. Th, and Tb. Sp. n = 10 biologically independent animals per group. d Ultimate load values of femurs. n = 10 biologically independent animals for young mice. n = 6 biologically independent animals for aged mice. ef, Calcein (green) double labeling of trabecular bones (e) and quantification of BFR/BS and MAR (f). Scale bar: 25 μm. n = 5 biologically independent animals per group. gh, PLIN immunofluorescence staining images of femur sections (g) and quantification of the number of PLIN+ (red) adipocytes in bone marrow (h). Scale bar: 100 μm. n = 6 biologically independent animals per group. i qRT-PCR for Pparγ expression in femurs. n = 9 biologically independent animals per group. jk, OCN immunohistochemical staining images (j) and the number of OCN-stained (brown) osteoblasts (N. OBs) on the trabecular bone surface (BS) (k). Scale bar: 50 μm. n = 6 biologically independent animals per group. l ELISA for serum OCN. n = 10 biologically independent animals per group. All experiments were performed with at least five biological replicates per group without independent repetition. Data were presented as mean ± SD. Statistical significance was determined by one-way ANOVA with Bonferroni post hoc test. Source data are provided as a Source Data file.
Fig. 4
Fig. 4. AB-EVs exacerbate vascular calcification.
a Experimental design of the VD3-induced acute vascular calcification mouse models treated with solvent, YB-EVs, or AB-EVs by intravenous injection. b qRT-PCR analysis of Sm22α and αSma expression in abdominal aortas of mice in (a). n = 9 biologically independent animals per group. ce, Von Kossa and ARS staining images (c) and quantification of the percentages of Von Kossa+ (brownish black; d) and ARS+ (red; e) areas. Scale bar: 200 μm. n = 10 biologically independent animals per group. f Vascular calcium content measurement. n = 10 biologically independent animals per group. gh, RUNX2 immunofluorescence staining images (g) and quantification of the percentage of RUNX2+ (red) areas (h). Scale bar: 200 μm. n = 10 biologically independent animals per group. i qRT-PCR analysis of Alpl expression. n = 9 per group. j Experimental design of the adenine-induced chronic vascular calcification mouse models treated with solvent, YB-EVs, or AB-EVs by intravenous injection. k qRT-PCR analysis of Sm22α and αSma expression in abdominal aortas of mice in (j). n = 9 biologically independent animals per group. ln Von Kossa staining images (l) and quantification of the percentages of Von Kossa+ (brownish black; m) and ARS+ (red; n) areas. Scale bar: 200 μm. n = 10 biologically independent animals per group. o Vascular calcium content measurement. n = 10 biologically independent animals per group. p-q, RUNX2 immunofluorescence staining images (p) and quantification of the percentage of RUNX2+ (red) areas (q). Scale bar: 200 μm. n = 10 biologically independent animals per group. r qRT-PCR for Alpl expression. n = 9 biologically independent animals per group. s Fluorescence microscopy analysis of femur and abdominal aorta sections from mice treated with solvent or DiO (green)-labeled AB-EVs by intramedullary injection. CB: cortical bone; BM: bone marrow. Scale bar: 200 μm (for bone) or 50 μm (for vessel). n = 3 biologically independent animals per group. tv, Von Kossa staining images (t), quantification of the percentage of Von Kossa+ areas (brownish black; u), and vascular calcium content measurement (v) in abdominal aortas from the VD3-induced acute vascular calcification mouse models receiving solvent or AB-EVs treatment by intramedullary injection. Scale bar: 200 μm. n = 5 biologically independent animals per group. Experiment in s was repeated independently three times with similar results. The illustrated results represented one of the three independent experiments. The other experiments were performed with at least five biological replicates per group without independent repetition. Data were presented as mean ± SD. Statistical significance was determined by one-way ANOVA with Bonferroni post hoc test (at) or unpaired, two-tailed Student’s t-test (uv). Source data are provided as a Source Data file.
Fig. 5
Fig. 5. ALE down-regulates AB-EVs release and attenuates bone-fat imbalance and VD3-induced vascular calcification in aged OVX mice.
a Total protein contents of EVs isolated from the conditioned media of osteoclasts treated with solvent (OC-CM), ALE (OCALE-CM), AB (OCAB-CM), or AB + ALE (OCAB+ALE-CM). n = 5 biologically independent samples per group. bd, Quantification of the percentages of ARS+ (b) and ORO+ (c) areas in BMSCs with different treatments under osteogenic or adipogenic induction, or ARS+ areas (d) in VSMCs with different treatments under osteogenic induction. n = 5 biologically independent cells per group. ef μCT-reconstructed images of femurs from 16-month-old Sham or OVX mice in different groups (e) and quantification of Tb. BV/TV, Tb. N, Tb. Th, and Tb. Sp (f). Scale bars: 1 mm. n = 5 biologically independent animals per group. gh PLIN immunofluorescence staining images of femur sections (g) and quantification of the number of PLIN+ (red) adipocytes in bone marrow (h). Scale bar: 100 μm. n = 5 biologically independent animals per group. i qRT-PCR for Pparγ expression in femurs. n = 5 biologically independent animals per group. j–l OCN immunostaining images (j), quantification of the number of OCN-stained (brown) osteoblasts on BS (k), and ELISA for OCN (l). Scale bar: 50 μm. n = 5 biologically independent animals per group. mn ARS staining images (m) and quantification of the percentage of ARS+ areas (red; n). Scale bar: 200 μm. n = 5 biologically independent animals per group. o Vascular calcium content measurement. n = 5 biologically independent animals per group. pq, RUNX2 immunostaining images (p) and quantification of the percentage of RUNX2+ (red) areas (q). Scale bar: 200 μm. n = 5 biologically independent animals per group. r qRT-PCR for Alpl expression. n = 5 biologically independent animals per group. Experiments in bd were repeated independently three times with similar results. The illustrated results represented one of the three independent experiments. The other experiments were performed with at least five biological replicates per group without independent repetition. Data were presented as mean ± SD. Statistical significance was determined by two-way ANOVA with Bonferroni post hoc test. Source data are provided as a Source Data file.
Fig. 6
Fig. 6. miR-483-5p and miR-2861 are enriched in AB-EVs and responsible for the AB-EVs-induced promotion of adipogenesis of BMSCs and calcification of VSMCs.
a Heatmap showing the differentially expressed miRNAs (absolute fold change ≥ 1.5; P < 0.05) between AB-EVs and YB-EVs. n = 3 biologically independent samples per group. b Top ten most abundant miRNAs in AB-EVs relative to YB-EVs. n = 3 biologically independent samples per group. c-f, qRT-PCR analysis of miR-483-5p and miR-2861 expression in B-EVs from bone specimens of the mice at different ages (c; n = 6 biologically independent animals per group), in different tissues from 3-month-old or 18-month-old mice (d; n = 3 biologically independent animals per group), in Ser-EVs from young (27- to 31-year-old) or old (67- to 73-year-old) human donors (e; n = 3 biologically independent donors per group), and in OC-CM and OCAB-CM (f; n = 6 biologically independent samples per group). g, Flow cytometry histograms showing the presence of agomiR-NC-Cy3 indicator in AB-EVs. n = 3 biologically independent samples per group. hj ORO staining images (h), quantification of the percentage of ORO+ areas (red; i), and qRT-PCR for Pparγ expression (j) in BMSCs with different treatments under adipogenic induction. Scale bar: 50 μm. n = 6 biologically independent cells per group. km, ARS staining images (k), quantification of the percentage of ARS+ areas (red; l), and qRT-PCR for RUNX2 expression (m) in VSMCs with different treatments under osteogenic induction. Scale bar: 50 μm. n = 6 biologically independent cells per group. Experiments in ag were performed with at least three biological replicates per group without independent repetition. The other experiments were repeated independently three times with similar results. The illustrated results represented one of the three independent experiments. Data were presented as mean ± SD. Statistical significance was determined by one-way ANOVA with Bonferroni post hoc test (c, ij, and im) or unpaired, two-tailed Student’s t-test (df). Source data are provided as a Source Data file.
Fig. 7
Fig. 7. miR-483-5p and miR-2861 contribute to AB-EVs-induced marrow adiposity and calcification paradox.
a μCT-reconstructed images of femurs from 3-month-old young mice treated with solvent or AB-EVs pre-treated with antagomiR-NC or antagomiR-483-5p. Scale bars: 1 mm. b Quantification of Tb. BV/TV, Tb. N, Tb. Th, and Tb. Sp. n = 10 biologically independent animals per group. c–d PLIN immunofluorescence staining images (c) and quantification of the number of PLIN+ (red) adipocytes in bone marrow (d). Scale bar: 100 μm. n = 8 biologically independent animals per group. e qRT-PCR analysis of Pparγ expression. n = 9 biologically independent animals per group. fg, OCN immunostaining images (f) and quantification of the number of OCN+ (brown) osteoblasts on BS (g). Scale bar: 50 μm. n = 8 biologically independent animals per group. hj Von Kossa staining images (h), quantification of the percentage of Von Kossa+ (brownish black; i) and ARS+ (red; j) areas in abdominal aortas from the VD3-induced acute vascular calcification mouse models receiving solvent or AB-EVs pretreated with antagomiR-NC or antagomiR-2861. Scale bar: 200 μm. n = 10 biologically independent animals per group. k Vascular calcium content analysis. n = 10 biologically independent animals per group. lm, RUNX2 immunostaining images (l) and quantification of the percentage of RUNX2+ areas (red; m). Scale bar: 200 μm. n = 10 biologically independent animals per group. n, qRT-PCR for Alpl expression. n = 9 biologically independent animals per group. All experiments were performed with at least eight biological replicates per group without independent repetition. Data were presented as mean ± SD. Statistical significance was determined by one-way ANOVA with Bonferroni post hoc test. Source data are provided as a Source Data file.
Fig. 8
Fig. 8. Schematic diagram showing the role of AB-EVs as a messenger for calcification paradox by favoring BMSC adipogenesis and VSMC calcification via transferring miR-483-5p and miR-2861.
During bone resorption, AB-EVs secreted by osteocytes are released from bone matrix into bone marrow, where AB-EVs promote PPARγ expression and adipogenic differentiation of BMSCs rather than osteogenesis by delivering miR-483-5p, thus leading to bone-fat imbalance and osteoporosis. AB-EVs are also transported into circulation and deposited in blood vessels to stimulate RUNX2 expression and osteogenic transition of VSMCs via transferring miR-2861, thereby causing vascular calcification.

Similar articles

Cited by

References

    1. Chen CY, et al. Extracellular vesicles from human urine-derived stem cells prevent osteoporosis by transferring CTHRC1 and OPG. Bone Res. 2019;7:18. - PMC - PubMed
    1. Tang Q, et al. Microporous polysaccharide multilayer coated BCP composite scaffolds with immobilised calcitriol promote osteoporotic bone regeneration both in vitro and in vivo. Theranostics. 2019;9:1125–1143. - PMC - PubMed
    1. Silva AM, et al. Long noncoding RNAs: a missing link in osteoporosis. Bone Res. 2019;7:10. - PMC - PubMed
    1. Li CJ, et al. Long noncoding RNA Bmncr regulates mesenchymal stem cell fate during skeletal aging. J. Clin. Invest. 2018;128:5251–5266. - PMC - PubMed
    1. Gu W, et al. Role of NFATc1 in the Bone-Vascular Axis Calcification Paradox. J. Cardiovasc Pharm. 2020;75:200–207. - PubMed

Publication types

LinkOut - more resources