. 2022 Mar 18;12(1):4682.
doi: 10.1038/s41598-022-08245-6.

Analysis tools for single-monomer measurements of self-assembly processes

Affiliations

Analysis tools for single-monomer measurements of self-assembly processes

Maria Hoyer et al. Sci Rep. .

Abstract

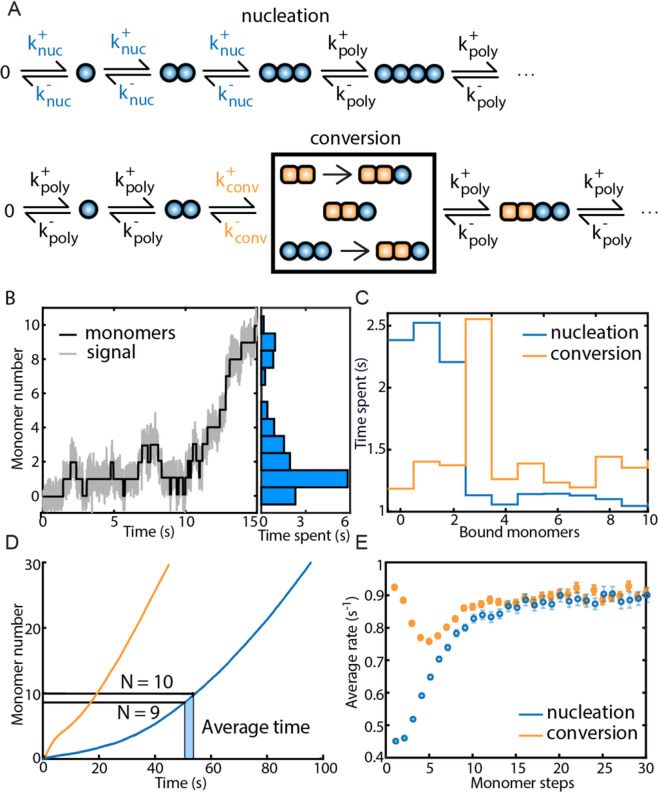
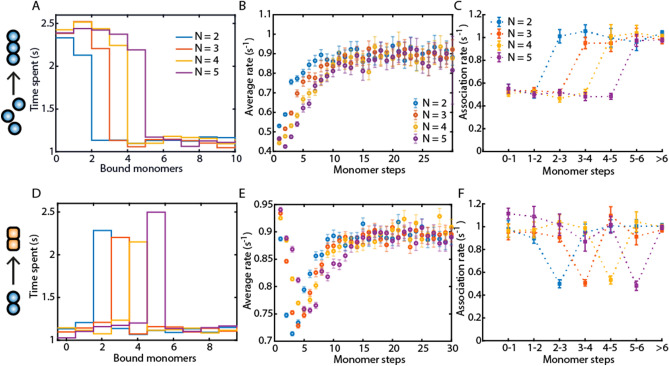
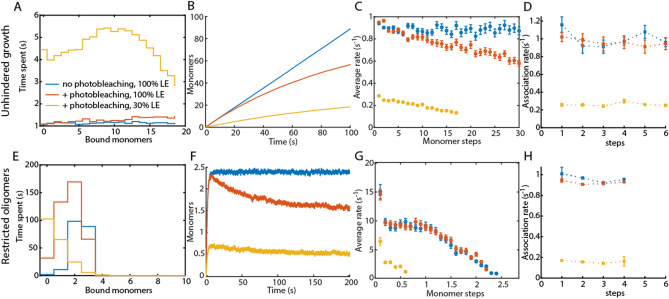
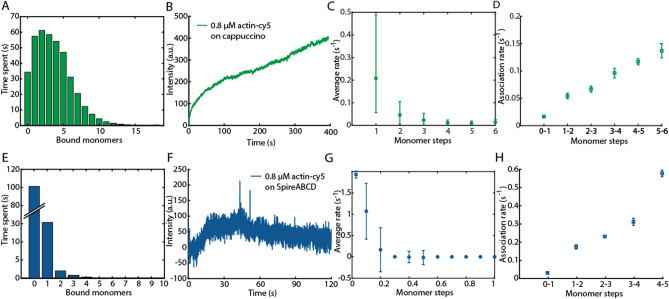
Protein assembly plays an important role throughout all phyla of life, both physiologically and pathologically. In particular, aggregation and polymerization of proteins are key-strategies that regulate cellular function. In recent years, methods to experimentally study the assembly process on a single-molecule level have been developed. This progress concomitantly has triggered the question of how to analyze this type of single-filament data adequately and what experimental conditions are necessary to allow a meaningful interpretation of the analysis. Here, we developed two analysis methods for single-filament data: the visitation analysis and the average-rate analysis. We benchmarked and compared both approaches with the classic dwell-time-analysis frequently used to study microscopic association and dissociation rates. In particular, we tested the limitations of each analysis method along the lines of the signal-to-noise ratio, the sampling rate, and the labeling efficiency and bleaching rate of the fluorescent dyes used in single-molecule fluorescence experiments. Finally, we applied our newly developed methods to study the monomer assembly of actin at the single-molecule-level in the presence of the class II nucleator Cappuccino and the WH2 repeats of Spire. For Cappuccino, our data indicated fast elongation circumventing a nucleation phase whereas, for Spire, we found that the four WH2 motifs are not sufficient to promote de novo nucleation of actin.


Conflict of interest statement

The authors declare no competing interests.

Figures

Figure 1
Figure 1
Analysis methods for single-filament data of protein self-assembly. (A) Kinetic model of the simulated nucleation and conversion process. For nucleation, k+nuc and knuc are changed to k+poly and kpoly as soon as the nucleus size is reached (here three monomers). For a conversion mechanism, only the assembly step associated with conversion (i.e., for example a restructuring of the assembled oligomer) shows k+conv and kconv. Earlier and later steps follow k+poly and kpoly. For the conversion step, three main possibilities could lead to the slower kinetics as indicated by the black box: (1) the pre-existing oligomer needs to rearrange prior to the next binding event, (2) the restructuring occurs upon binding or (3), the restructuring occurs after binding of the next monomer. All possibilities result in a slower kinetic step and are treated the same in the simulations. (B) Example trace of a simulated growth process undergoing a nucleation mechanism with a nucleus size of four monomers (black) with Gaussian noise (grey). The distribution of time spent at a certain oligomer size (blue histogram) contains information about the nucleation mechanism when it is applied to many single oligomer traces (C). (C) Visitation analysis on a nucleation (blue) or a conversion mechanism (yellow). The visitation analysis identifies the nucleation mechanism as well as the nucleus size for nucleation or conversion. (D, E) Average rates analysis. (D) Average traces of a nucleation (blue) or conversion (yellow) mechanism. From the average trace of many individual filaments growing from the same starting point, average rates can be calculated from the average time it takes to reach the next oligomer size. (E) Average rates plotted versus the monomer number (oligomer size). Different nucleation mechanisms show individual signatures. The nucleation and conversion kinetics were simulated to show slower association rates than the polymerization kinetics.
Figure 2
Figure 2
A comparison of the visitation analysis, average rates and dwell-time analysis on an assembly process with nucleus or conversion step with a size of 2, 3, 4 or 5 monomers. (A, D): A visitation analysis on a nucleation (A) and on a conversion mechanism (D). (B, E): Average rate analysis on the same nucleation (B) and conversion mechanism (E) as in (A, D) . (C, F): Dwell-time analysis on the same nucleation and conversion mechanism as in (A, D). The dwell-time analysis can identify a mechanism with a change in the on-rate by extracting the association rates (C, F), but not a mechanism with a change in the off-rate, since the extracted dissociation rates do not indicate any changes in the simulated rates (see Fig. S2). Error bars for the rates represent the 95% confidence intervals of the exponential fits. The association rates during nucleation k+nuc or the conversion step k+conv were chosen to be 50% of k+poly with no change in the off-rates.
Figure 3
Figure 3
Effect of photobleaching and labeling efficiency on unhindered growth and restricted growth that stops after the assembly of four monomers. Both unhindered (AD) and restricted growth (EH) were simulated using k+poly = 1/s and kpoly = 0.1/s. The visitation analysis (A, E), average rates (C, G) extracted from the average traces (B, F) and dwell-time analysis (D, H) were applied to data with 100% labeling efficiency and no photobleaching (blue data). The average trace of restricted growth reaches only 2.5 monomers, despite possible growth until 4 monomers, because of the equilibrium between the on- and the off-rate. The effect of a photobleaching rate of 0.01/s does not significantly influence the extracted rates and the visitation analysis (red data). The combination of stochastic labeling of 30% and photobleaching with a rate of 0.01/s affects all analysis methods (yellow). Error bars for the dwell-time analysis represent the 95% confidence intervals of the exponential fit.
Figure 4
Figure 4
Experimental data of 30% stochastically labeled actin-Cy5 growing on Cappuccino and Spire-ABCD. A comparison between a visitation analysis, dwell-time analysis and average rate analysis is performed for the measurements with Cappuccino (AD, green) and Spire-ABCD (EG, blue). (A, E): The visitation analysis, (B, F) average intensity, (C, G) fractional average-rate analysis and (D, H) dwell-time analysis showing the first 5 monomer association steps from 700 individual traces are plotted. The fractional average rates have been calculated using the time until the average trace reached the intensity change corresponding to 0.1 monomers (i.e. between 0 and 0.1, between 0.1 and 0.2, between 0.2 and 0.3, etc.). Fractional average rates are 10 times faster than average rates because the average intensity of only 1/10 of a monomer has to be reached. The experimentally determined photobleaching rate was 0.025/s.

Similar articles

Cited by

References

    1. Knowles TP, Vendruscolo M, Dobson CM. The amyloid state and its association with protein misfolding diseases. Nat. Rev. Mol. Cell Biol. 2014;15:384–396. doi: 10.1038/nrm3810. - DOI - PubMed
    1. Dick MS, Sborgi L, Ruhl S, Hiller S, Broz P. ASC filament formation serves as a signal amplification mechanism for inflammasomes. Nat. Commun. 2016;7:11929. doi: 10.1038/ncomms11929. - DOI - PMC - PubMed
    1. Lu A, et al. Unified polymerization mechanism for the assembly of ASC-dependent inflammasomes. Cell. 2014;156:1193–1206. doi: 10.1016/j.cell.2014.02.008. - DOI - PMC - PubMed
    1. Arosio P, Knowles TP, Linse S. On the lag phase in amyloid fibril formation. Phys. Chem. Chem. Phys. 2015;17:7606–7618. doi: 10.1039/C4CP05563B. - DOI - PMC - PubMed
    1. Wegner A, Engel J. Kinetics of the cooperative association of actin to actin filaments. Biophys. Chem. 1975;3:215–225. doi: 10.1016/0301-4622(75)80013-5. - DOI - PubMed

Publication types