. 2022 Mar 18;12(1):4720.
doi: 10.1038/s41598-022-08432-5.

Emission from human skin in the sub THz frequency band

Affiliations

Emission from human skin in the sub THz frequency band

Noa Betzalel et al. Sci Rep. .

Abstract

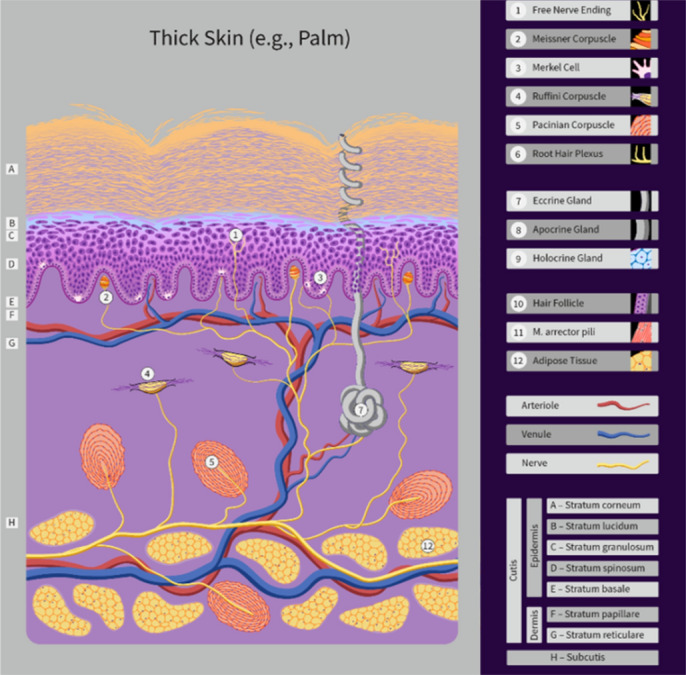
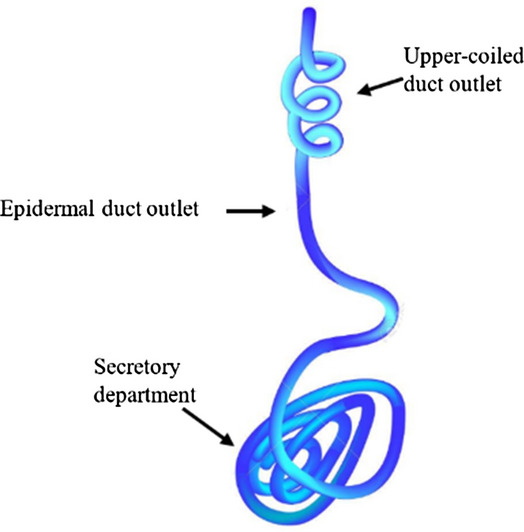
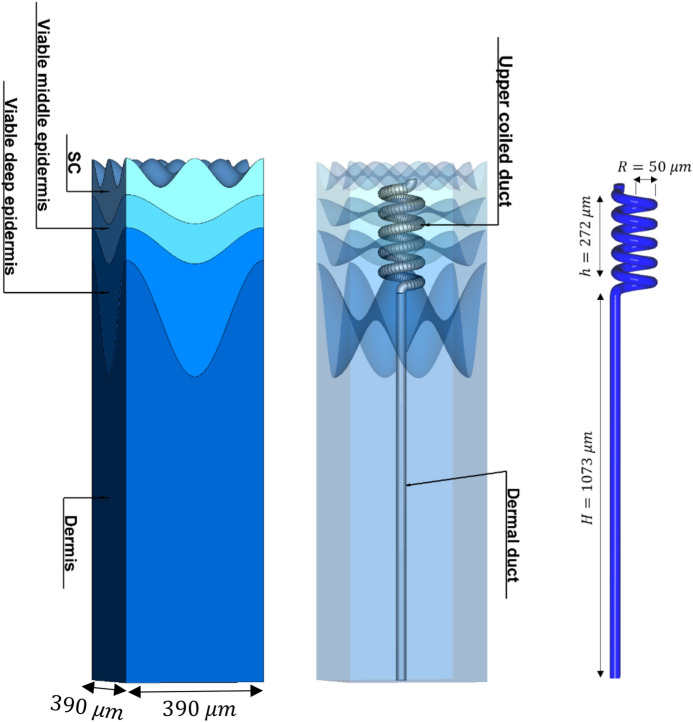
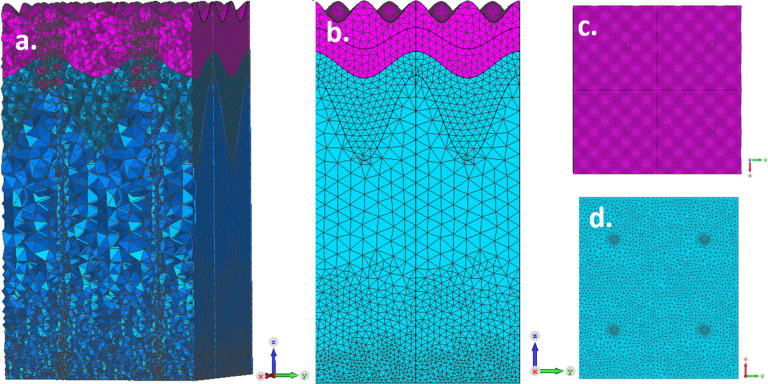
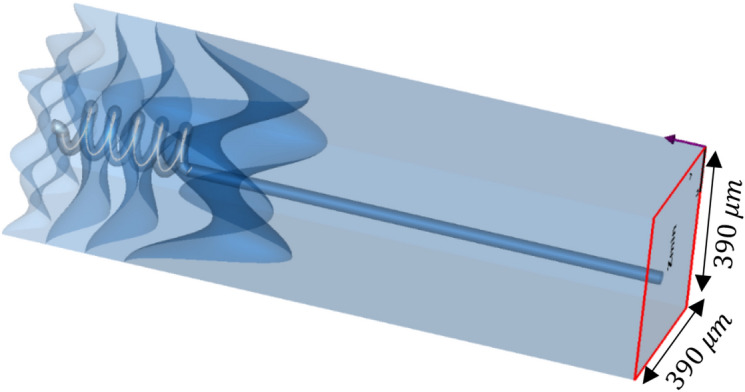
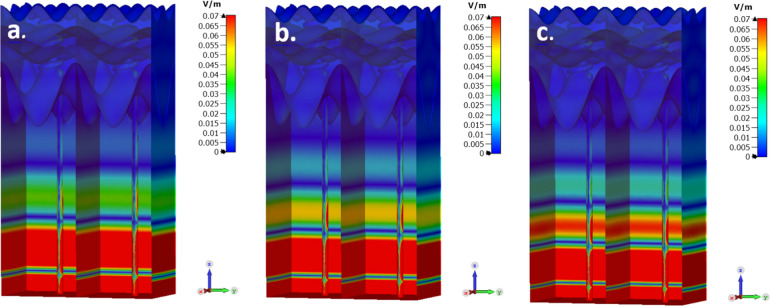
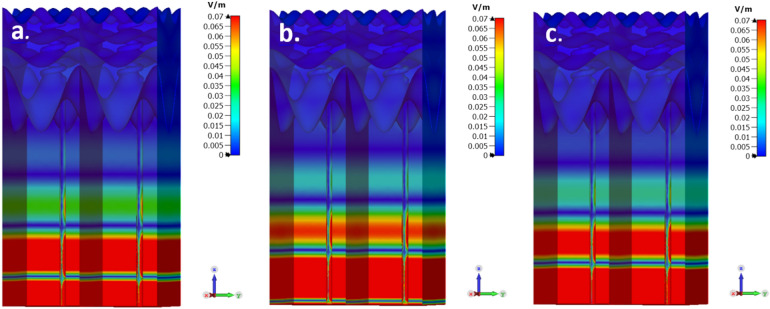
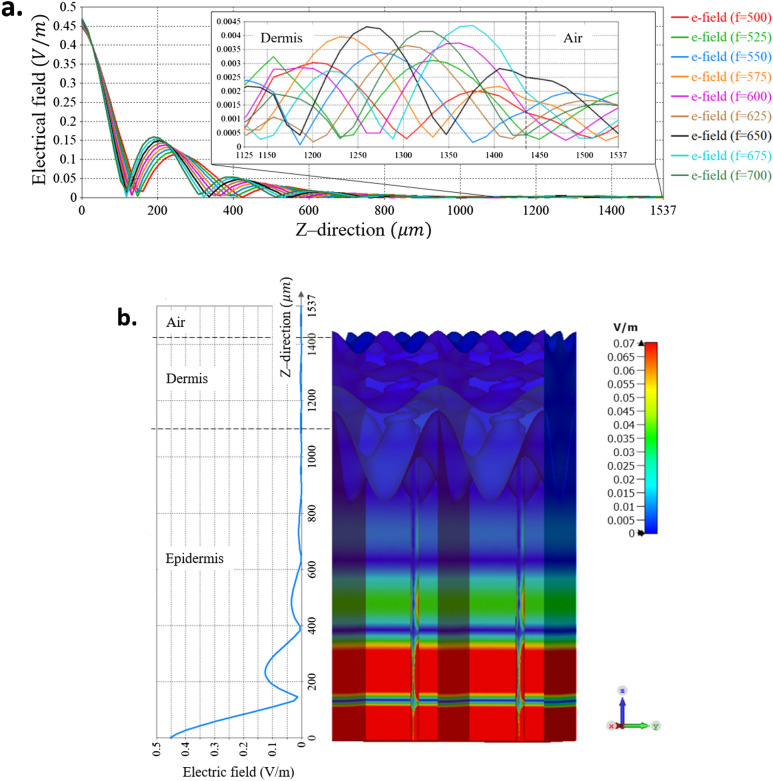
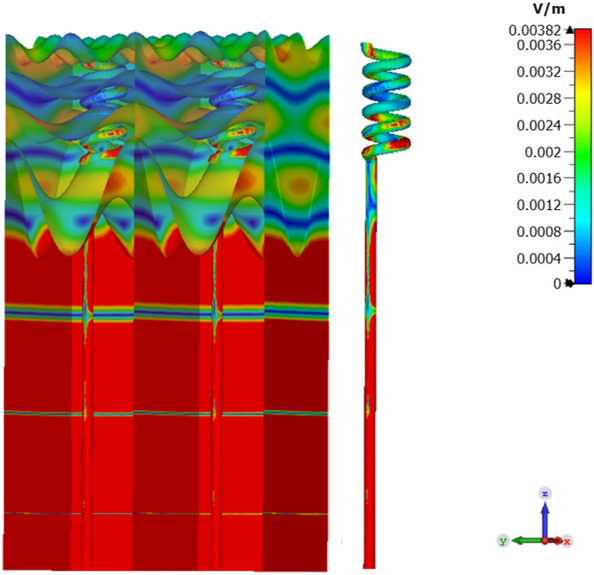
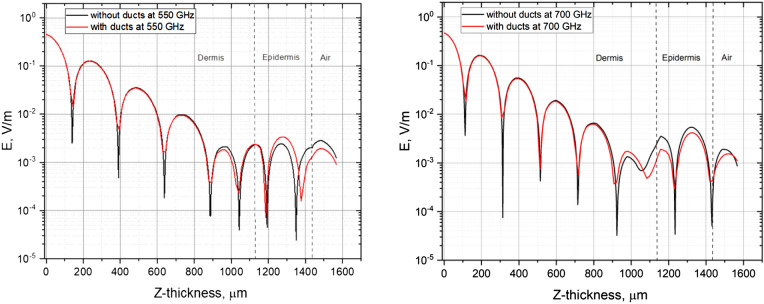
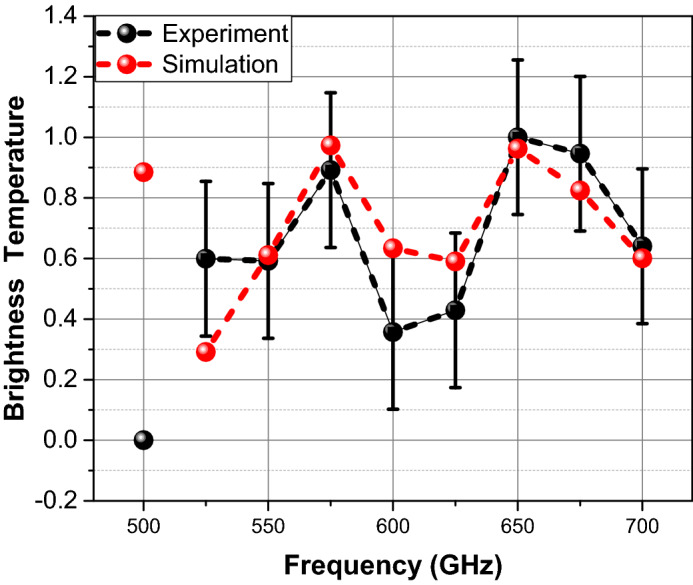
Recently published Radiometric measurements of human subjects in the frequency range 480-700 GHz, demonstrate the emission of blackbody radiation from the body core, rather than the skin surface. We present a detailed electromagnetic simulation of the dermis and epidermis, taking into account the presence of the sweat duct. This complex structure can be considered as an electromagnetic bio-metamaterial, whereby the layered structure, along with the topology of the sweat duct, reveals a complex interference pattern in the skin. The model is capable of accurately representing the skin greyness factor as a function of frequency and this is confirmed by radiometry of living human skin.


Conflict of interest statement

The authors declare no competing interests.

Figures

Figure 1
Figure 1
A schematic of human skin showing the main human skin layers and coiled sweat duct. (Modified from the original under a CC BY SA license, https://creativecommons.org/licenses/by-sa/4.0/. Copyright Guido Hegasy, https://www.hegasy.de/).
Figure 2
Figure 2
Schematics of eccrine sweat gland.
Figure 3
Figure 3
The epidermis water concentration profile as a function of the palm skin's depth measured in the palm of the hand of 15 subjects. The sharp rise in water content from approximately 40% to 65% mass represents the boundary between the epidermis and the dermis of the subject. The measurements were made in vivo, where Raman spectra were obtained at different depths below the skin surface using a confocal Raman spectrometer. The average depth of the epidermis was 173 μm with a standard deviation of 37 μm. (Reproduced with permission. Published in Acta Dermato-Venereologica for the Society for Publication of Acta Dermato-Venereologica. All rights reserved).
Figure 4
Figure 4
Electromagnetic thick human skin model designed and simulated using CST STUDIO SUITE, MICROWAVE STUDIO. On the left—the whole model from an external view. On the middle—and interior view. As can be seen the coiled duct is fully embedded in the epidermis layer and the dermal duct is fully embedded in the dermis layer. On the right—the sizes of the duct which was used in the simulations. These values were based on the dimension of the layers and the sweat duct obtained in ref 17. The unit cell dimensions are 390 μm × 390 μm. This figure was generated using CST STUDIO SUITE v2021, https://www.3ds.com/products-services/simulia/products/cst-studio-suite/.
Figure 5
Figure 5
Mesh view of the human skin model. (a) a 3D view of the zy-plane, (b) a 2D view of the zy-plan. The adaptive mesh id clearly shown, as different areas of the model have different division of tetrahedral mesh cells, (c) top view. A more fine division to mesh cells is taking place due to the curved sinusoidal nature of this surface. (d) Bottom view. Here, as well, a finer mesh division is taking place to overcome the sharp edges of this surface. This figure was generated using CST STUDIO SUITE v2021, https://www.3ds.com/products-services/simulia/products/cst-studio-suite/.
Figure 6
Figure 6
Electromagnetic excitation signal applied to the Zmin port, using 18 modes of Floquet. This figure was generated using CST STUDIO SUITE v2021, https://www.3ds.com/products-services/simulia/products/cst-studio-suite/.
Figure 7
Figure 7
Electrical field distribution simulated for three of the nine different frequencies, which were simulated in the range of 500 GHz up to 700 GHz, with a constant frequency interval of 25 GHz. (a) 500 GHz, (b) 600 GHz and (c) 700 GHz. The duct conductivity is 1,000 S/m and power average of 5 nW. The phase for all frequencies was fixed to 145°. This figure was generated using CST STUDIO SUITE v2021, https://www.3ds.com/products-services/simulia/products/cst-studio-suite/.
Figure 8
Figure 8
Fixed frequency of 550 GHz and different phases (a) 0, (c) 90° and (f) 225°) out of the nine which were simulated. In the scale-bar, all values above 0.07 V/m are marked in Red color. This figure was generated using CST STUDIO SUITE v2021, https://www.3ds.com/products-services/simulia/products/cst-studio-suite/.
Figure 9
Figure 9
(a) The electrical field as function of distance in Z direction, i.e., throughout the skin model, for a fixed phase 145° and 9 different frequencies. (b) The electric field as function of the z-axis next to the 3D human skin model, for a perspective. This figure was generated using CST STUDIO SUITE v2021, https://www.3ds.com/products-services/simulia/products/cst-studio-suite/.
Figure 10
Figure 10
Electric field distribution in a fine resolution at 550 GHz. The sweat duct demonstrates performance of a conduit for the EM signal emitted from the core of the skin toward the skin surface This figure was generated using CST STUDIO SUITE v2021, https://www.3ds.com/products-services/simulia/products/cst-studio-suite/.
Figure 11
Figure 11
Log scale of the electric field as function of the skin depth. Left hand side is the simulation results for 550 GHz and the right hand side is the simulation results for 700 GHz. The continuous line is for the full model, including the sweat duct and the dashed line is the simulation results for a model without the sweat duct.
Figure 12
Figure 12
Comparison of the normalized skin brightness temperature calculated by CST simulations (Red) and by in vivo radiometric measurements of the skin thermal radiation (Black). The measurements accuracy is ± 1.7 degree. It can be seen that qualitatively the simulation and experiment results are having the same nature and follow the same trend.

References

    1. Ring EFJ, Ammer K. Infrared thermal imaging in medicine. Physiol. Meas. 2012;33:R33–R46. doi: 10.1088/0967-3334/33/3/R33. - DOI - PubMed
    1. Anbar M. Clinical thermal imaging today. IEEE Eng. Med. Biol. Mag. 1998;17:25–33. doi: 10.1109/51.687960. - DOI - PubMed
    1. Fufeng, L. et al. Facial Complexion Acquisition and Recognition System for Clinical Diagnosis in Traditional Chinese Medicine. in 2009 International Joint Conference on Bioinformatics, Systems Biology and Intelligent Computing 392–396 (2009). 10.1109/IJCBS.2009.111.
    1. Mostov K, Liptsen E, Boutchko R. Medical applications of shortwave FM radar: Remote monitoring of cardiac and respiratory motion. Med. Phys. 2010;37:1332–1338. doi: 10.1118/1.3267038. - DOI - PMC - PubMed
    1. Baksheeva K, et al. The sub THz emission of the human body under physiological stress. IEEE Trans. Terahertz Sci. Technol. 2021 doi: 10.1109/TTHZ.2021.3066099. - DOI