

Remote dose imaging from Cherenkov light using spatially resolved CT calibration in breast radiotherapy
- PMID: 35304768
- PMCID: PMC9187603
- DOI: 10.1002/mp.15614
Remote dose imaging from Cherenkov light using spatially resolved CT calibration in breast radiotherapy
Abstract
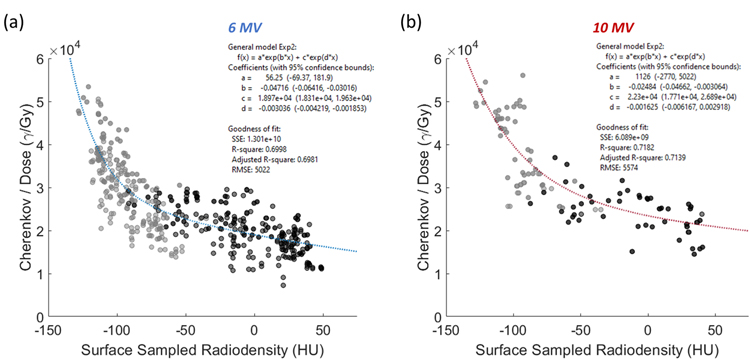
Purpose: Imaging Cherenkov light during radiotherapy allows the visualization and recording of frame-by-frame relative maps of the dose being delivered to the tissue at each control point used throughout treatment, providing one of the most complete real-time means of treatment quality assurance. In non-turbid media, the intensity of Cherenkov light is linear with surface dose deposited, however the emission from patient tissue is well-known to be reduced by absorbing tissue components such as hemoglobin, fat, water, and melanin, and diffused by the scattering components of tissue. Earlier studies have shown that bulk correction could be achieved by using the patient planning computed tomography (CT) scan for attenuation correction.
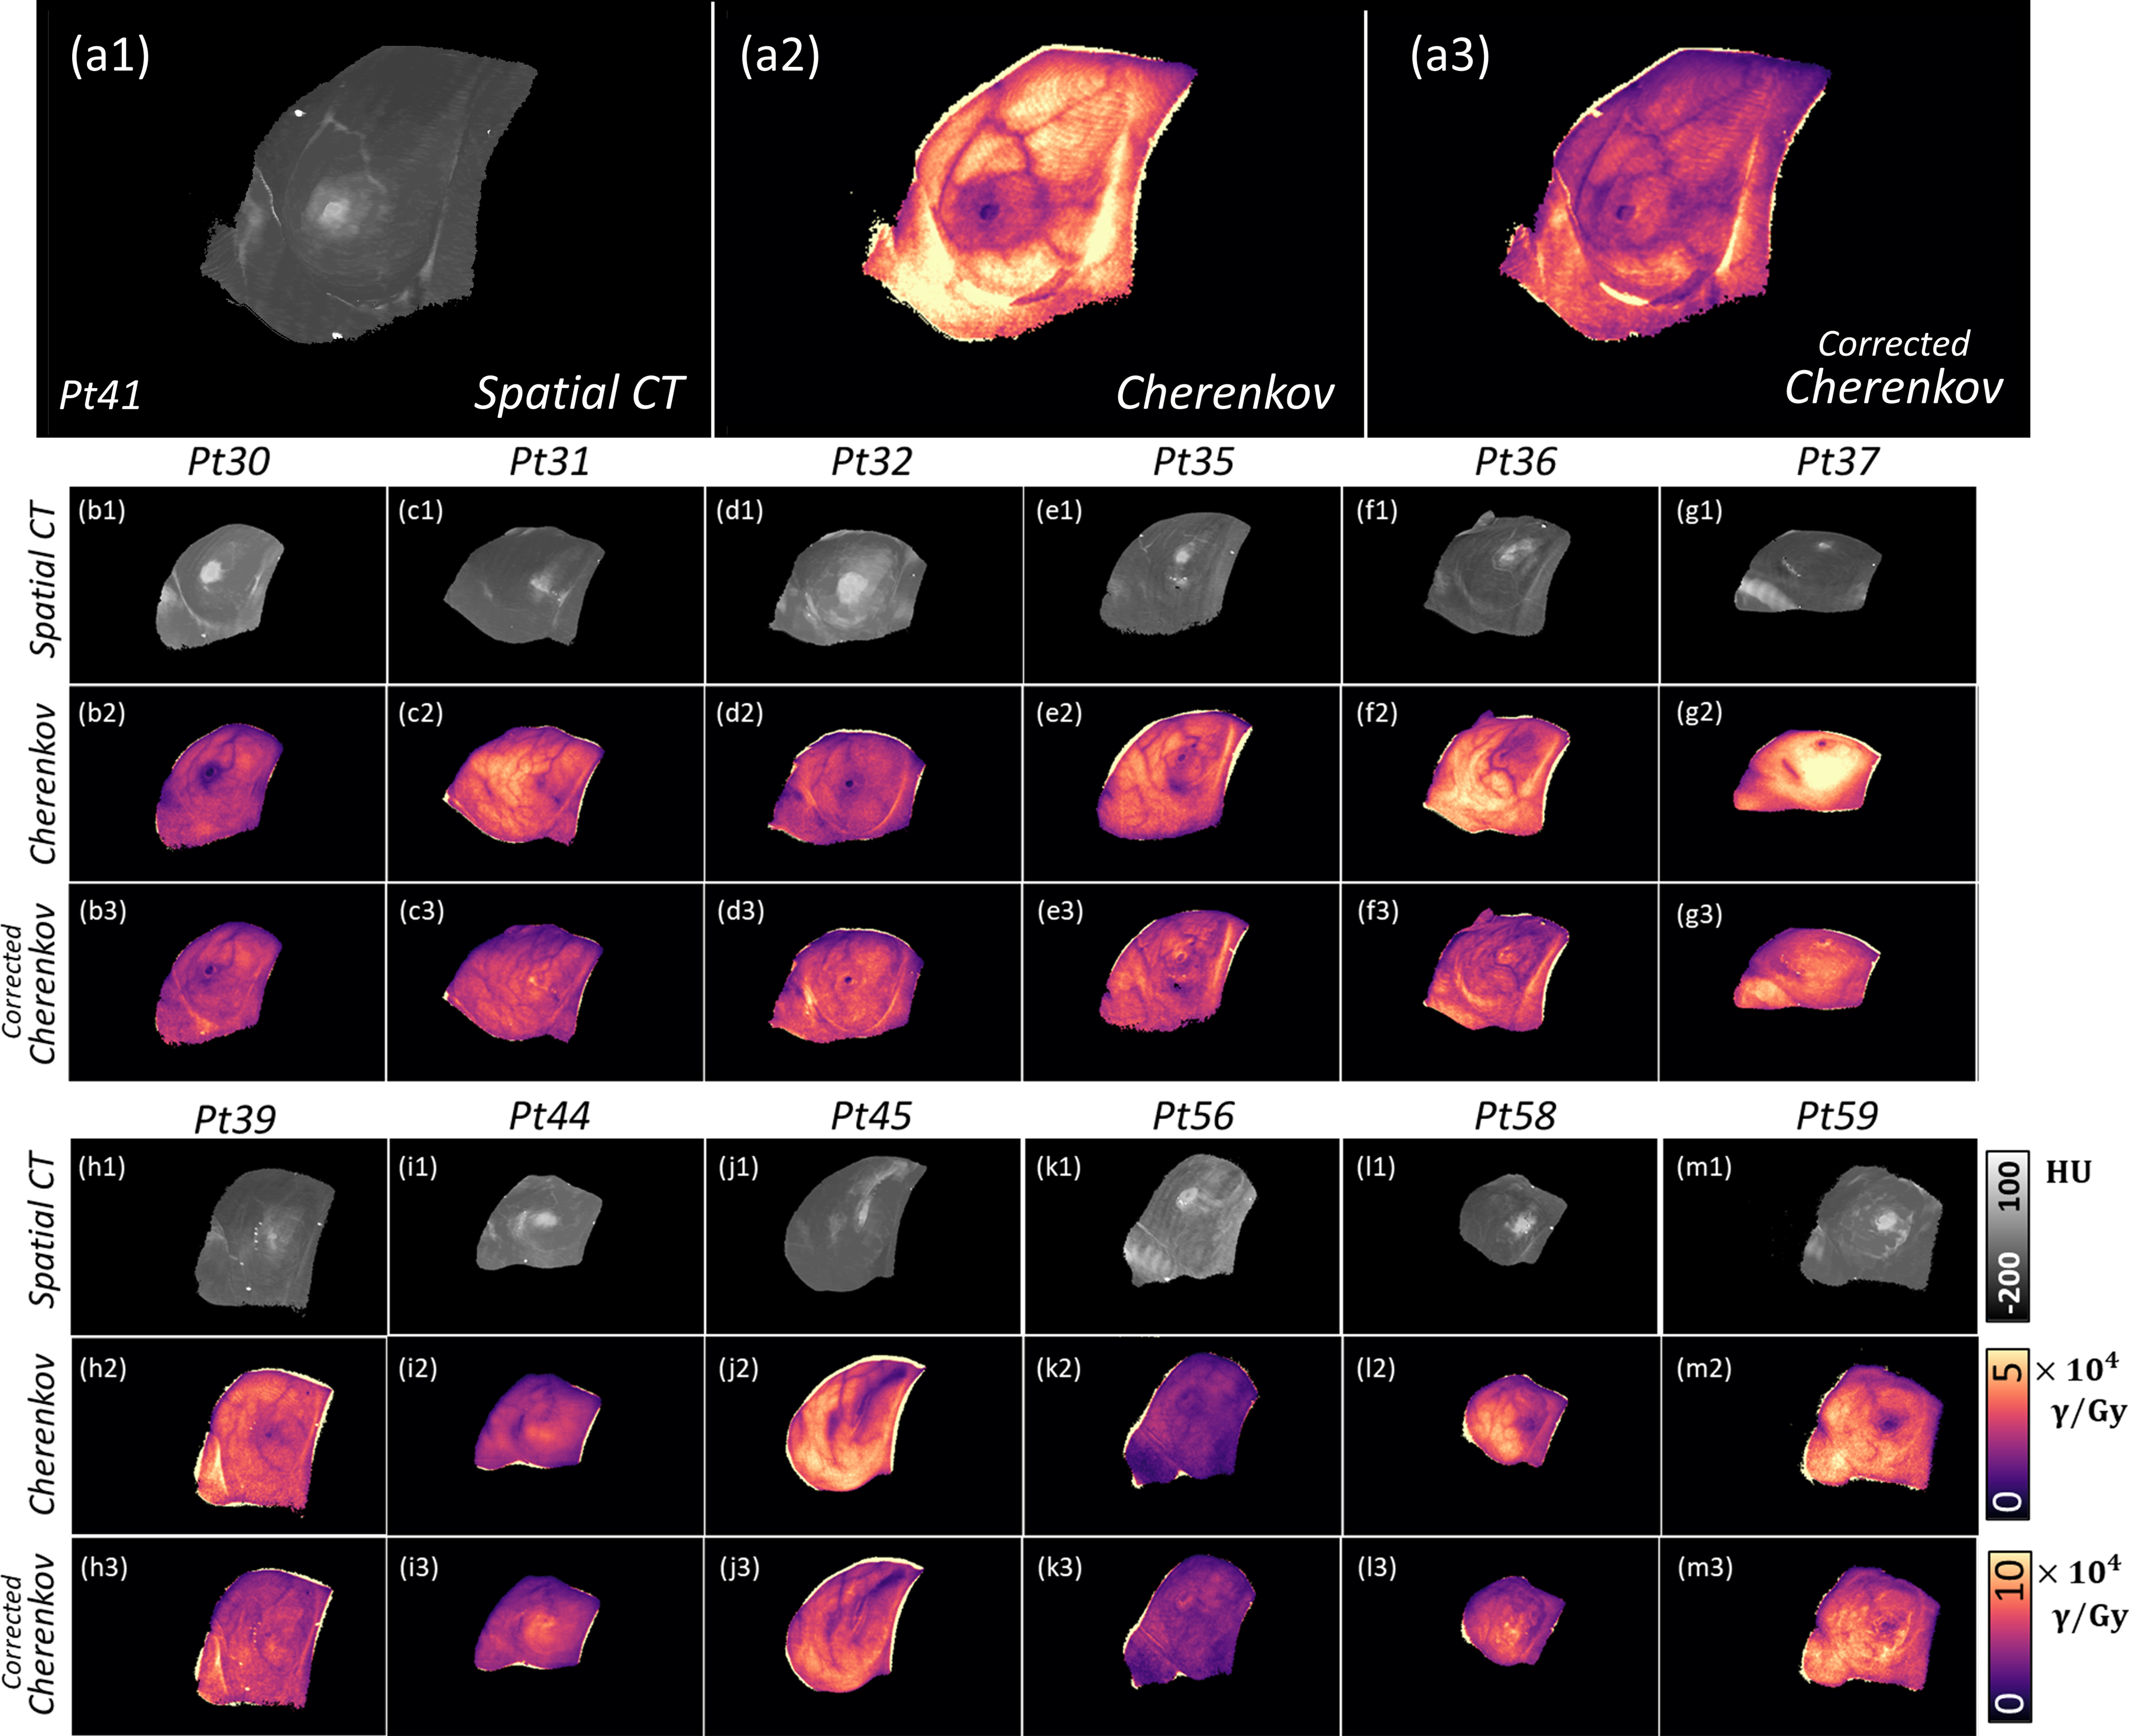
Methods: In this study, CT maps were used for correction of spatial variations in emissivity. Testing was completed on Cherenkov images from radiotherapy treatments of post-lumpectomy breast cancer patients (n = 13), combined with spatial renderings of the patient radiodensity (CT number) from their planning CT scan.
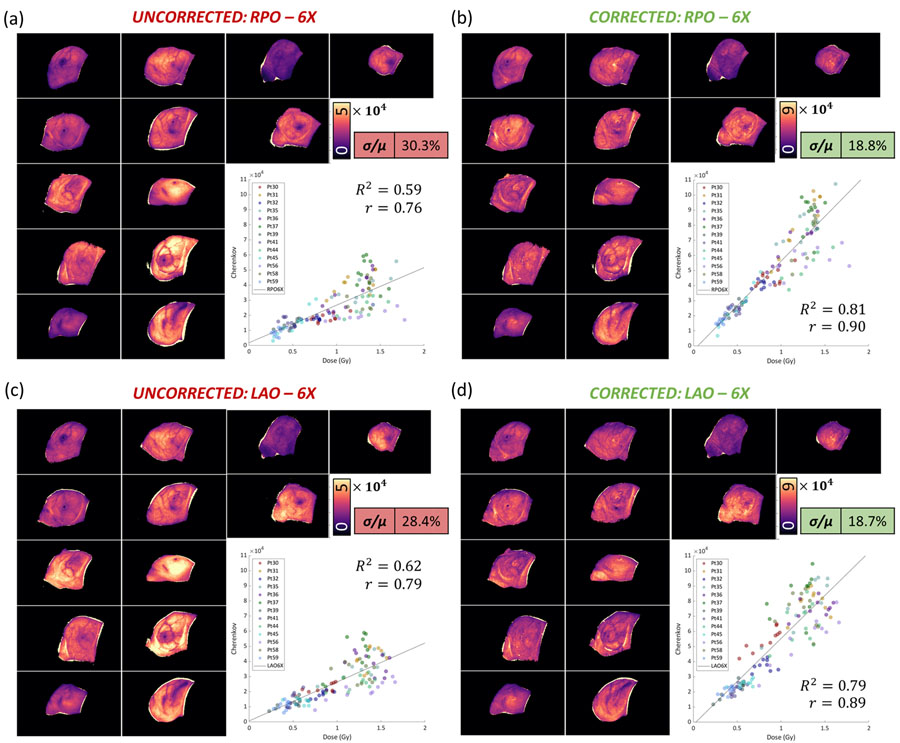
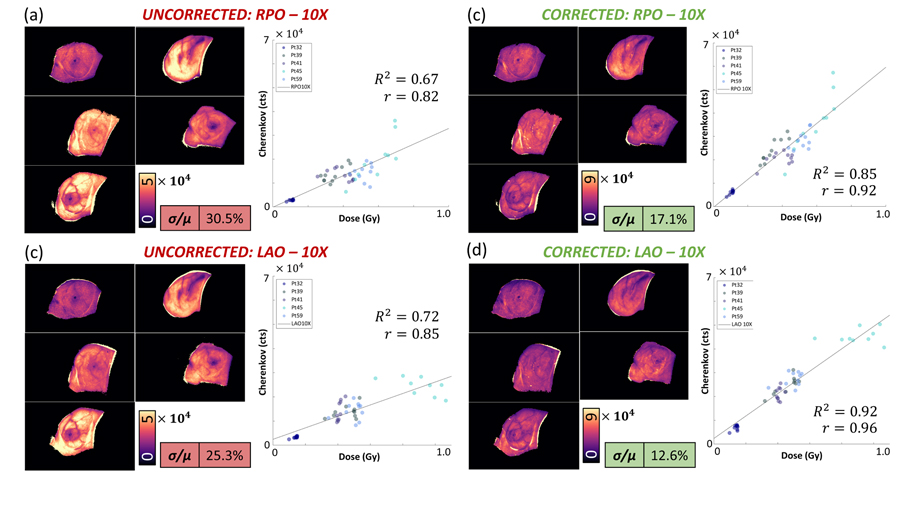
Results: The correction technique was shown to provide a pixel-by-pixel correction that suppressed many of the inter- and intra-patient differences in the Cherenkov light emitted per unit dose. This correction was established from a calibration curve that correlated Cherenkov light intensity to surface-rendered CT number ( and ). The corrected Cherenkov intensity per unit dose standard error was reduced by nearly half (from ∼30% to ∼17%).
Conclusions: This approach provides evidence that the planning CT scan can mitigate some of the tissue-specific attenuation in Cherenkov images, allowing them to be translated into near surface dose images.
Keywords: Cherenkov; breast cancer; dose imaging; dosimetry; quantitative imaging.
© 2022 American Association of Physicists in Medicine.
Conflict of interest statement
DISCLOSURES
L.A.J. and B.W.P. have a financial interest in DoseOptics, which manufactures cameras used in this study and is funded by SBIR grants; they also have a conflict of interest management plan at Dartmouth College and Dartmouth-Hitchcock Medical Center, which includes an independent review of the research integrity before publication. L.A.J. has a patent pending (application no. 62/874,124). R.L.H. has a patent pending (application no. 62/874,124). M.J. and P.B. are employees of DoseOptics. I.I.T. has a patent issued (WO/2019/165196). M.J. has a patent (WO 2019/143972 A2) pending to Dartmouth/DoseOptics LLC. P.B. has patents pending (62/967,302; 62/873,155; PCT/US19/14242; and PCT/US19/19135). D.J.G. has a patent issued (US10,201,718 B2, 2/12/2019). B.W.P. has patents (US 10201718 B2 and US 9731150 B2) issued to DoseOptics LLC and a patent (WO 2019/143972 A2) pending to Dartmouth/DoseOptics LLC. The remaining authors reported no disclosures or conflicts of interest.
Figures

References
-
- Jarvis LA et al. , “Cherenkov video imaging allows for the first visualization of radiation therapy in real time,” International Journal of Radiation Oncology* Biology* Physics, vol. 89, no. 3, pp. 615–622, 2014. - PubMed
-
- Black PJ, Velten C, Wang Y-F, Na YH, and Wuu C-S, “An investigation of clinical treatment field delivery verification using cherenkov imaging: IMRT positioning shifts and field matching,” Medical physics, vol. 46, no. 1, pp. 302–317, 2019. - PubMed
-
- Li XA et al. , “Patterns of Failure Observed in the 2-Step Institution Credentialing Process for NRG Oncology/Radiation Therapy Oncology Group 1005 (NCT01349322) and Lessons Learned,” Practical radiation oncology, vol. 10, no. 4, pp. 265–273, 2020. - PMC - PubMed
MeSH terms
Grants and funding
LinkOut - more resources
Full Text Sources
