

Motivational signals disrupt metacognitive signals in the human ventromedial prefrontal cortex
- PMID: 35304877
- PMCID: PMC8933484
- DOI: 10.1038/s42003-022-03197-z
Motivational signals disrupt metacognitive signals in the human ventromedial prefrontal cortex
Abstract
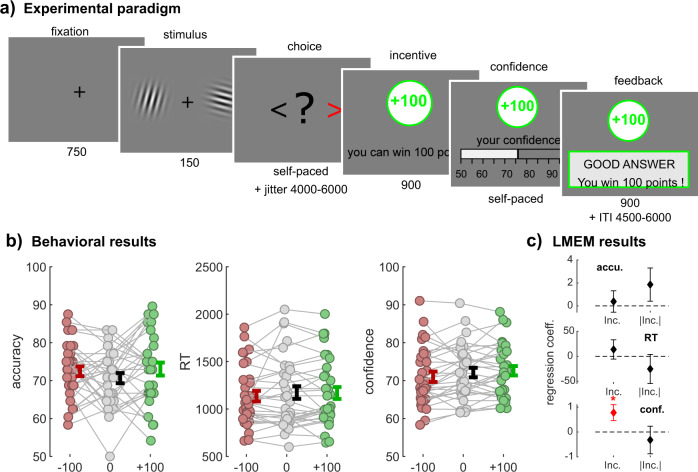
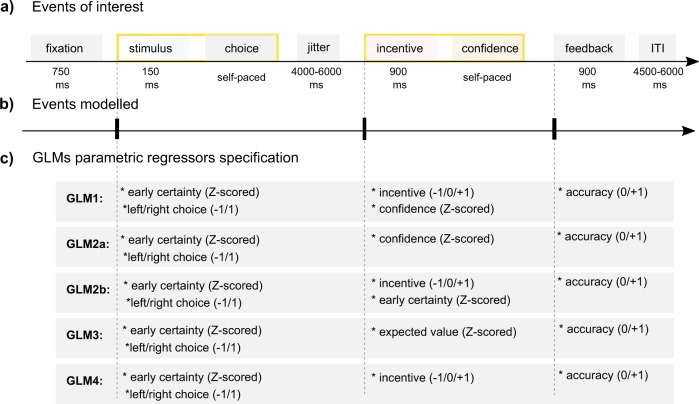
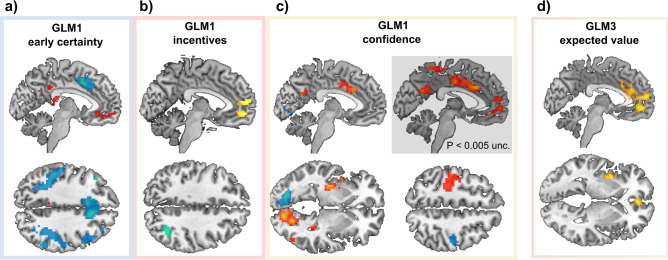
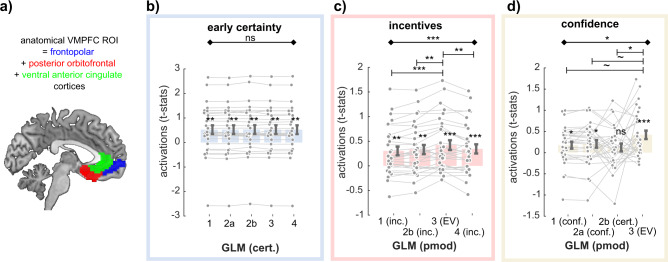
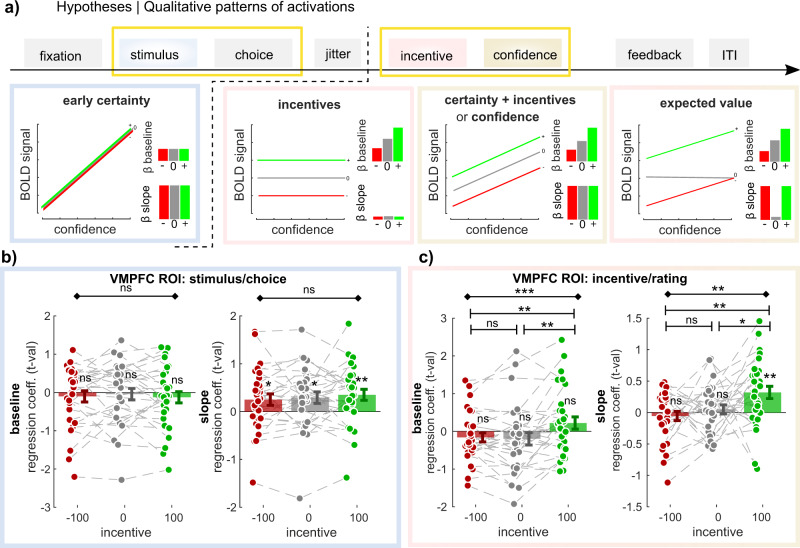
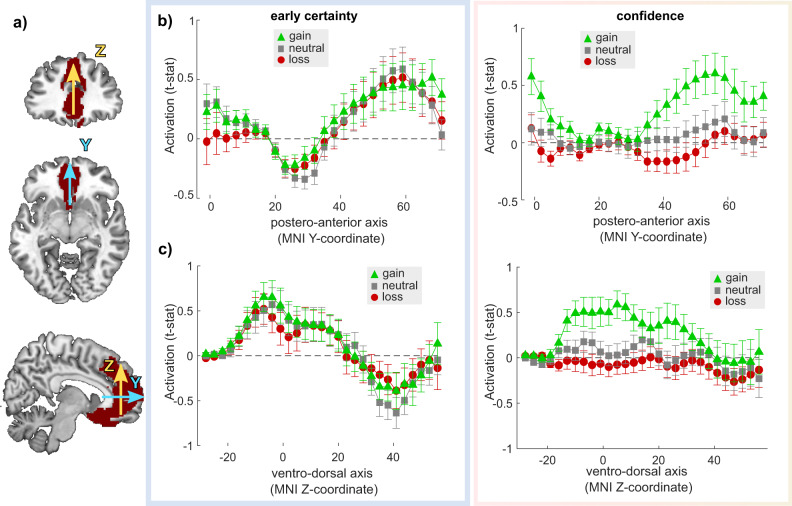
A growing body of evidence suggests that, during decision-making, BOLD signal in the ventromedial prefrontal cortex (VMPFC) correlates both with motivational variables - such as incentives and expected values - and metacognitive variables - such as confidence judgments - which reflect the subjective probability of being correct. At the behavioral level, we recently demonstrated that the value of monetary stakes bias confidence judgments, with gain (respectively loss) prospects increasing (respectively decreasing) confidence judgments, even for similar levels of difficulty and performance. If and how this value-confidence interaction is reflected in the VMPFC remains unknown. Here, we used an incentivized perceptual decision-making fMRI task that dissociates key decision-making variables, thereby allowing to test several hypotheses about the role of the VMPFC in the value-confidence interaction. While our initial analyses seemingly indicate that the VMPFC combines incentives and confidence to form an expected value signal, we falsified this conclusion with a meticulous dissection of qualitative activation patterns. Rather, our results show that strong VMPFC confidence signals observed in trials with gain prospects are disrupted in trials with no - or negative (loss) - monetary prospects. Deciphering how decision variables are represented and interact at finer scales seems necessary to better understand biased (meta)cognition.
© 2022. The Author(s).
Conflict of interest statement
The authors declare no competing interests.
Figures
Similar articles
-
Metacognition and the effect of incentive motivation in two compulsive disorders: Gambling disorder and obsessive-compulsive disorder.Psychiatry Clin Neurosci. 2022 Sep;76(9):437-449. doi: 10.1111/pcn.13434. Epub 2022 Jun 29. Psychiatry Clin Neurosci. 2022. PMID: 35674699 Free PMC article.
-
Human VMPFC encodes early signatures of confidence in perceptual decisions.Elife. 2018 Sep 24;7:e38293. doi: 10.7554/eLife.38293. Elife. 2018. PMID: 30247123 Free PMC article.
-
Subjective value then confidence in human ventromedial prefrontal cortex.PLoS One. 2020 Feb 10;15(2):e0225617. doi: 10.1371/journal.pone.0225617. eCollection 2020. PLoS One. 2020. PMID: 32040474 Free PMC article.
-
Economic and social values in the brain: evidence from lesions to the human ventromedial prefrontal cortex.Front Neurol. 2023 Oct 12;14:1198262. doi: 10.3389/fneur.2023.1198262. eCollection 2023. Front Neurol. 2023. PMID: 37900604 Free PMC article. Review.
-
The neural basis of effort valuation: A meta-analysis of functional magnetic resonance imaging studies.Neurosci Biobehav Rev. 2021 Dec;131:1275-1287. doi: 10.1016/j.neubiorev.2021.10.024. Epub 2021 Oct 25. Neurosci Biobehav Rev. 2021. PMID: 34710515 Review.
Cited by
-
Effective connectivity predicts distributed neural coding of perceptual decision confidence, uncertainty, and speed.Imaging Neurosci (Camb). 2025 Jan 21;3:imag_a_00441. doi: 10.1162/imag_a_00441. eCollection 2025. Imaging Neurosci (Camb). 2025. PMID: 40800936 Free PMC article.
-
The neural representation of metacognition in preferential decision-making.Hum Brain Mapp. 2024 Apr 15;45(6):e26651. doi: 10.1002/hbm.26651. Hum Brain Mapp. 2024. PMID: 38646963 Free PMC article.
-
Neural and computational underpinnings of biased confidence in human reinforcement learning.Nat Commun. 2023 Oct 28;14(1):6896. doi: 10.1038/s41467-023-42589-5. Nat Commun. 2023. PMID: 37898640 Free PMC article.
-
Direct stimulation of anterior insula and ventromedial prefrontal cortex disrupts economic choices.Nat Commun. 2024 Aug 29;15(1):7508. doi: 10.1038/s41467-024-51822-8. Nat Commun. 2024. PMID: 39209840 Free PMC article.
-
Neural Correlates of Metacognition Impairment in Opioid Addiction.Biol Psychiatry Cogn Neurosci Neuroimaging. 2024 Nov;9(11):1211-1221. doi: 10.1016/j.bpsc.2024.07.014. Epub 2024 Jul 25. Biol Psychiatry Cogn Neurosci Neuroimaging. 2024. PMID: 39059467
References
-
- Rangel A, Hare T. Neural computations associated with goal-directed choice. Curr. Opin. Neurobiol. 2010;20:262–270. - PubMed
-
- Padoa-Schioppa C. Orbitofrontal cortex and the computation of economic value. Ann. N. Y. Acad. Sci. 2007;1121:232–253. - PubMed
-
- Tremblay L, Schultz W. Relative reward preference in primate orbitofrontal cortex. Nature. 1999;398:704–708. - PubMed
Publication types
MeSH terms
Associated data
Grants and funding
LinkOut - more resources
Full Text Sources
