. 2022 Jun;13(3):1821-1836.
doi: 10.1002/jcsm.12982. Epub 2022 Mar 19.

Mitochondrial uncoupling attenuates sarcopenic obesity by enhancing skeletal muscle mitophagy and quality control

Affiliations

Mitochondrial uncoupling attenuates sarcopenic obesity by enhancing skeletal muscle mitophagy and quality control

Wagner S Dantas et al. J Cachexia Sarcopenia Muscle. 2022 Jun.

Abstract

Background: Sarcopenic obesity is a highly prevalent disease with poor survival and ineffective medical interventions. Mitochondrial dysfunction is purported to be central in the pathogenesis of sarcopenic obesity by impairing both organelle biogenesis and quality control. We have previously identified that a mitochondrial-targeted furazano[3,4-b]pyrazine named BAM15 is orally available and selectively lowers respiratory coupling efficiency and protects against diet-induced obesity in mice. Here, we tested the hypothesis that mitochondrial uncoupling simultaneously attenuates loss of muscle function and weight gain in a mouse model of sarcopenic obesity.

Methods: Eighty-week-old male C57BL/6J mice with obesity were randomized to 10 weeks of high fat diet (CTRL) or BAM15 (BAM15; 0.1% w/w in high fat diet) treatment. Body weight and food intake were measured weekly. Body composition, muscle function, energy expenditure, locomotor activity, and glucose tolerance were determined after treatment. Skeletal muscle was harvested and evaluated for histology, gene expression, protein signalling, and mitochondrial structure and function.

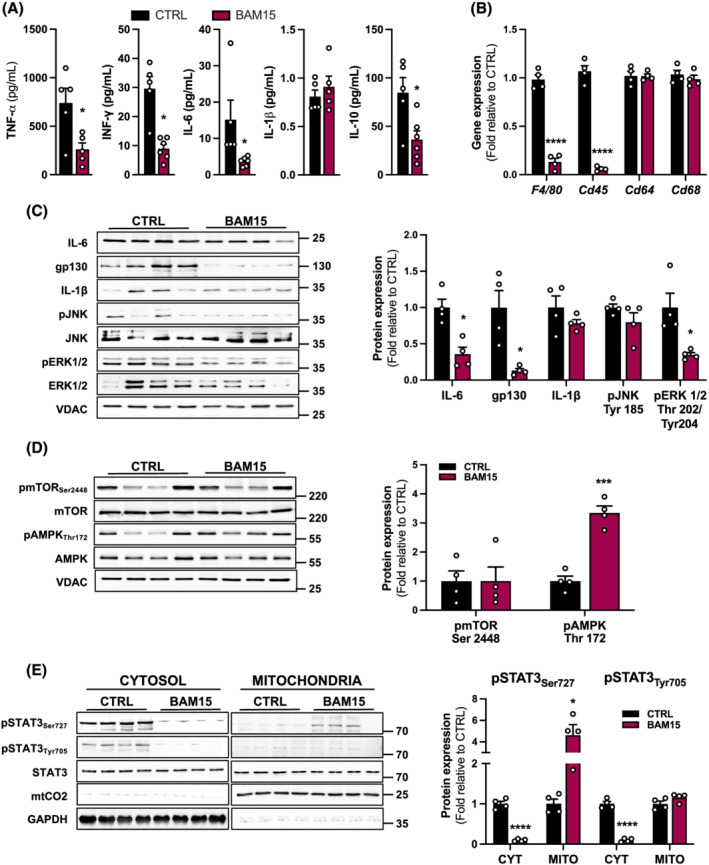
Results: BAM15 decreased body weight (54.0 ± 2.0 vs. 42.3 ± 1.3 g, P < 0.001) which was attributable to increased energy expenditure (10.1 ± 0.1 vs. 11.3 ± 0.4 kcal/day, P < 0.001). BAM15 increased muscle mass (52.7 ± 0.4 vs. 59.4 ± 1.0%, P < 0.001), strength (91.1 ± 1.3 vs. 124.9 ± 1.2 g, P < 0.0001), and locomotor activity (347.0 ± 14.4 vs. 432.7 ± 32.0 m, P < 0.001). Improvements in physical function were mediated in part by reductions in skeletal muscle inflammation (interleukin 6 and gp130, both P < 0.05), enhanced mitochondrial function, and improved endoplasmic reticulum homeostasis. Specifically, BAM15 activated mitochondrial quality control (PINK1-ubiquitin binding and LC3II, P < 0.01), increased mitochondrial activity (citrate synthase and complex II activity, all P < 0.05), restricted endoplasmic reticulum (ER) misfolding (decreased oligomer A11 insoluble/soluble ratio, P < 0.0001) while limiting ER stress (decreased PERK signalling, P < 0.0001), apoptotic signalling (decreased cytochrome C release and Caspase-3/9 activation, all P < 0.001), and muscle protein degradation (decreased 14-kDa actin fragment insoluble/soluble ratio, P < 0.001).

Conclusions: Mitochondrial uncoupling by agents such as BAM15 may mitigate age-related decline in muscle mass and function by molecular and cellular bioenergetic adaptations that confer protection against sarcopenic obesity.

Keywords: Ageing; BAM15; Bioenergetics; Mitochondrial uncoupling; Obesity; Sarcopenia.


Conflict of interest statement

The authors report no conflicts of interest related to this work.

Figures

Figure 1
Figure 1
Mitochondrial uncoupling prevents diet‐induced obesity and improves glucose tolerance in aged mice. (A) Cumulative body weight and delta (post–pre) body weight changes; (B) average and cumulative food intake; (C) inguinal and gonadal white adipose tissue (iWAT and gWAT, respectively) weight and total fat mass; (D) plasma glucose concentrations at 0, 15, 30, 60, 90, and 120 min following intraperitoneal injection of glucose and total area under the curve (AUC) of glucose; (E) fasting plasma insulin and plasma C‐peptide and hepatic extraction; and (F) whole‐body homeostatic model of insulin resistance (HOMA‐IR). Data are expressed as mean ± SEM with exception to panel A (right) which is displayed as a box (mean ± 95% CI) and whiskers (minimum to maximum values) plot. Repeated measures in panels (A), (B), and (D) were assessed by two‐way repeated measures ANOVA with Tukey's multiple comparisons. Two‐group comparisons in panels (A), (B), (C), (D), (E), and (F) were assessed by unpaired Student's t‐test. *P < 0.05, **P < 0.01, ***P < 0.001, and ****P < 0.0001 indicate statistical significance for between‐group comparisons, respectively.
Figure 2
Figure 2
Mitochondrial uncoupling preserves skeletal muscle mass and function in aged mice. (A) Lean mass and gastrocnemius (gastroc) weight normalized to tibia length. (B) Representative haematoxylin–eosin (H&E) staining of gastrocnemius muscle (scale = 50 μm) and quantification of fibre cross‐sectional area (fCSA). (C) Grip strength averaged over four repeated trials and (D) spontaneous physical movement over a 7‐day period. (E) Total, dark, and light phase energy expenditure averaged over a 5‐day period. (F) Representative bands of MyHCI, MyHCII, and VDAC from gastroc tissue extracts and quantification of protein expression. All comparisons were assessed by unpaired Student's t‐test. *P < 0.05, **P < 0.01, ***P < 0.001, and ****P < 0.0001 indicate statistical significance for between‐group comparisons, respectively.
Figure 3
Figure 3
Mitochondrial uncoupling attenuates age‐related IL‐6/STAT3‐induced systemic and skeletal muscle inflammation in aged mice. (A) Plasma concentrations of TNF‐α, INF‐ γ, IL‐6, IL‐1β, and IL‐10. (B) Gene expression of F4/80, Cd45, Cd64, and Cd68 normalized to β‐actin. (C) Representative bands of IL‐6, gp130, IL‐1β, JNKThr183/Tyr185, ERK1/2Thr202/Tyr204, and VDAC from tissue extracts and quantification of protein expression. (D) Representative bands of pmTORSer2448, total mTOR, pAMPKThr172, total AMPK, and VDAC from gastroc tissue extracts and quantification of protein expression. (E) Representative bands of pSTAT3Ser727, pSTAT3Tyr705, total STAT3, mtCO2, and GAPDH from the cytosolic and mitochondrial compartments of tissue extracts and quantification of protein expression. Data are expressed as mean ± SEM. All comparisons were assessed by unpaired Student's t‐test. *P < 0.05 and ****P < 0.0001 indicate statistical significance for between‐group comparisons, respectively.
Figure 4
Figure 4
Mitochondrial uncoupling enhances skeletal muscle mitochondrial biogenesis and respiratory activity in aged mice. (A) Representative bands of respiratory complex V (CV), III (CIII), IV (CIV), II (CII), and I (CI), PGC‐1α, and VDAC and (AB) quantification of protein expression. (C) Mitochondrial DNA (mtDNA) content quantified as the expression of mitochondrial cytochrome C oxidase subunit 2 (mtCO2) normalized to 18S (18S). (D) Representative transmission electron micrographs of subsarcolemmal and intermyofibrillar mitochondria and (E) quantification of mitochondria content from electron micrographs. (F) Enzymatic activity of citrate synthase, complex II, complex III, and complex IV normalized to tissue wet weight. All comparisons were assessed by unpaired Student's t‐test. *P < 0.05 and **P < 0.01 indicate statistical significance for between‐group comparisons, respectively.
Figure 5
Figure 5
Mitochondrial uncoupling enhances skeletal muscle mitochondrial function by increasing quality control and network surveillance in aged mice. (A) Representative bands of DRP1, Mid49, Mid51, FIS1, MFN2, OPA1, PINK1, Parkin, LCIII, and VDAC in isolated mitochondria from tissue extracts and (BC) quantification of protein expression. (D) Representative bands of ubiquinated proteins in total lysates and mitochondrial fraction and Ponceau S. stain and (E) quantification of protein expression. (F) Protein–protein interaction between PINK1 and ubiquitin (input: PINK1, immunoblot: ubiquinated proteins) and quantification. Panels (B), (C), (E), and (F) were assessed by unpaired Student's t‐test. *P < 0.05, **P < 0.01, and ****P < 0.0001 indicate statistical significance for between‐group comparisons, respectively.
Figure 6
Figure 6
Mitochondrial uncoupling reduces skeletal muscle endoplasmic reticulum (ER) stress and apoptotic signalling in aged mice. (A) Representative bands of PERK, eiF2Ser51, total eiF2, ATF3, ATF4, and VDAC and (B) quantification of protein expression. (C) Representative bands of oligomer A11 expression in the soluble and insoluble fractions and Ponceau S. stain and (D) quantification of protein expression (insoluble/soluble fraction ratio). (E) Representative bands of cytochrome C in the cytosolic and mitochondrial compartments, mtCO2 and GAPDH and (F) quantification of protein expression. (G) Representative bands of uncleaved and cleaved caspase‐9, caspase‐3, and VDAC and (H) quantification of protein expression. Panels (B), (D), (F), and (H) were assessed by paired Student's t‐test. **P < 0.01, ***P < 0.001, and ****P < 0.0001 indicate statistical significance for between‐group comparisons, respectively.
Figure 7
Figure 7
Mitochondrial uncoupling reduces skeletal muscle protein degradation in aged mice. (A) Representative bands of soluble and insoluble 14‐kDa β‐actin fragment and Ponceau S. stain in tissue extracts and (B) quantification of protein expression (insoluble/soluble fraction ratio). (C) Gene expression of MuRF1, Atrogin‐1, and myostatin (MSTN) normalized to β‐actin. Panels (B) and (C) were assessed by unpaired Student's t‐test. **P < 0.01, ***P < 0.001, and ****P < 0.0001 indicate statistical significance for between‐group comparisons, respectively.
Figure 8
Figure 8
Working model of mitochondrial uncoupling‐mediated attenuation of sarcopenic obesity in aged mice. Ageing in the context of obesity accelerates skeletal muscle mitochondrial damage via chronic inflammation and insulin resistance. The release of cytochrome C from damaged mitochondria triggers activation of caspase‐mediated apoptosis, increasing the rate of protein degradation and over time, resulting in diminished muscle mass and function. Mitochondrial uncoupling preserves muscle mass and function by enhancing mitochondrial quality control, biogenesis, and fusion. Improving mitochondrial fitness restricts the release of cytochrome C and activation of intrinsic apoptotic signalling, improving networking with endoplasmic reticulum, and subsequently decreasing muscular inflammation and improving muscle quality.

References

    1. Nations U . World Population Ageing 2020 Highlights: Living Arrangements of Older Persons. 2020. https://www.un.org/development/desa/pd/news/world‐population‐ageing‐2020...
    1. Chomentowski P, Dube JJ, Amati F, Stefanovic‐Racic M, Zhu S, Toledo FG, et al. Moderate exercise attenuates the loss of skeletal muscle mass that occurs with intentional caloric restriction‐induced weight loss in older, overweight to obese adults. J Gerontol A Biol Sci Med Sci 2009;64:575–580. - PMC - PubMed
    1. Bachettini NP, Bielemann RM, Barbosa‐Silva TG, Menezes AMB, Tomasi E, Gonzalez MC. Sarcopenia as a mortality predictor in community‐dwelling older adults: a comparison of the diagnostic criteria of the European Working Group on Sarcopenia in Older People. Eur J Clin Nutr 2020;74:573–580. - PubMed
    1. Batsis JA, Villareal DT. Sarcopenic obesity in older adults: aetiology, epidemiology and treatment strategies. Nat Rev Endocrinol 2018;14:513–537. - PMC - PubMed
    1. Porter C, Hurren NM, Cotter MV, Bhattarai N, Reidy PT, Dillon EL, et al. Mitochondrial respiratory capacity and coupling control decline with age in human skeletal muscle. Am J Physiol Endocrinol Metab 2015;309:E224–E232. - PMC - PubMed

Publication types