. 2022 Apr 5;34(4):533-548.e12.
doi: 10.1016/j.cmet.2022.02.016. Epub 2022 Mar 18.

Ejection of damaged mitochondria and their removal by macrophages ensure efficient thermogenesis in brown adipose tissue

Affiliations

Ejection of damaged mitochondria and their removal by macrophages ensure efficient thermogenesis in brown adipose tissue

Marco Rosina et al. Cell Metab. .

Abstract

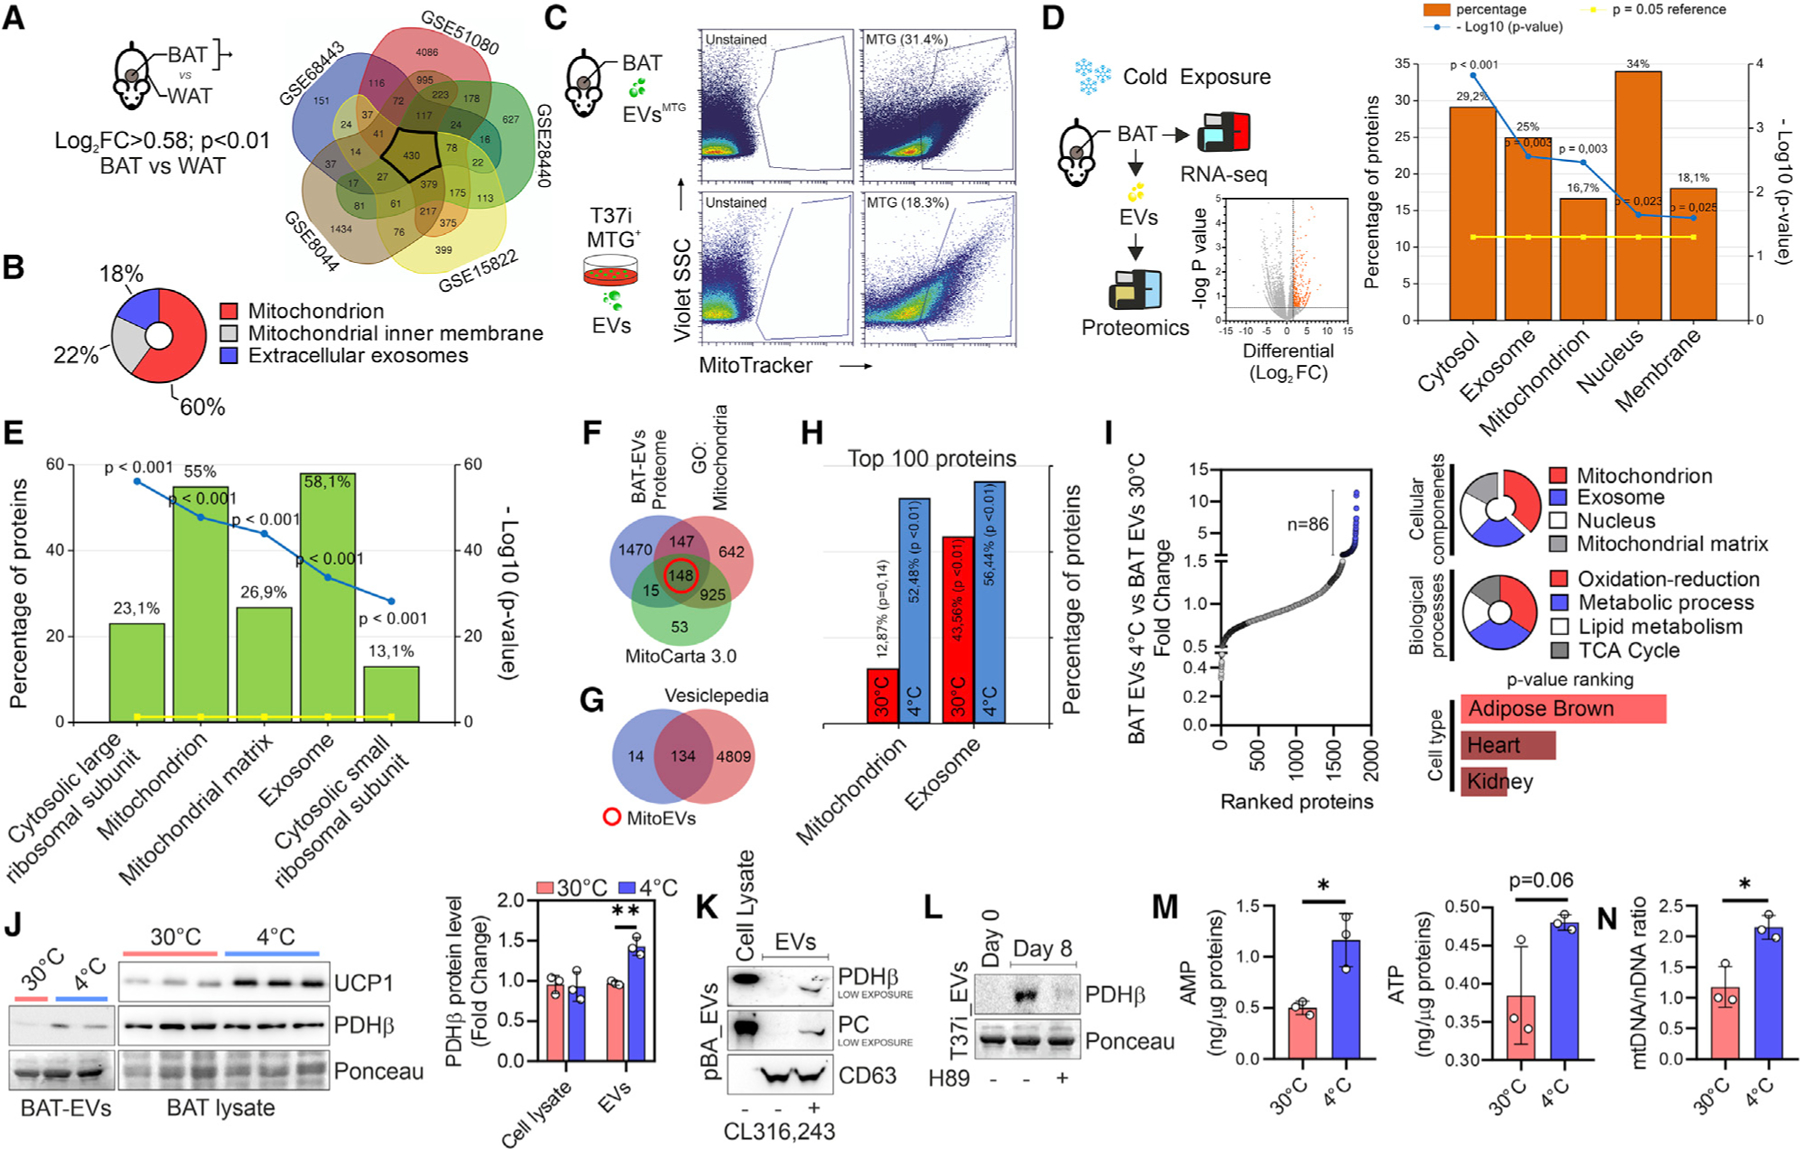
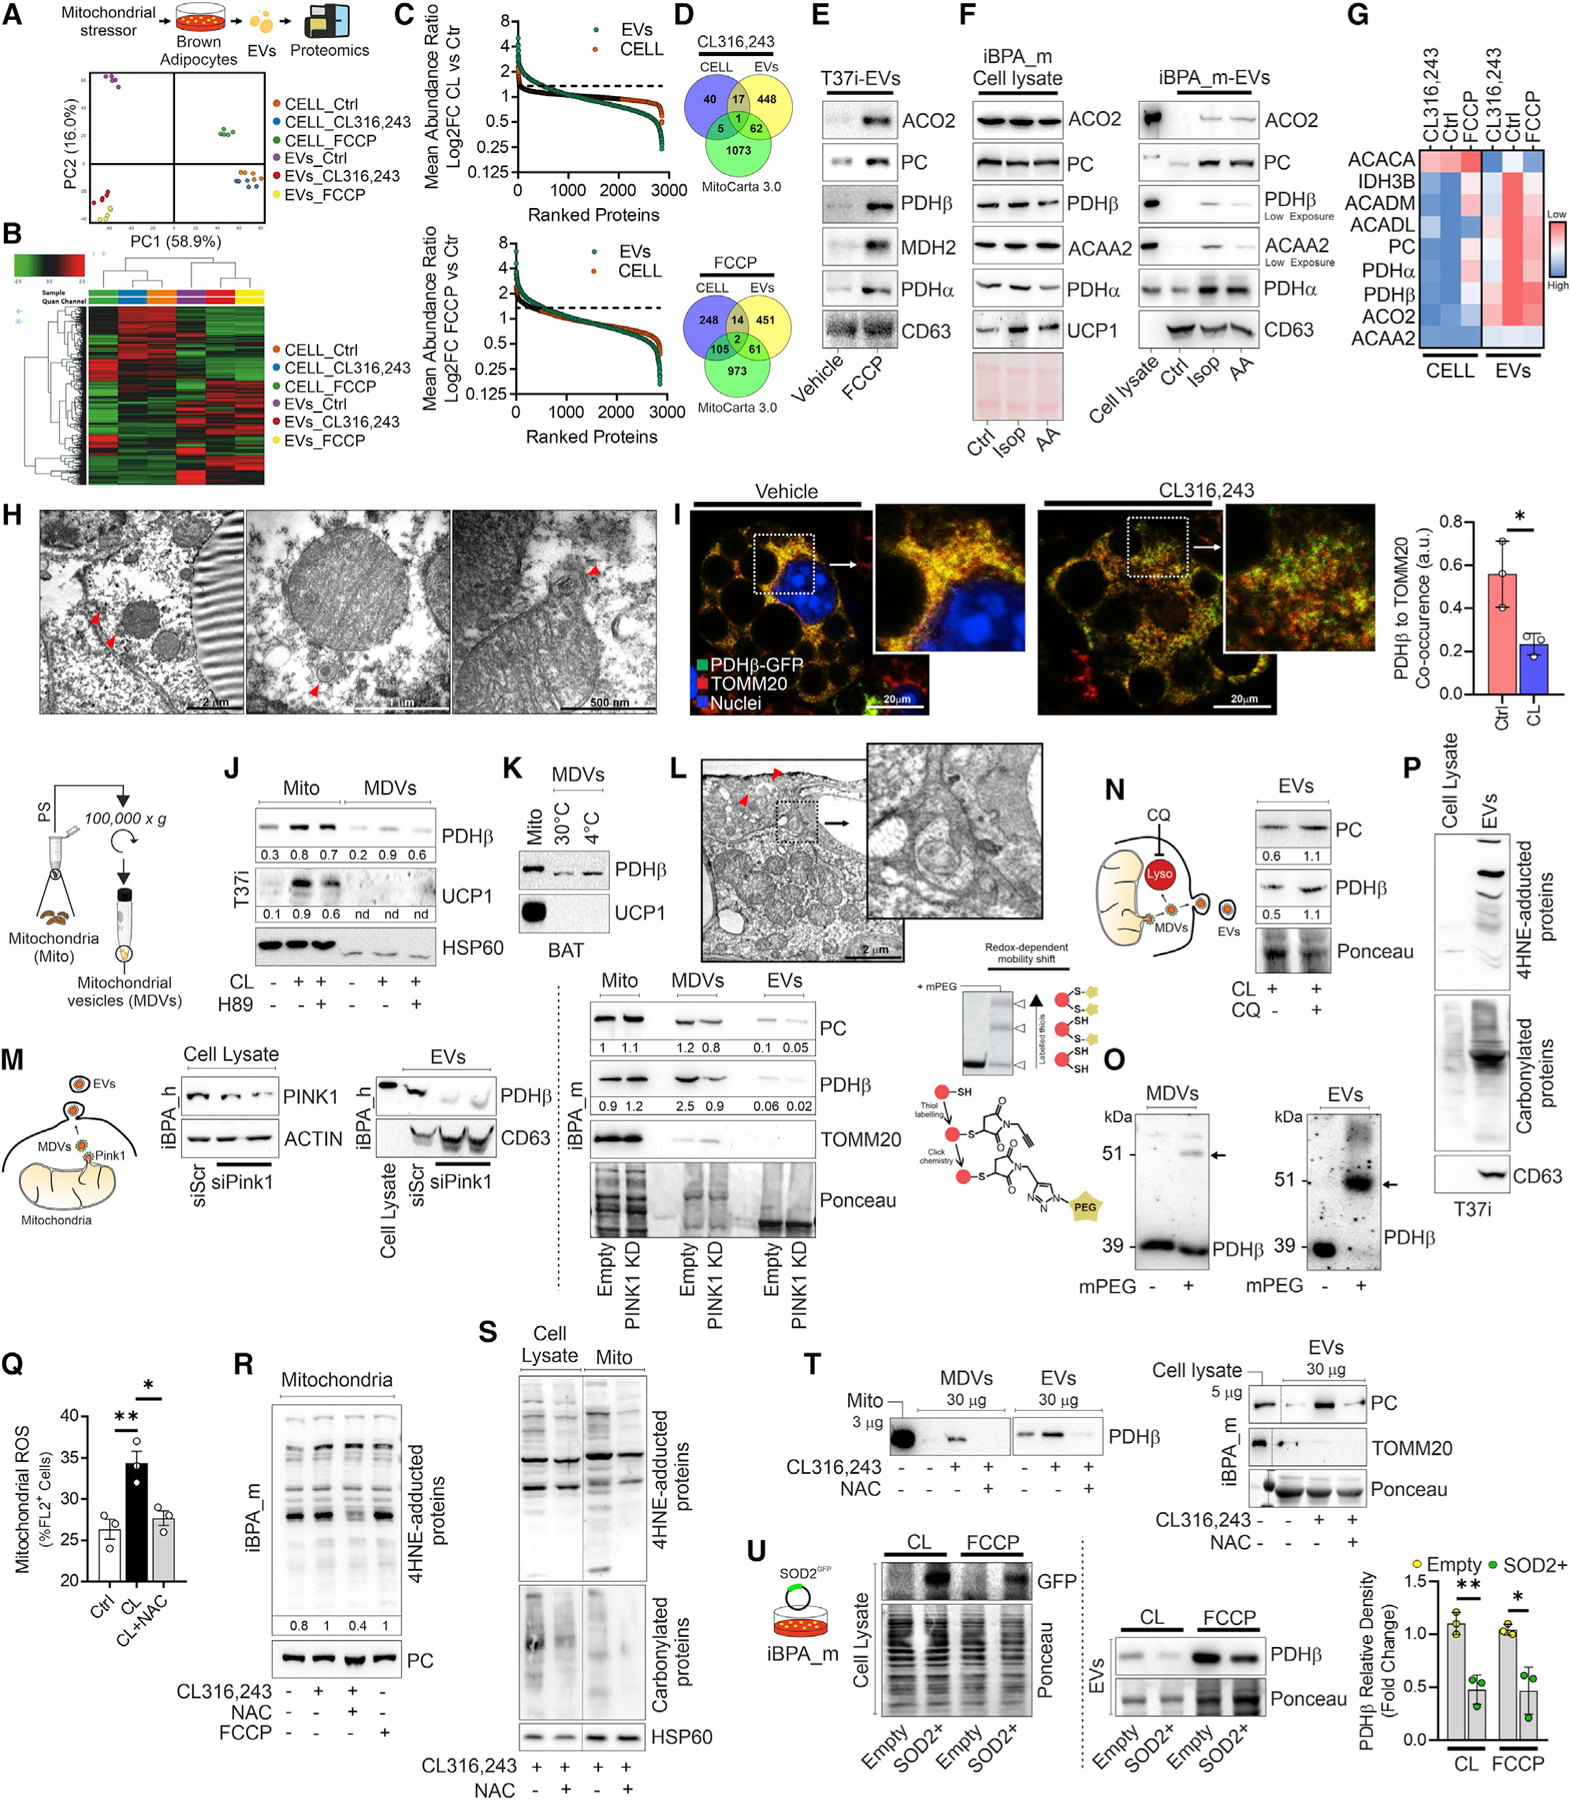
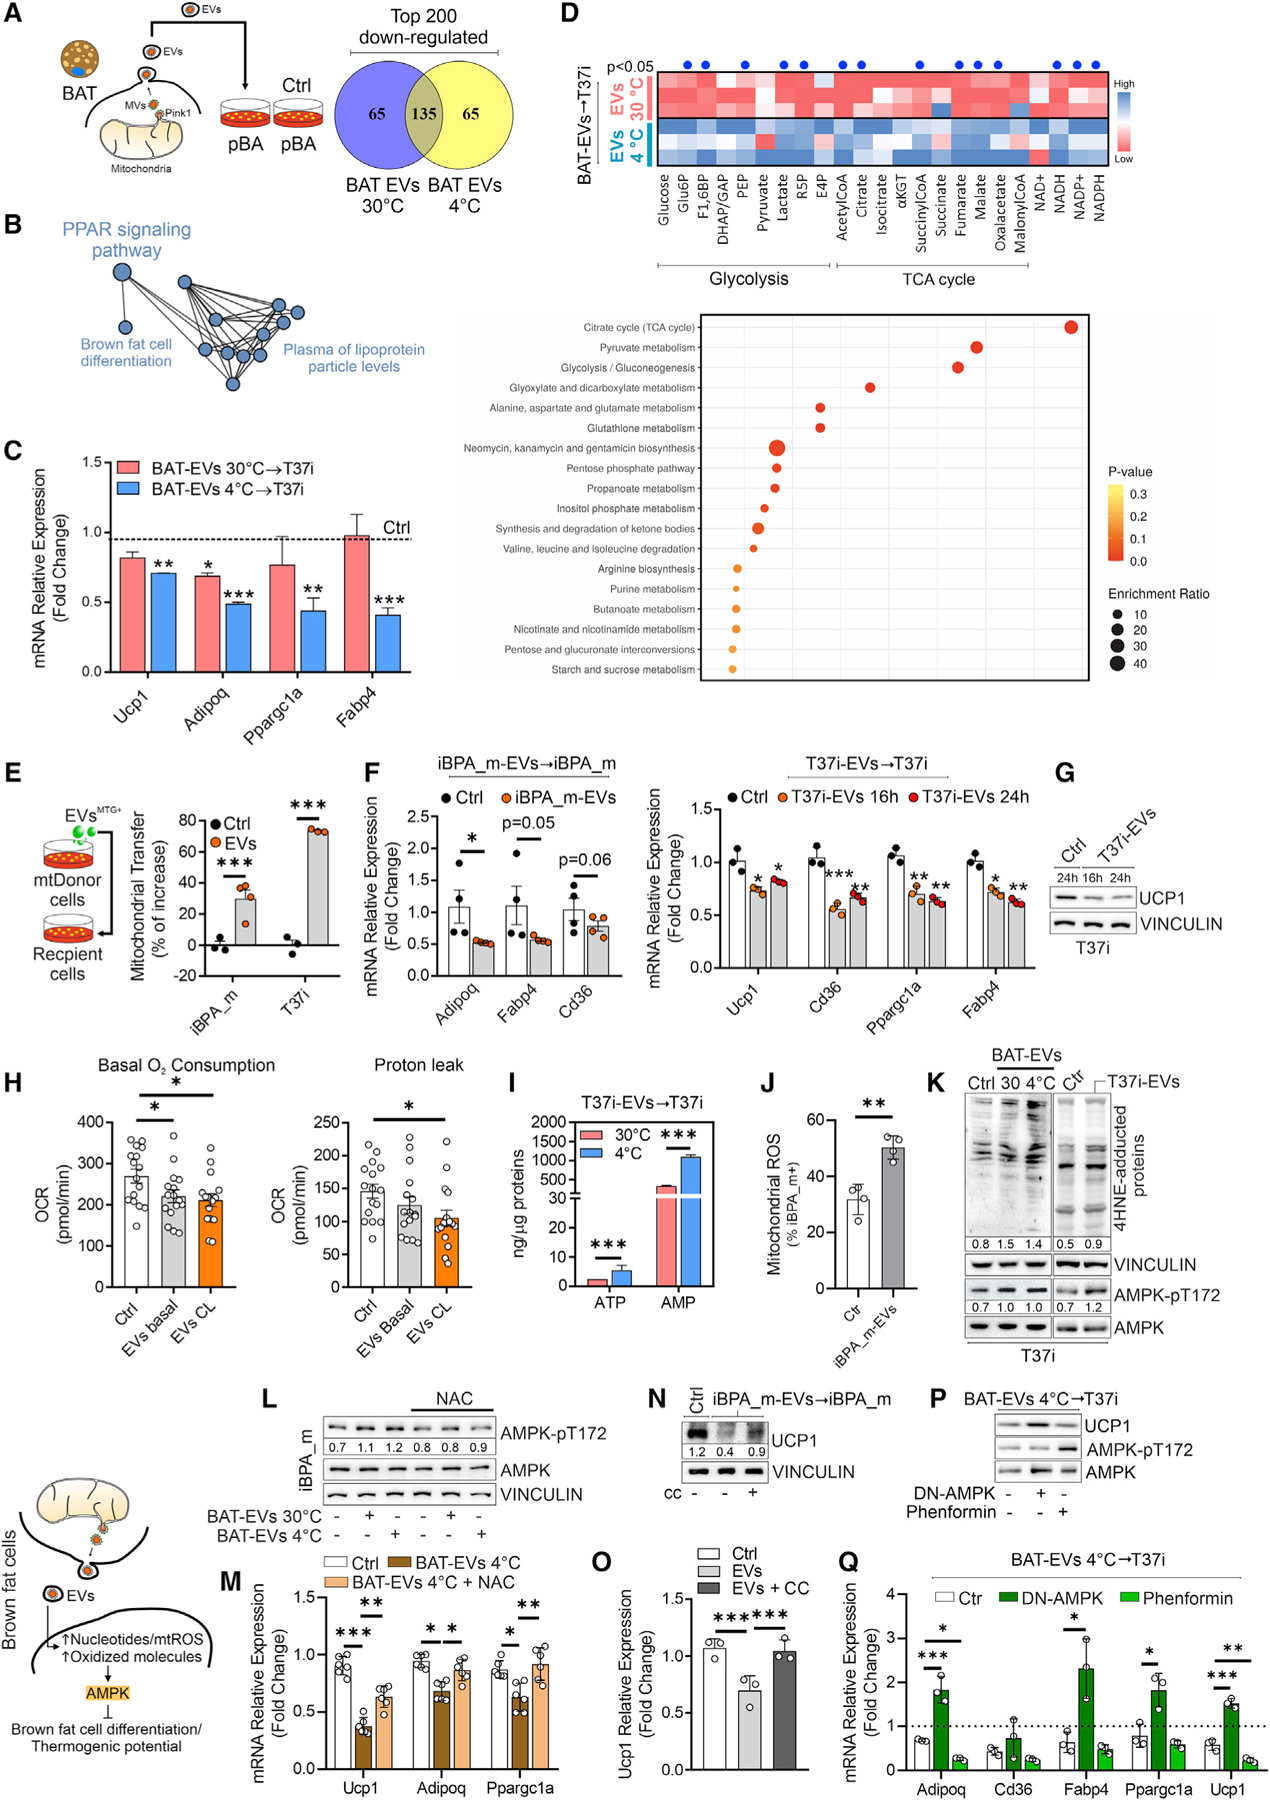
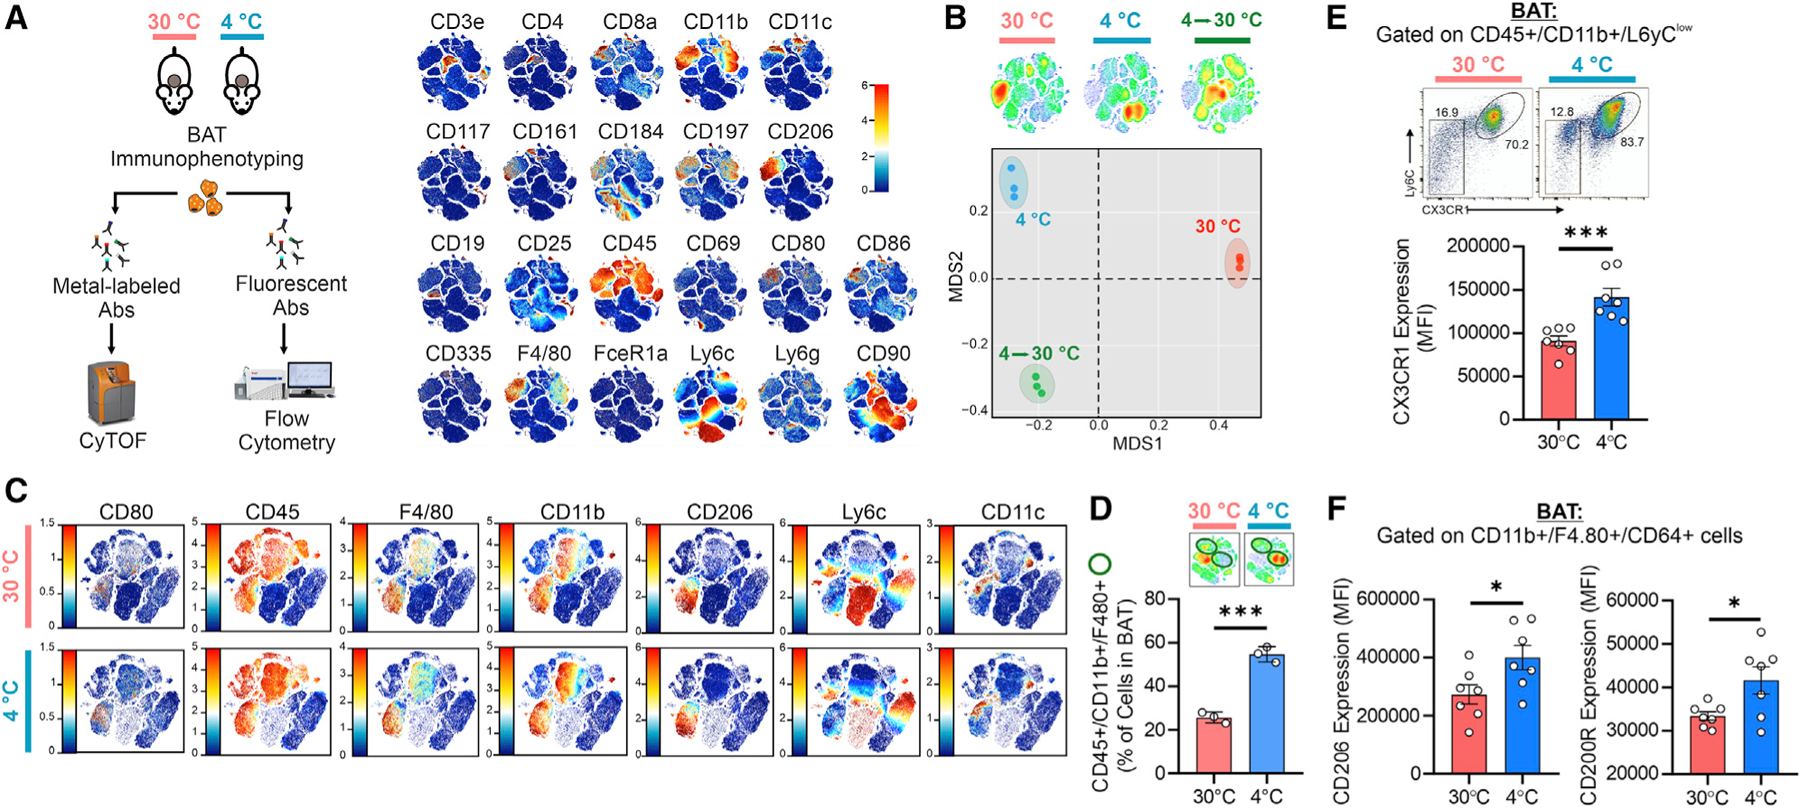
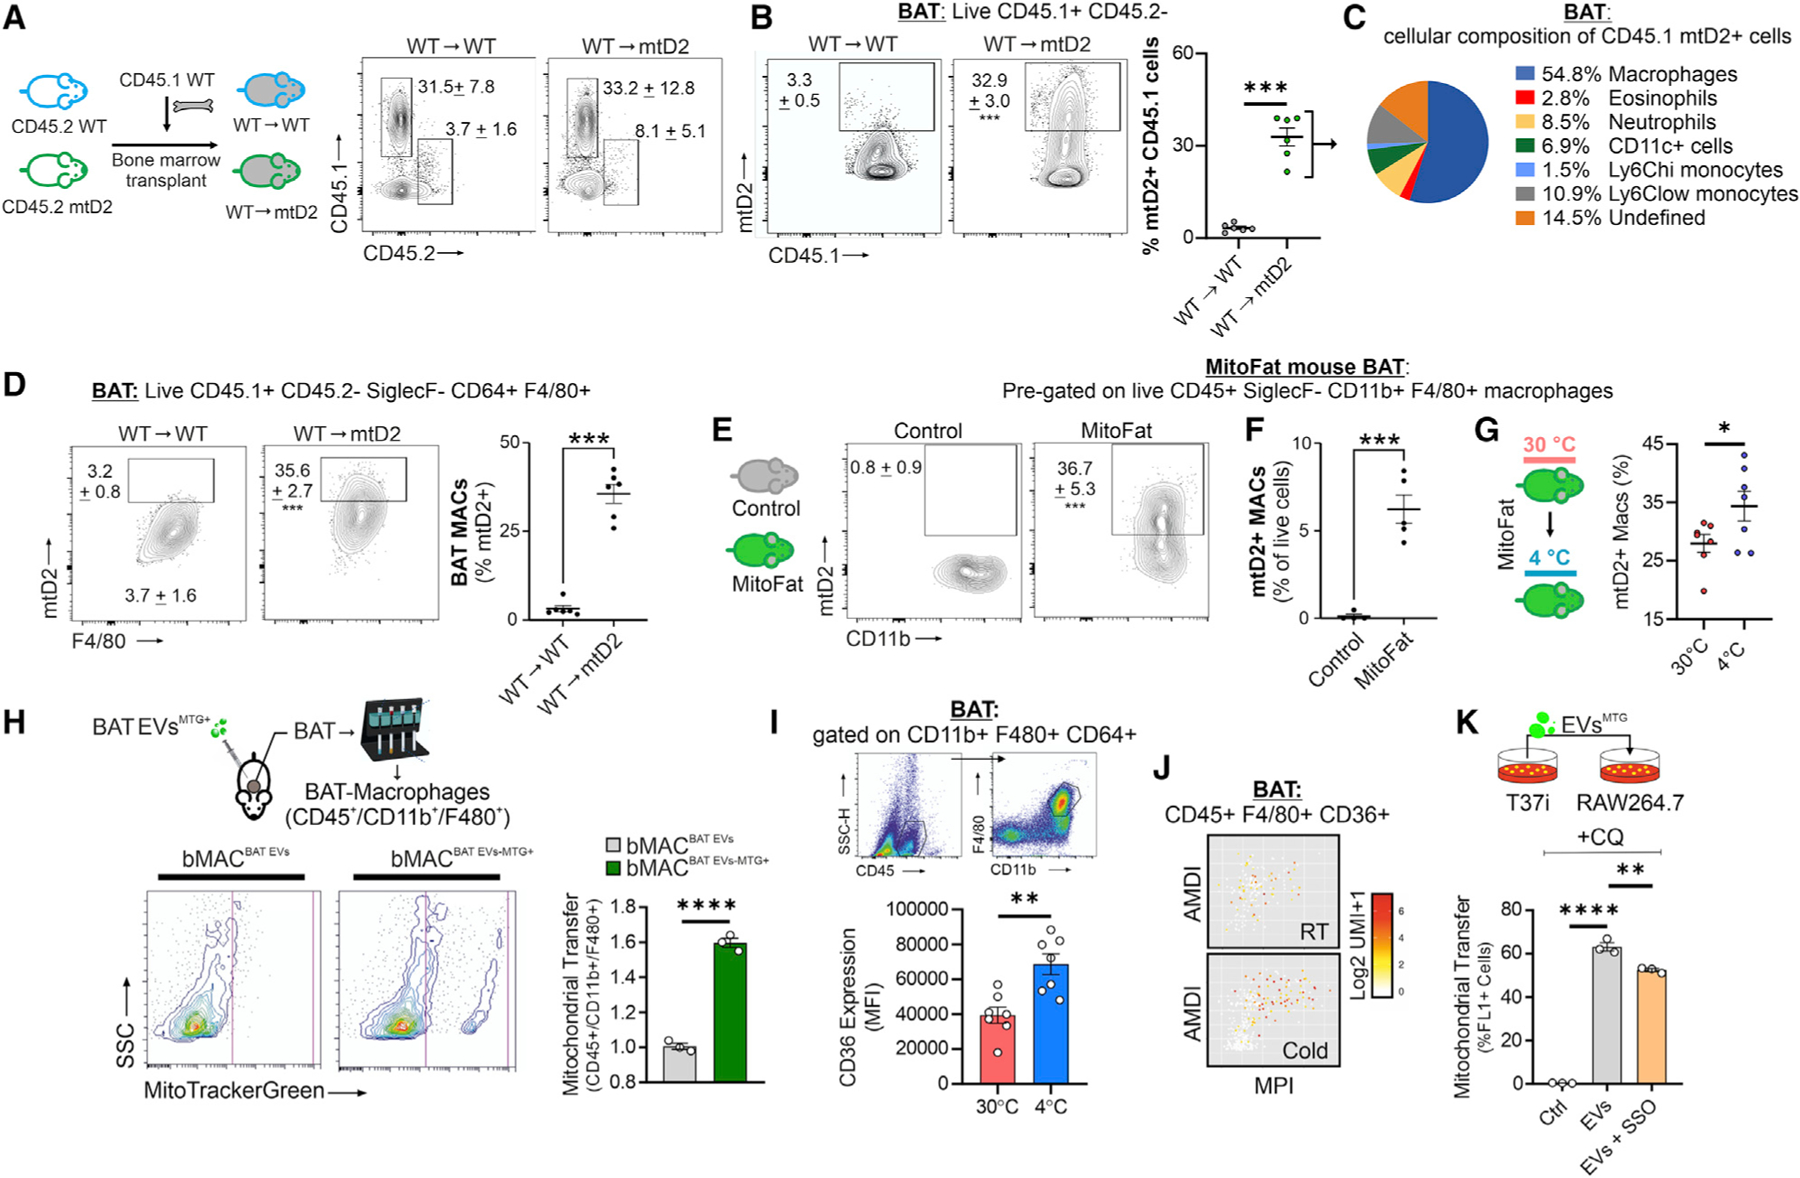
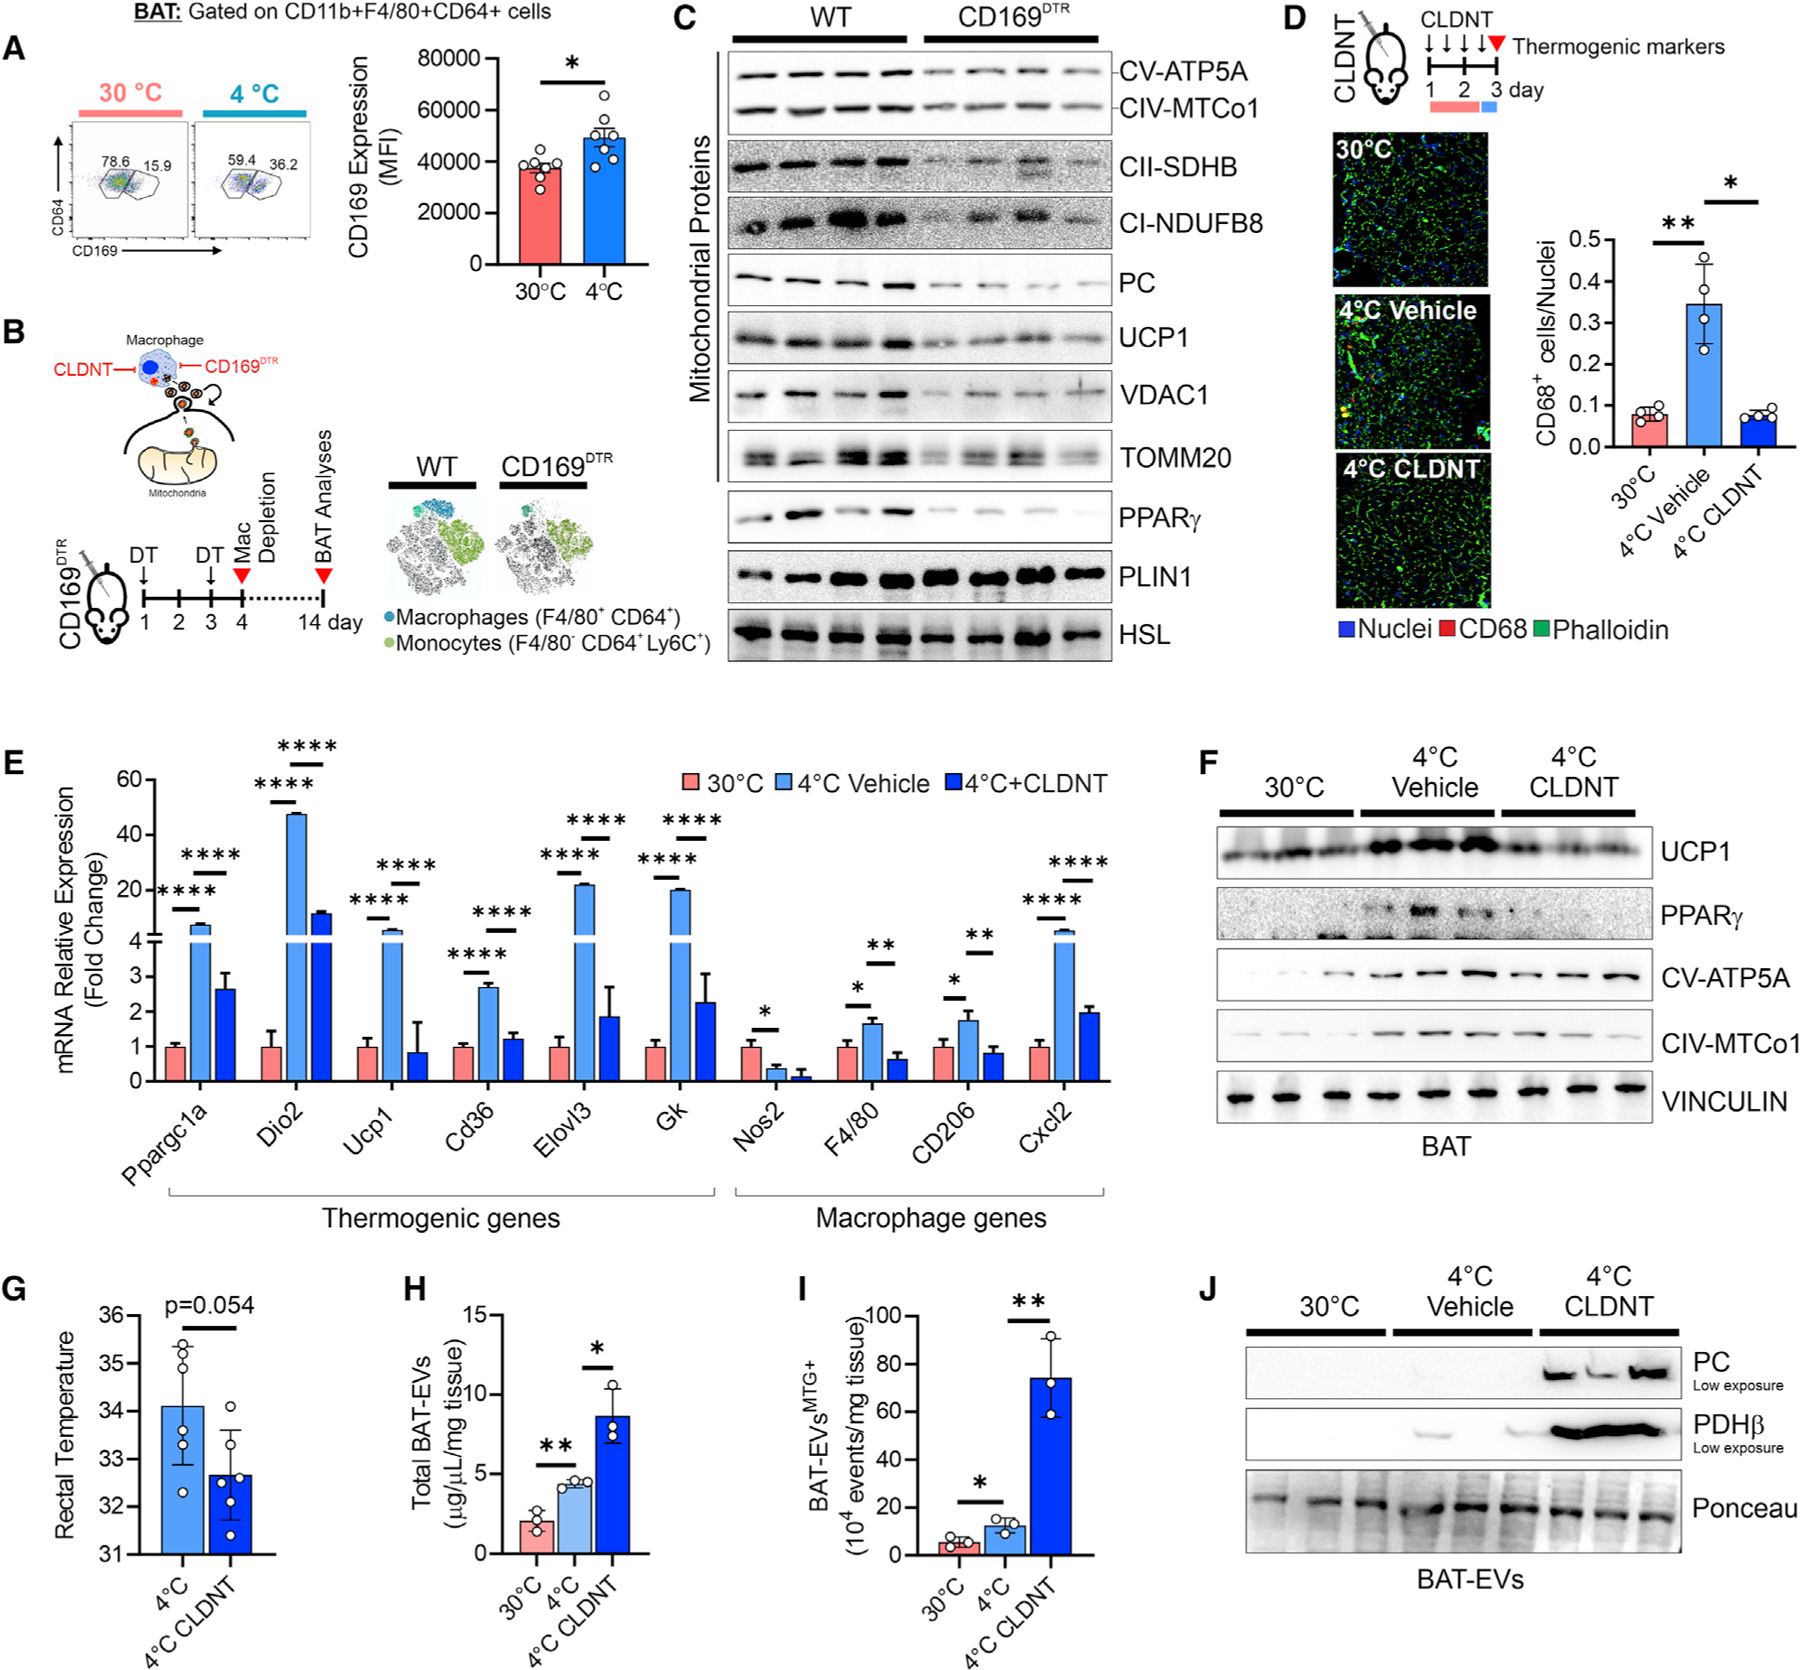
Recent findings have demonstrated that mitochondria can be transferred between cells to control metabolic homeostasis. Although the mitochondria of brown adipocytes comprise a large component of the cell volume and undergo reorganization to sustain thermogenesis, it remains unclear whether an intercellular mitochondrial transfer occurs in brown adipose tissue (BAT) and regulates adaptive thermogenesis. Herein, we demonstrated that thermogenically stressed brown adipocytes release extracellular vesicles (EVs) that contain oxidatively damaged mitochondrial parts to avoid failure of the thermogenic program. When re-uptaken by parental brown adipocytes, mitochondria-derived EVs reduced peroxisome proliferator-activated receptor-γ signaling and the levels of mitochondrial proteins, including UCP1. Their removal via the phagocytic activity of BAT-resident macrophages is instrumental in preserving BAT physiology. Depletion of macrophages in vivo causes the abnormal accumulation of extracellular mitochondrial vesicles in BAT, impairing the thermogenic response to cold exposure. These findings reveal a homeostatic role of tissue-resident macrophages in the mitochondrial quality control of BAT.

Keywords: adipose tissue; brown adipocytes; extracellular vesicles; homeostasis; immunometabolism; macrophages; mitochondria; mitochondrial quality control; thermogenesis.


Conflict of interest statement

Declaration of interests J.R.B. has a pending patent application related to mitochondria transfer. The other authors declare no competing interests.

Figures

Figure 1.
Figure 1.. BAT releases mitochondrial parts via EVs
(A) Experimental design and Venn diagram of over-represented genes in BAT with respect to WAT, which were obtained by analyzing different GEO datasets. (B) The three most representative cellular components of the 430 overlapping genes in (A) are shown (p < 0.05). (C) Experimental design and flow-cytometry analysis of BAT EVs labeled with MitoTracker Green (MTG) (upper panel) and EVs isolated from MTG-labeled T37i adipocytes (lower panel). (D) Experimental design and volcano plot (left panel) of differentially expressed genes in the BAT of mice at 4°C versus mice at 30°C (n = 4 mice/group). The five most representative cellular components (p < 0.05) are shown (right panel). (E) Proteomic analysis of BAT EVs of mice at 4°C versus mice at 30°C. The five most representative cellular components (p < 0.001) are shown. Data are obtained from a pool of BAT EVs (n = 6 mice/group). (F and G) Venn diagram of the BAT EV proteome with proteins reported in mouse MitoCarta 3.0 and GO terms for mitochondria (F). The 148 overlapping proteins (red circle) were integrated with the Vesiclepedia database (G) after filtering ‘‘mouse’’ species and ‘‘mass spectrometry’’ for analysis. (H) Proteomic analysis of BAT EVs. The 100 most represented proteins were compared for mitochondrial and extracellular exosome compartments. Data are obtained from a pool of BAT EVs (n = 6 mice/group). (I) Up-regulated proteins in BAT EVs at 4°C (n = 86; FC > 2.0, blue dots) (left panel). The most significant enriched terms (p < 0.05) for cellular components, biological processes, and cell type are shown (right panel). (J) Immunoblots of BAT EVs and BAT homogenates (left panel). Densitometric analyses of immunoreactive bands (right panel) are reported as a ratio between PDHβ and Ponceau (loading control). Student’s t test, **p < 0.01, n = 6 mice/group or n = 6 mice/group pooled in pairs for EVs. (K) Immunoblots of EVs released from primary murine brown adipocytes (pBA) treated with vehicle or CL316,243. CD63 was used as an EV loading control. (L) Immunoblot of EVs released from undifferentiated (day 0), untreated, or H89-treated T37i adipocytes (day 8). Ponceau was used as loading control. (M and N) Targeted metabolomics (M) and qPCR analysis of the mtDNA/nDNA ratio (N) in BAT EVs. Data are obtained from a pool of BAT EVs (n = 6 mice/group pooled in pairs). Student’s t test, *p < 0.05. See also Figure S1.
Figure 2.
Figure 2.. Brown adipocytes release oxidized mitochondrial proteins through an MDVs/PINK1-dependent mechanism
(A and B) Experimental design and PCA (A) and hierarchical clustering heatmap (B) obtained by proteomics of primary adipocytes (pBAs) treated with CL316,243 or FCCP and the related EVs. (C) Mean abundance ratio of proteins detected in pBAs following CL (upper panel) or FCCP treatment (lower panel) and related EVs. (D) Venn diagram integrating mitochondrial proteins (MitoCarta 3.0) with up-regulated proteins (FC > 1.3) in pBAs treated with CL316,243 (upper panel) or FCCP (lower panel) and the related EVs. (E) Immunoblots of EVs released from T37i treated with FCCP. CD63 was used as an EV loading control. (F) Immunoblots of iBPA_m treated with isoproterenol (Iso) or antimycin A (AA) and the related EVs. Ponceau and CD63 were used as lysate and EV loading controls, respectively. (G) Heatmap of the mean abundance of mitochondrial proteins in pBAs and the related EVs under basal conditions (Ctr) and the following CL or FCCP treatment. (H) Representative TEM images of BAT from mice at 4°C. Red arrows indicate mitochondrial buddings. (I) Representative confocal microscopy images of iBPA_m transduced with lentiviral particles carrying PDHβ -GFP (green) and labeled with TOMM20 (red) antibodies. Histogram shows colocalization between PDHβ -GFP and TOMM20 under basal conditions or after CL treatment. Student’s t test, *p < 0.05, n = 3. (J and K) Immunoblots of crude mitochondria or MDVs isolated from T37i adipocytes (J) or BAT (K) following CL treatment or cold exposure, respectively. H89 was used to inhibit cAMP/PKA signaling. HSP60 was used as loading control. Densitometric analyses (J) were reported below as the ratio between PDHβ or UCP1 and HSP60. (L) Representative TEM images of BAT at 4°C. Red arrows indicate a multivesicular body containing mitochondria. Image magnification reports the presence of intercellular EVs. (M) Immunoblots of iBPA_h transiently transfected with siRNA against PINK1 (PINK1-KD) and the related EVs. Actin and CD63 were used as cell lysate and EV loading controls (left panels). Immunoblots of crude mitochondria, MDVs, and EVs isolated from iBPA_m transduced with PINK1 shRNA lentiviral particle (PINK1-KD). Ponceau was used as loading control. Densitometric analyses were reported below as ratio between protein and loading control (right panel). (N) Experimental design and immunoblots of iBPA_m treated with CL and cotreated with vehicle or chloroquine (CQ). Ponceau was used as loading control. Densitometric analysis was reported below as ratio between PC or PDHβ and loading control. (O) Immunoblots of T37i MDVs and EVs. Protein oxidation was determined after protein cysteine derivatization by MalPEG (mPEG). Black arrows indicate the mobility shift caused by mPEG conjugation. (P) Immunoblots of T37i EVs. CD63 was used as loading control. (Q) Flow-cytometry analysis of mitochondrial ROS production in iBPA_m treated with CL or cotreated with NAC. ANOVA test with multiple comparison correction, *p < 0.05; **p < 0.01, n = 3. (R) Immunoblots of mitochondria isolated from iBPA_m treated with CL or FCCP and cotreated with vehicle or NAC. PC was used as loading control. (S) Immunoblots of cell lysates and mitochondria isolated from T37i treated with CL and cotreated with NAC. HSP60 was used as loading control. (T) Immunoblots of MDVs and EVs isolated from T37i (left panel) and EVs isolated from iBPA_m (right panel) after treatment with CL and co-treatment with vehicle or NAC. TOMM20 and Ponceau were used as EV purity and loading control, respectively. (U) Experimental design and immunoblots of iBPA_m transduced with lentiviral particles carrying SOD2-GFP (left panel) and related EVs (right panel). Densitometric analyses were reported as ratio between PDHβ in EVs and loading control (Ponceau staining). Student’s t test, *p < 0.05; **p < 0.01. See also Figure S1.
Figure 3.
Figure 3.. BAT EVs affect PPARγ signaling in brown adipocytes
(A and B) Experimental design and Venn diagram (A) of the top 200 downregulated genes in pBAs treated (16 h) with BAT EVs. The 135 overlapping genes in (A) are represented by a functional protein association network (STRING) (B). (C) s of PPARγ target genes in T37i treated (16 h) with BAT EVs. Student t test, *p < 0.05; **p < 0.01 vs. Ctrl, n = 3. (D) Targeted metabolomics of T37i treated with BAT EVs (16 h). Results are reported as a heatmap (upper panel) and an enrichment pathway analysis (lower panel) of differentially modulated metabolites. Student’s t test, p < 0.05 (blue dots). (E) Experimental design and flow-cytometry analysis of iBPA_m and T37i treated (4 h) with MTG-labeled EVs isolated from the same cell type (1:1 cell ratio). Student’s t test, ***p < 0.001, n = 3. (F) qPCR analysis of PPAR-related genes in iBPA_m (left panel) and T37i (right panel) treated with EVs isolated from the same cell type (1:1 cell ratio). Student’s t test, *p < 0.05; **p < 0.01; ***p < 0.001, n = 3. (G) Immunoblots of T37i treated with EVs isolated from the same cell type (1:1 cell ratio). VINCULIN was used as loading control. (H) Basal oxygen consumption and proton leak analyzed by Sea-horse technology in iBPA_m treated (16 h) with EVs isolated from the same cell type (1:1 cell ratio). Two-way ANOVA test, *p < 0.05, n = 9. (I) AMP and ATP quantitation in T37i treated (16 h) with BAT EVs. Student’s t test, ***p < 0.01, n = 3. (J) Flow-cytometry analysis of mitochondrial ROS in iBPA_m treated with EVs isolated from the same cell type (1:1 cell ratio). Student’s t test, **p < 0.01, n = 3. (K) Immunoblots of T37i treated (16 h) with BAT EVs (n = 3 mice/group) or EVs isolated from the same cell type (1:1 cell ratio). VINCULIN was used as loading control. Densitometric analyses were reported as ratio between AMPKpT172 and AMPK or 4-HNE protein adducts and VINCULIN. (L) Experimental design and immunoblots of iBPA_m treated (16 h) with BAT EVs and cotreated with NAC (n = 3 mice/group). VINCULIN was used as loading control. Densitometric analyses were reported as ratio between AMPKpT172 and AMPK. (M) qPCR analysis of iBPA_m treated with BAT EVs at 4°C and cotreated with NAC. Two-way ANOVA test, *p < 0.05; **p < 0.01; ***p < 0.001, n = 6. (N and O) UCP1 protein (N) and mRNA (O) in iBPA_m treated with EVs (16 h) isolated from the same cell type (1:1 cell ratio) and cotreated with compound-c (CC). VINCULIN was used as loading control. Densitometric analysis was reported as ratio between UCP1 and VINCULIN. Two-way ANOVA test, ***p < 0.001, n = 3). (P and Q) Immunoblots (P) and qPCR analysis (Q) of T37i treated with BAT EVs (16 h). Phenformin or DN-AMPK was used as AMPK agonist or antagonist, respectively. Two-way ANOVA test, *p < 0.05; **p < 0.01; ***p<0.001, n = 3). See also Figure S2.
Figure 4.
Figure 4.. Macrophage dynamics in BAT during temperature changes
(A) Experimental design and merged single t-SNE maps obtained by CyTOF analysis (n = 6 mice/group pooled in pairs). (B) CyTOF t-SNE maps of antigen redistribution (upper panel) and multidimensional plot of antigen expression (bottom panel) (n = 6 mice/group pooled in pairs). (C) CyTOF t-SNE maps of the antigen subsets (n = 6 mice/group pooled in pairs). (D) CyTOF density map (upper panel). Percentage of macrophages (lower panel). Student’s t test, ***p < 0.001, n = 3. (E and F) Flow-cytometry density plot and quantitation of CX3CR1 expression in monocytes (E), and CD206 and CD200R expression in macrophages (F). Student’s t test, **p < 0.01, n = 7 mice/group. See also Figures S3 and S4.
Figure 5.
Figure 5.. BAT-resident macrophages regulate the removal of brown adipocytes EVs via the CD36-lysosomal pathway
(A) Experimental design for panels (A–D), in which CD45.1 wild-type (WT) bone marrow was transplanted into either CD45.2 WT or CD45 mtD2 mitochondria reporter mice. Flow cytometry plots of CD45.1 WT donor cells and radioresistant CD45.2 host immune cells in BAT from chimeras after 12 weeks of engraftment. (B) Flow cytometry plots and percentages of WT CD45.1 donor cells that are mtD2+. (C) Cellular composition of CD45.1 WT donor cells that are mtD2+. (D) Flow cytometry plots with the percentage of macrophages that are mtD2+. (E) Flow cytometry plots of macrophages from BAT of MitoFat adipocyte-specific mitochondria reporter mice and negative controls. Percentages shown represent macrophages that are mtD2+. (F) Percentage of live cells in BAT that are mtD2+ macrophages. (G) Experimental design and percent of mtD2+ macrophages in BAT from MitoFat mice at 4°C or 30°C. Data are expressed as mean ± SEM. Student’s t tests, *p < 0.05, **p < 0.01, ***p < 0.001, n = 7 mice/group. (H) Experimental design and flow-cytometry analysis of bMACs isolated from BAT of mice injected with BAT EVs labeled with MTG (bMACBAT EVs-MTG) or unlabeled BAT EVs (bMACBAT EVs). Student’s t test, ****p < 0.0001, n = 3 mice/group. (I) Experimental design, flow cytometry density plot and quantitation of CD36 expression in bMACs. Student’s t test, **p < 0.01, n = 7 mice/group. (J) MacSpectrum plots of Cd36 expression in bMACs extrapolated from scRNA-seq (GSE160585). (K) Flow-cytometry analysis of RAW264.7 treated with T37i EVs labeled with MTG. Sulfo-N-succinimidyl oleate (SSO) was added 1 h prior to EV treatment to inhibit CD36. CQ treatment was used to inhibit lysosome activity. Two-way ANOVA test, **p < 0.01, ****p < 0.0001; n = 3. See also Figure S5.
Figure 6.
Figure 6.. Macrophages control the thermogenic capacity of BAT
(A) Flow cytometry density plot and quantitation of CD169+ bMACs. Student’s t test, *p < 0.05, n = 7 mice/group. (B) Experimental design and t-SNE map of antigen redistribution in BAT of WT and CD169DTR mice 4 days after DT injection. (C) Immunoblots of BAT from WT and CD169DTR mice 14 days after DT injection. HSL was used as loading control (n = 4 mice/group). (D) Experimental design and representative fluorescence micrographs of BAT stained with the CD68 antibody (red) to detect bMACs. Quantification of CD68+ bMACs is reported (right panel). ANOVA, *p < 0.05, **p < 0.01, n = 4 mice/group. (E–G) qPCR (E), immunoblot (F) of BAT and rectal temperature (G) of mice at 30°C and 4°C. Mice were pre-treated with liposome clodronate (CLDNT) prior to cold exposure. ANOVA, *p < 0.05, **p < 0.01, ****p < 0.001; n = 3 or n = 6 mice/group. (H and I) Flow-cytometry quantitation of total EVs (H) and MTG+ EVs (I) released from BAT. Student’s t test, *p < 0.05, **p < 0.01; n = 3 mice/group. (J) Representative iunoblots of BAT EVs. Ponceau was used as loading control (n = 3 mice/group). See also Figure S6.

Comment in

  • Mitochondrial transfer in BAT.
    Starling S. Starling S. Nat Rev Endocrinol. 2022 Jun;18(6):334. doi: 10.1038/s41574-022-00674-7. Nat Rev Endocrinol. 2022. PMID: 35393577 No abstract available.

References

    1. Abuaita BH, Schultz TL, and O’Riordan MX (2018). Mitochondria-derived vesicles deliver antimicrobial reactive oxygen species to control phagosome-localized Staphylococcus aureus. Cell Host Microbe 24, 625–636.e5. 10.1016/j.chom.2018.10.005. - DOI - PMC - PubMed
    1. Ahmad B, Serpell CJ, Fong IL, and Wong EH (2020). Molecular mechanisms of adipogenesis: the anti-adipogenic role of AMP-activated protein kinase. Front. Mol. Biosci 7, 76. 10.3389/fmolb.2020.00076. - DOI - PMC - PubMed
    1. Amari L, and Germain M (2021). Mitochondrial extracellular vesicles—origins and roles. Front. Mol. Neurosci 14, 767219. 10.3389/fnmol.2021.767219. - DOI - PMC - PubMed
    1. Aquilano K, Sciarretta F, Turchi R, Li BH, Rosina M, Ceci V, Guidobaldi G, Arena S, D’Ambrosio C, Audano M, et al. (2020). Low-protein/high-carbohydrate diet induces AMPK-dependent canonical and non-canonical thermogenesis in subcutaneous adipose tissue. Redox Biol 36, 101633. 10.1016/j.redox.2020.101633. - DOI - PMC - PubMed
    1. Becher T, Palanisamy S, Kramer DJ, Eljalby M, Marx SJ, Wibmer AG, Butler SD, Jiang CS, Vaughan R, Schöder H, et al. (2021). Brown adipose tissue is associated with cardiometabolic health. Nat. Med 27, 58–65. 10.1038/s41591-020-1126-7. - DOI - PMC - PubMed

Publication types

MeSH terms

Substances