. 2022 Apr 7;82(7):1261-1277.e9.
doi: 10.1016/j.molcel.2022.02.028. Epub 2022 Mar 18.

Hexokinase 1 cellular localization regulates the metabolic fate of glucose

Affiliations

Hexokinase 1 cellular localization regulates the metabolic fate of glucose

Adam De Jesus et al. Mol Cell. .

Abstract

The product of hexokinase (HK) enzymes, glucose-6-phosphate, can be metabolized through glycolysis or directed to alternative metabolic routes, such as the pentose phosphate pathway (PPP) to generate anabolic intermediates. HK1 contains an N-terminal mitochondrial binding domain (MBD), but its physiologic significance remains unclear. To elucidate the effect of HK1 mitochondrial dissociation on cellular metabolism, we generated mice lacking the HK1 MBD (ΔE1HK1). These mice produced a hyper-inflammatory response when challenged with lipopolysaccharide. Additionally, there was decreased glucose flux below the level of GAPDH and increased upstream flux through the PPP. The glycolytic block below GAPDH is mediated by the binding of cytosolic HK1 with S100A8/A9, resulting in GAPDH nitrosylation through iNOS. Additionally, human and mouse macrophages from conditions of low-grade inflammation, such as aging and diabetes, displayed increased cytosolic HK1 and reduced GAPDH activity. Our data indicate that HK1 mitochondrial binding alters glucose metabolism through regulation of GAPDH.

Keywords: GAPDH; S-nitrosylation; hexokinase; inflammation; innate immunity; macrophage; metabolism; mitochondria; pentose phosphate pathway; subcellular localization.


Conflict of interest statement

Declaration of interests The authors declare no competing interests.

Figures
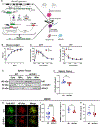
Figure 1.
Figure 1.. Deletion of HK1 MBD in mice using CRISPR-Cas9
(A) Schematic of HK1 mouse model generation using CRISPR-Cas9. (B) Mouse weights from 3 to 8 weeks (n=5 mice per condition, repeated measures two-way ANOVA). (C-D) Glucose tolerance test (GTT) (C) and insulin tolerance test (ITT) (D) from 10-week-old mice (n=5 mice per condition, repeated measures two-way ANOVA). (E) Mitochondria and cytosolic protein fractionation and western blot of spleen tissue, blotted for HK1, with VDAC1 mitochondrial marker and α-tubulin cytosolic marker (n=3 mice per condition). (F) HK activity assay normalized to total protein from spleen tissue (n=5 mice per condition, unpaired t-test). (H) Representative immunofluorescence (IF) images probing for HK1 and mitochondria (MT-Red) in isolated BMDMs from WT and ΔE1HK1 mice. (I) Colocalization analysis of IF images using Pearson’s correlation coefficient calculated per cell between MT-Red (red) and HK1 (green) image channels (n=10 cells per condition, unpaired t-test, scale bar = 15μm). (J) 2-NBDG glucose uptake assay normalized to total protein of LPS (200ng/ml)-activated BMDMs (n=4 mice per condition, unpaired t-test). (K) HK activity assay normalized to total protein of LPS (200ng/ml)-activated BMDMs (n=5 mice per condition, unpaired t-test).
Figure 2.
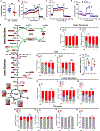
Figure 2.. Loss of HK1 mitochondrial binding alters glucose metabolism and increases PPP intermediates
(A) Extracellular lactate quantification in LPS-activated BMDMs (n=6–9 mice per condition, unpaired t-test). (B) ECAR trace of unstimulated BMDMS ± acute LPS (200ng/ml) stimulation for 2hrs (n=9 mice per condition, repeated measures two-way ANOVA, mean ± SEM). (C) ECAR trace of BMDMS ± 5hrs LPS (200ng/ml) stimulation (n=5 mice per condition, repeated measures two-way ANOVA). (D) OCR trace of BMDMS ± 5hrs LPS (200ng/ml) stimulation (n=5 mice per condition, repeated measures two-way ANOVA). (E) Schematic of 13C-glucose carbon labeling through glycolysis (upper and lower glycolysis), PPP, and TCA cycle. Green arrow indicates increased metabolites and red depicts reduced levels of metabolites. (F-G) 13C-glucose incorporation into upper glycolytic metabolites, G6P (E) and GAP (F), ± 4hrs LPS treatment (n=5 mice per condition, two-way ANOVA, mean ± SEM). (H-I) 13C-glucose incorporation into PPP metabolites, 6-PG (G) and sedoheptulose-7P (H), ± 4hrs LPS treatment (n=5 mice per condition, two-way ANOVA, mean ± SEM). (J) NADPH/NADP+ ratio normalized to total protein in isolated BMDMs ±4hr LPS treatment (N=4 mice per condition, one-way ANOVA and Tukey’s post-hoc test). (K-M) 13C-glucose incorporation into lower glycolytic metabolites, 2/3-PG (J), pyruvate (K), and lactate (L), ± 4hrs LPS treatment (n=5 mice per condition, two-way ANOVA, mean ± SEM). (N-Q) 13C-glucose incorporation into TCA metabolites, citrate (M), αKG (N), succinate (O), and fumarate (P) ± 4hrs LPS treatment (n=5 mice per condition, two-way ANOVA, mean ± SEM).
Figure 3.
Figure 3.. HK1 mitochondrial dissociation increases inflammatory cytokine production in vitro & in vivo
(A-C) Inflammatory cytokine mRNA expression of IL-1β (A), IL-6 (B), and TNFα (C) from isolated BMDMs ± 6hrs LPS (200ng/ml) (n=4 mice per condition, one-way ANOVA and Tukey’s post-hoc test). (D) IL-1β ELISA from BMDM media ± 6hrs of LPS (200ng/ml) followed by 30min ATP (2.5mM), normalized to total protein (n=6–7 mice per condition, unpaired t-test). (E-G) mRNA expression of IL-1β (E), IL-6 (F), and TNFα (G) from isolated PMs ± 6hrs LPS (300ng/ml) (n=3 mice per condition, one-way ANOVA and Tukey’s post-hoc test). (H) IL-1β ELISA from PM media ± 6hrs of LPS (300ng/ml) followed by 30min of ATP (2.5mM), normalized to total protein (n=7–10 mice per condition, unpaired t-test). (I-K) mRNA expression of IL-1β (I), IL-6 (J), and TNFα (K) from splenic tissue after i.p. injection of mice with LPS (15mg/kg) for 4hrs. (n=4 mice per condition, one-way ANOVA and Tukey’s post-hoc test). (L) Schematic of LPS-induced endotoxemia model. Mice were given i.p. injection of LPS (15mg/kg) and observed over 72hrs for survival. (M) Survival curve of mice in LPS-induced endotoxemia model (n=10 mice per condition, survival curve log-rank Mantel-Cox test).
Figure 4.
Figure 4.. Inhibition of PPP reverses hyper-inflammation induced by HK1 mitochondrial dissociation
(A) Schematic of oxidative and non-oxidative branch of PPP with 6AN blocking the oxidative branch and OT blocking the non-oxidative branch. (B-C) IL-1β ELISA from BMDM media after 4hrs of LPS (200ng/ml) ± 6AN (1mM) (B) or OT (50μM) (C) followed by 30min of ATP (2.5mM), normalized to total protein (n=3 mice per condition, two-way ANOVA and Tukey’s post-hoc test). (D-E) mRNA expression of IL-1β (D) and IL-6 (E) ± 4hr 6AN (1mM) or ± LPS (200ng/ml) (n=3 mice per condition, two-way ANOVA and Tukey’s post-hoc test). (F-G) mRNA expression of IL-1β (F) and IL-6 (G) ± 4hr OT (50μM) or ± LPS (200ng/ml) (n=3 mice per condition, two-way ANOVA and Tukey’s post-hoc test). (H-I) mRNA expression of IL-1β (H) and IL-6 (I) with ± 16hrs IFNϒ priming followed by ± 4hrs of LPS (200ng/ml) ± 6AN (1mM) and ± OT (50μM) (n=4 mice per condition, two-way ANOVA and Tukey’s post-hoc test). (J) NADPH/NADP+ ratio with ± 4hrs of LPS (200ng/ml) ± 6AN (1mM) and ± OT (50μM) (n=6 mice per condition, two-way ANOVA and Tukey’s post-hoc test).
Figure 5.
Figure 5.. GAPDH activity is attenuated in macrophages with HK1 mitochondrial detachment
(A) GAPDH activity normalized to total protein in PMs treated with ± LPS (300ng/ml) (n=5 mice per condition, two-way ANOVA and Tukey’s post-hoc test). (B-C) GAPDH activity normalized to total protein in BMDMs ± LPS (200ng/ml) (B) and ± CGP3466 (GAPDH inhibitor) for 4hrs (C) (n=8 mice per condition for panel B and n=4 mice per condition for panel C, two-way ANOVA and Tukey’s post-hoc test). (D) IL-1β mRNA expression in BMDMs ± LPS and ± CGP3466 for 4hrs (n=3 mice per condition, two-way ANOVA and Tukey’s post-hoc test). (E) Survival curve of mice in LPS-induced endotoxemia model with or treatment with X [concentration] of KA (n=8 mice per condition, survival curve log-rank (Mantel-Cox) test). (F-G) IF of HK1 and mitochondria (MT-Red) imaging in RAW264.7 cells ± clotrimazole (CLT) (20μM) (E) and mitochondrial to HK1 colocalization analysis (F) (n=10 cells per condition, unpaired t-test, scale bar = 15μm). (H-J) mRNA expression of IL-1β (G), IL-6 (H), and TNFα (I) in RAW264.7 cells ± CLT (20μM) (n=4 replicates per condition, two-way ANOVA and Tukey’s post-hoc test). (K) GAPDH activity normalized to total protein in RAW264.7 cells ± CLT (20μM) (n=4 replicates per condition, two-way ANOVA and Tukey’s post-hoc test).
Figure 6.
Figure 6.. Cytosolic HK1 mediates GAPDH nitrosylation through S100A8/9 binding.
(A) Western blot of HK1 co-IP from BMDMs treated with LPS (200ng/ml) for 3hrs and probing for S100A8 binding. LE = Low-exposure and HE = high-exposure. (B) HK1 co-IP western blot densitometry analysis of S100A8 divided by total HK1 eluted (n=5 mice per condition, unpaired t-test). (C-D) Western blot of GAPDH IP and TMT switch nitrosylation assay of LPS (200ng/ml) treated BMDMs ± 1400W (10mg/kg) (C) and Western blot densitometry of anti-TMT normalized to total GAPDH eluted (D) (n=3 mice per condition, one-way ANOVA and Tukey’s post-hoc test). (E) Schematic of in vivo LPS (15mg/kg) ± 1400W (10mg/kg) i.p. injection experiment. (F-H) Spleen tissue mRNA expression of IL-1β (F), IL-6 (G), and TNFα (H) from mice after i.p. injection of LPS ± 1400W (n=4 mice per condition, one-way ANOVA and Tukey’s post-hoc test). (I-K) mRNA expression of IL-1β (I), IL-6 (J), and TNFα (K) from isolated BMDMs ± 4hrs LPS (200ng/ml) ± 1400W (50μM) (n=4 mice per condition, one-way ANOVA and Tukey’s post-hoc test). (L) GAPDH activity normalized to total protein from BMDMs treated with LPS (200ng/ml) ± 1400W (50μM) (n=4 mice per condition, one-way ANOVA and Tukey’s post-hoc test). (M-N) ECAR trace of BMDMs treated for 5hrs of LPS (200ng/ml) (M) or 5hrs LPS ± 1400W (50μM) (N) (n=3–4 mice per condition, repeated measures two-way ANOVA and Tukey’s post-hoc test, mean ± SEM). (O) Survival curve of mice in LPS-induced endotoxemia model in the presence and absence of 1400W (n=10 mice per condition, survival curve log-rank (Mantel-Cox) test).
Figure 7.
Figure 7.. Diabetes is associated with HK1 mitochondrial dislocation and increased cytokine production
(A and B) Representative IF images probing for HK1 and mitochondria (using an antibody against ATP5B) in isolated PMs from NC and HFD mice (A) and colocalization analysis of IF images using Pearson’s correlation coefficient (B) (n=11–15 cells per condition, unpaired t-test). (C) GAPDH activity normalized to total protein in PMs isolated from NC and HFD treated with LPS (300ng/ml) ± 1400W (50μM) for 4hrs (n=4 mice per condition, two-way ANOVA and Tukey’s post-hoc test). (D) IL-1β ELISA from media of PMs treated with LPS (300ng/ml) for 6hrs and ATP (2.5mM) for 30min (n=4 mice per condition, one-way ANOVA and Tukey’s post-hoc test). (E-F) Representative IF images from normal control (Ctrl) and T2DM patients (E) and colocalization analysis of IF images (F) (n=7 images per condition, unpaired t-test). (G) GAPDH activity normalized to total protein in huPBMCs treated with LPS (200ng/ml) ± 1400W (50μM) for 4hrs (n=4 patients per condition, two-way ANOVA and Tukey’s post-hoc test). (H) IL-1β ELISA from media of huPBMCs treated with LPS (200ng/ml) for 6hrs and ATP (2.5mM) for 30min (n=3 patients per condition, one-way ANOVA and Tukey’s post-hoc test). (I-J) Representative IF images from WT and Sirt2−/− BMDMs treated with LPS (I) and colocalization analysis of IF images (J) (n=5 images per condition, two-way ANOVA and Tukey’s post-hoc test). (K) Sirt2, IL-1β and IL-6 mRNA expression in BMDMs from WT and Sirt2−/− mice ± LPS for 4hrs (n=3 mice per condition, two-way ANOVA and Tukey’s post-hoc test).

Comment in

References

    1. Adeva-Andany MM, Perez-Felpete N, Fernandez-Fernandez C, Donapetry-Garcia C, and Pazos-Garcia C (2016). Liver glucose metabolism in humans. Biosci. Rep. 36, e00416–e00416. - PMC - PubMed
    1. Aflalo C, and Azoulay H (1998). Binding of Rat Brain Hexokinase to Recombinant Yeast Mitochondria: Effect of Environmental Factors and the Source of Porin. J. Bioenerg. Biomembr. 30, 245–255. - PubMed
    1. Alonso-Castro AJ, and Salazar-Olivo LA (2008). The anti-diabetic properties of Guazuma ulmifolia Lam are mediated by the stimulation of glucose uptake in normal and diabetic adipocytes without inducing adipogenesis. J. Ethnopharmacol. 118, 252–256. - PubMed
    1. Andrejeva G, and Rathmell JC (2017). Similarities and Distinctions of Cancer and Immune Metabolism in Inflammation and Tumors. Cell Metab. 26, 49–70. - PMC - PubMed
    1. Azoulay-Zohar H, Israelson A, Abu-Hamad S, and Shoshan-Barmatz V (2004). In self-defence: hexokinase promotes voltage-dependent anion channel closure and prevents mitochondria-mediated apoptotic cell death. Biochem. J. 377, 347–355. - PMC - PubMed

Publication types