Observational Study
. 2022 Apr;21(4):329-341.
doi: 10.1016/S1474-4422(22)00027-8.

Soluble TREM2 in CSF and its association with other biomarkers and cognition in autosomal-dominant Alzheimer's disease: a longitudinal observational study

Collaborators, Affiliations
Observational Study

Soluble TREM2 in CSF and its association with other biomarkers and cognition in autosomal-dominant Alzheimer's disease: a longitudinal observational study

Estrella Morenas-Rodríguez et al. Lancet Neurol. 2022 Apr.

Erratum in

Abstract

Background: Therapeutic modulation of TREM2-dependent microglial function might provide an additional strategy to slow the progression of Alzheimer's disease. Although studies in animal models suggest that TREM2 is protective against Alzheimer's pathology, its effect on tau pathology and its potential beneficial role in people with Alzheimer's disease is still unclear. Our aim was to study associations between the dynamics of soluble TREM2, as a biomarker of TREM2 signalling, and amyloid β (Aβ) deposition, tau-related pathology, neuroimaging markers, and cognitive decline, during the progression of autosomal dominant Alzheimer's disease.

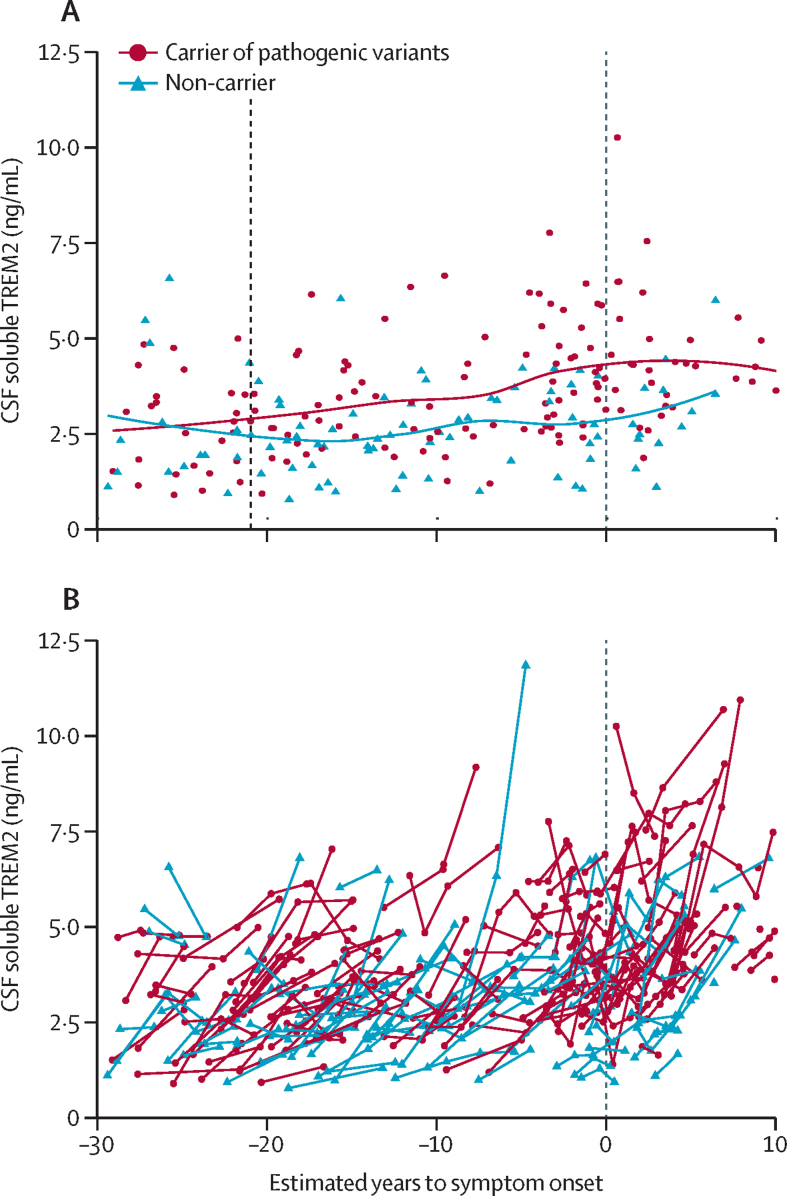
Methods: We did a longitudinal analysis of data from the Dominantly Inherited Alzheimer Network (DIAN) observational study, which includes families with a history of autosomal dominant Alzheimer's disease. Participants aged over 18 years who were enrolled in DIAN between Jan 1, 2009, and July 31, 2019, were categorised as either carriers of pathogenic variants in PSEN1, PSEN2, and APP genes (n=155) or non-carriers (n=93). We measured amounts of cleaved soluble TREM2 using a novel immunoassay in CSF samples obtained every 2 years from participants who were asymptomatic (Clinical Dementia Rating [CDR]=0) and annually for those who were symptomatic (CDR>0). CSF concentrations of Aβ40, Aβ42, total tau (t-tau), and tau phosphorylated on threonine 181 (p-tau) were measured by validated immunoassays. Predefined neuroimaging measurements were total cortical uptake of Pittsburgh compound B PET (PiB-PET), cortical thickness in the precuneus ascertained by MRI, and hippocampal volume determined by MRI. Cognition was measured using a validated cognitive composite (including DIAN word list test, logical memory delayed recall, digit symbol coding test [total score], and minimental status examination). We based our statistical analysis on univariate and bivariate linear mixed effects models.

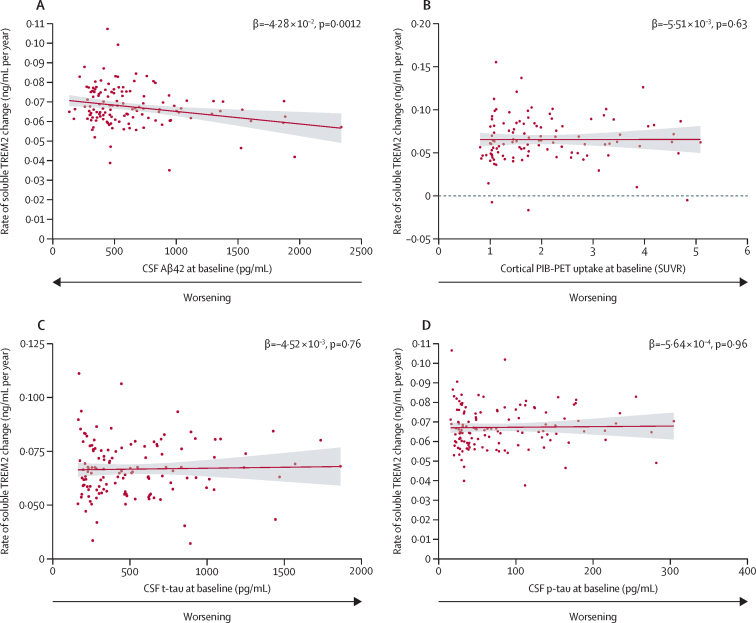
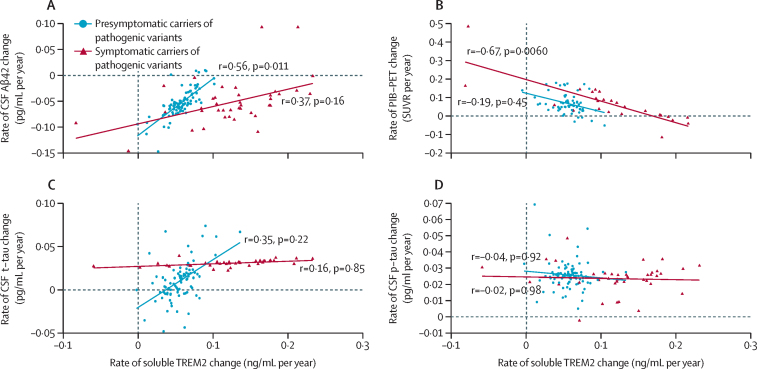
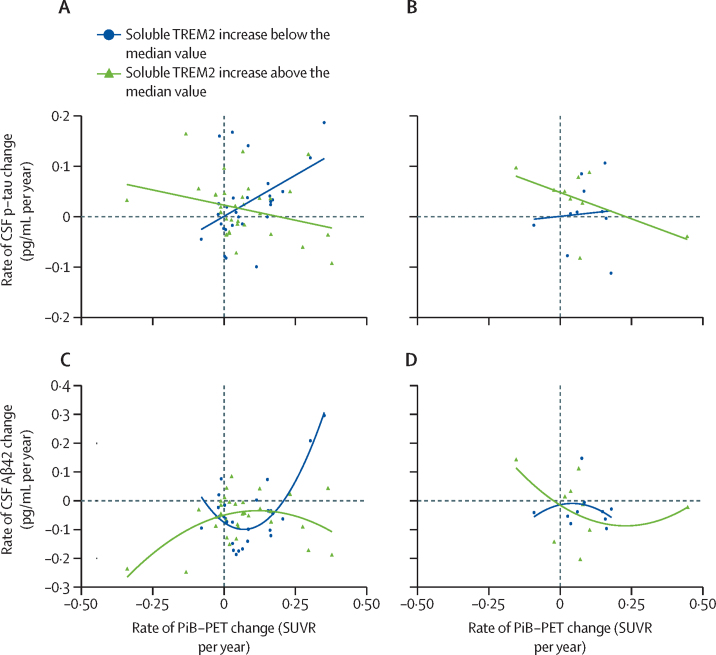
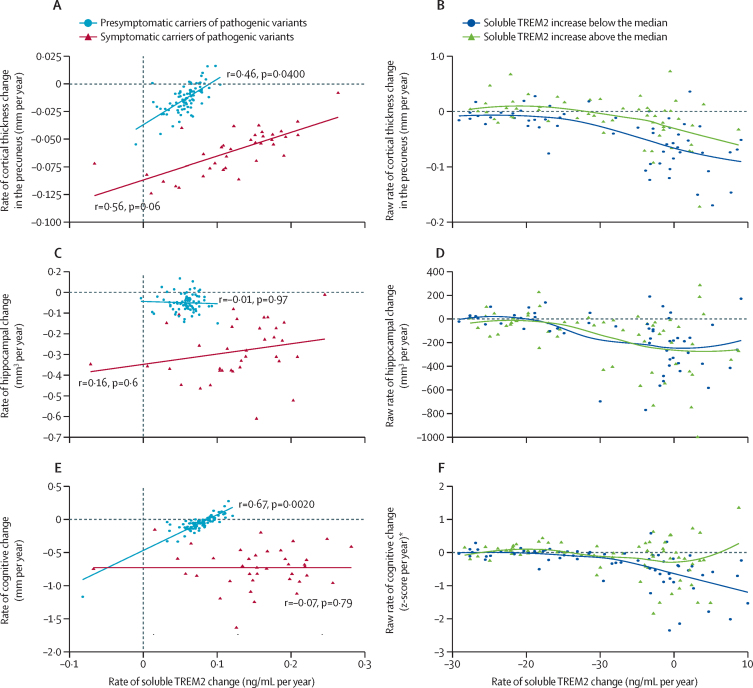
Findings: In carriers of pathogenic variants, a high amyloid burden at baseline, represented by low CSF Aβ42 (β=-4·28 × 10-2 [SE 0·013], p=0·0012), but not high cortical uptake in PiB-PET (β=-5·51 × 10-3 [0·011], p=0·63), was the only predictor of an augmented annual rate of subsequent increase in soluble TREM2. Augmented annual rates of increase in soluble TREM2 were associated with a diminished rate of decrease in amyloid deposition, as measured by Aβ42 in CSF (r=0·56 [0·22], p=0·011), in presymptomatic carriers of pathogenic variants, and with diminished annual rate of increase in PiB-PET (r=-0·67 [0·25], p=0·0060) in symptomatic carriers of pathogenic variants. Presymptomatic carriers of pathogenic variants with annual rates of increase in soluble TREM2 lower than the median showed a correlation between enhanced annual rates of increase in p-tau in CSF and augmented annual rates of increase in PiB-PET signal (r=0·45 [0·21], p=0·035), that was not observed in those with rates of increase in soluble TREM2 higher than the median. Furthermore, presymptomatic carriers of pathogenic variants with rates of increase in soluble TREM2 above or below the median had opposite associations between Aβ42 in CSF and PiB-PET uptake when assessed longitudinally. Augmented annual rates of increase in soluble TREM2 in presymptomatic carriers of pathogenic variants correlated with decreased cortical shrinkage in the precuneus (r=0·46 [0·22]), p=0·040) and diminished cognitive decline (r=0·67 [0·22], p=0·0020).

Interpretation: Our findings in autosomal dominant Alzheimer's disease position the TREM2 response within the amyloid cascade immediately after the first pathological changes in Aβ aggregation and further support the role of TREM2 on Aβ plaque deposition and compaction. Furthermore, these findings underpin a beneficial effect of TREM2 on Aβ deposition, Aβ-dependent tau pathology, cortical shrinkage, and cognitive decline. Soluble TREM2 could, therefore, be a key marker for clinical trial design and interpretation. Efforts to develop TREM2-boosting therapies are ongoing.

Funding: German Research Foundation, US National Institutes of Health.


Conflict of interest statement

Declaration of interests HZ has served at scientific advisory boards for Alector, Eisai, Denali, Roche Diagnostics, Wave, Samumed, Siemens Healthineers, Pinteon Therapeutics, Nervgen, AZTherapies, and CogRx, and has given lectures in symposia sponsored by Cellectricon, Fujirebio, Alzecure, and Biogen. MS-C has served as a consultant and at advisory boards for Roche Diagnostics International and has given lectures in symposia sponsored by Roche Diagnostics, Sociedad Limitada Unipersonal, and Roche Farma, Sociedad Anónima. AMF participates in the scientific advisory boards for Roche Diagnostics, Genentech, and DiamiR, and collaborates as a consultant for DiamiR and Siemens Healthcare Diagnostics. TLSB collaborates with Biogen and Siemens as a consultant and participates in the Advisory board of Eisai and Biogen. JH collaborates as a consultant for Roche and Parabon Nanolabs, and participates in the Advisory board of Eisai, CaringBridge, and WallE. EM collaborates as a consultant for Eli Lilly, has received funding for attending meetings from the Alzheimer Association and Foundation Alzheimer, and participates in the Data Safety Monitoring Board of Eli Lilly, Alector, and in the Advisory Board of Fondation Alzheimer, and Alzmend. KS received royalties for co-developing the therapeutic anti-TREM2 mouse antibody 4D9. JCM has served as consultant for Barcelona Beta Brain Research Center, TS Srinivasan Advisory Board (Chennai, India), has received honoraria for lectures given at Montefiori Grand Rounds (NY, USA) and Tetra-Institute Alzheimer Disease Research Center Seminar Series, and participates in the Advisory Boards of Cure Alzheimer's Fund Research Strategy Council and Leads Advisory Board (IN, USA). KB collaborates as a consultant for Abcam, Axon, BioArctic, Biogen, Japanese Organization for Medical Device Development and Shimadzu, Lilly, MagQu, Pharmatrophix, Prothena, Roche Diagnostics, and Siemens Healthineers, has received honoraria for lectures from Grupo de Estudos de Envelhecimento Cerebral e Demência and Roche Diagnostics, and IFCC and SNIBE, has served at data monitoring committees for Julius Clinical and Novartis, and is a co-founder of Brain Biomarker Solutions in Gothenburg AB, which is a part of Gothenburg University Ventures Incubator programme. JL participates as a consultant in Axon Neuroscience and Biogen, has received honoraria for lectures given by Bayer Vital and Roche, support for attending meetings by AbbVie and Biogen, and has participated in the Advisory board of Axon Neuroscience. JL has also received author fees from Thieme medical publishers, W Kohlhammer GmbH medical publishers, and a compensation for duty as part-time chief marketing officer by MODAG GmbH. RJB collaborates as a consultant with Eisai, Amgen, and Hoffman La-Roche, has received travel support from Hoffman La-Roche, and participates in the C2N Diagnostics Scientific Advisory board. RJB also serves as principal investigator of the Dominantly Inherited Alzheimer's Network-Treatment Unit (DIAN-TU), which is supported by the Alzheimer's Association, GHR Foundation, an anonymous organisation, and the DIAN-TU Pharma Consortium (active members include Eli Lilly and Company, Avid Radiopharmaceuticals, F Hoffman-La Roche, Genentech, Biogen, Eisai, and Janssen. Previous members include Abbvie, Amgen, AstraZeneca, Forum, Mithridion, Novartis, Pfizer, Sanofi, and United Neuroscience). In addition, in-kind support has been received from CogState and Signant Health. CH collaborates with Denali Therapeutics, and has participated on one advisory board meeting of Biogen. CH is also chief advisor of ISAR Bioscience and a member of the scientific advisory board of AviadoBio. CH has received honoraria for lectures at Weill Cornell Medicine, Sheikh Hamdan Webinar Series, Washington University, Eisai, and UT Southwestern Medical Center, and participates in the US Patent Application (number 16/319,373).

Figures

Figure 1
Figure 1
Cross-sectional and longitudinal soluble TREM2 levels in CSF according to estimated years to symptom onset (EYO) in carriers and non-carriers of pathogenic variants (A) Soluble TREM2 baseline levels plotted against EYO at baseline for carriers of pathogenic variants (shown in red, n=148) and non-carriers (shown in blue, n=91). The dotted line at –21 years indicates the timepoint at which cross-sectional soluble TREM2 levels start to be statistically higher in carriers of pathogenic variants than in non-carriers, according to the method described by McDade and colleagues. The dotted line at 0 years represents the expected point of symptom onset. Lines represent locally weighted scatterplot smoothing (LOESS) best-fitting curves (B) Spaghetti plot showing the longitudinal levels of soluble TREM2 in CSF from carriers of pathogenic variants (depicted by the red line, n=148) and non-carriers (depicted by the blue line, n=91) as a function of EYO. The dotted line at 0 years represents the expected point of symptom onset. Negative EYO values represent the expected presymptomatic phase. Positive values indicate the expected symptomatic phase of the disease. Because of the low number of participants located at the extremes of the graph, and to maintain their confidentiality, individual participants are not shown in the timeframe before –30 years and after 10 years.
Figure 2
Figure 2
Baseline Aβ42, p-tau, t-tau in CSF, and PiB-PET and rate of change in soluble TREM2 in CSF in carriers of pathogenic variants Each panel represents the estimated individual slopes extracted from the respective separate univariate linear mixed effects (LME) models, which assessed the association between the baseline predictor biomarker (Aβ42 in CSF [A], PiB-PET cortical uptake [B], t-tau in CSF [C], and p-tau in CSF [D]), and the subsequent longitudinal change in soluble TREM2 in CSF. β values and p values indicate the effect and statistical significance of the interaction term time from baseline × predictor-baseline-biomarker in each separate univariate LME model. The interaction term represents the effect of the baseline biomarker on the longitudinal change in soluble TREM2 in CSF. The separate univariate LME model is explained further in the appendix (p 13). Each univariate LME model consisted of longitudinal CSF soluble TREM2 as the dependent variable (ie, the outcome), time from-baseline, estimated years to symptom onset (EYO) at baseline, predictor biomarker at baseline and interactions Time × EYO at baseline and Time × Predictor at baseline as fixed factors and individual slope, intercept, and family cluster as random factors. Continuous red lines represent the association between the individual slopes, which were estimated from the univariate LME models and the baseline biomarker. Bands represent 95% CI. (A) Low baseline amounts of Aβ42 in CSF were associated with a subsequent augmented rate of change in soluble TREM2, according to the respective LME model. For total cortical PiB-PET uptake at baseline (B), baseline t-tau in CSF (C), and baseline p-tau in CSF (D), we did not find any significant effect on the subsequent rate of soluble TREM2 change estimated by the LME models (appendix p 13). PiB-PET=Pittsburgh compound B PET. p-tau=phosphorylated tau on threonine 181. SUVR=standardised uptake value ratio. t-tau=total tau.
Figure 3
Figure 3
Association in carriers of pathogenic variants between rate of increase in soluble TREM2 and rates of change of biomarkers related to amyloid deposition and tau-related pathology (A) Augmented rates of increase in soluble TREM2 correlated with a diminished rate of decrease in Aβ42 in CSF, in presymptomatic carriers of pathogenic variants (shown in blue, n=100). No significant correlation was found in symptomatic carriers of pathogenic variants (shown in dark red, n=48). (B) A significant association between an augmented rate of increase in soluble TREM2 and a reduced rate of increase in cortical PiB-PET uptake was observed in symptomatic carriers of pathogenic variants (shown in dark red, n=48). When studying all carriers of pathogenic variants together, we also observed a significant association (r=–0·46, p=0·0068). (C) No evidence for an association between augmented rates of increase in soluble TREM2 and t-tau was observed on studying all carriers of pathogenic variants together (r=0·34, p=0·0800). (D) No significant association between the rate of change in soluble TREM2 and the rate of change in p-tau in carriers of pathogenic variants was observed (neither in presymptomatic or symptomatic carriers of pathogenic variants, nor in the entire pathogenic variant group). Presymptomatic carriers of pathogenic variants were defined by a CDR at baseline of 0, and symptomatic carriers of pathogenic variants were defined by a CDR at baseline greater than 0. Datapoints on the plots represent individual annual rates of change for each variable, which were estimated from their corresponding bivariate LME model. The correlations (r) between each pair of rates of change, and corresponding p values, were estimated from the covariance matrix of each separate bivariate LME model. The continuous lines in each panel represent the linear association between the annual rate of change of soluble TREM2 and another outcome. CDR=Clinical Dementia Rating. LME=linear mixed effects. PiB-PET=Pittsburgh compound B PET. p-tau=phosphorylated tau on threonine 181. SUVR=standardised uptake value ratio. t-tau=total tau.
Figure 4
Figure 4
Modification effect of rate of increase in soluble TREM2 on associations between longitudinal changes in PiB-PET cortical uptake, Aβ42 in CSF, and p-tau in CSF (A) In presymptomatic carriers of pathogenic variants, the association between raw rates of change in PiB-PET uptake and p-tau in CSF was modified by the raw rate of change in soluble TREM2 (β=–0·394 [0·137], p=0·0056, for the linear interaction of rate of increase in soluble TREM2 higher than the median × annual rate of increase in PiB-PET), with opposite associations in the subgroup with a low rate of increase in soluble TREM2 (below the median [shown in blue], n=50) and the subgroup with a high rate (above the median [shown in green], n=48). (B) This interaction effect was not significant in symptomatic carriers of pathogenic variants (β=–0·271 [0·288], p=0·36). (C) Presymptomatic carriers of pathogenic variants with a high raw rate of change in soluble TREM2 (above the median [shown in green], n=50) and those with a low raw rate of change in soluble TREM2 (shown in blue, n=48) showed opposite associations between longitudinal changes in Aβ42 in CSF and PiB-PET uptake (β=0·974 [SE 0·318], p=0·0033 for the linear interaction term of increase in soluble TREM2 higher than the median × annual rate of increase in PiB-PET, and β=–6·24 [1·135], p<0·0001 for the quadratic interaction term of increase in soluble TREM2 higher than the median × annual rate of increase in PiB-PET^2). (D) This interaction effect was not significant in symptomatic carriers of pathogenic variants (β=–2·11 [3·95], p=0·61 for the linear interaction term rate of increase in soluble TREM2 higher than the median × annual rate of increase in PiB-PET, and β=–0·63 [0·54], p=0·27 for the quadratic interaction term of increase in soluble TREM2 higher than the median × annual rate of increase in PiB-PET^2). Datapoints on the plots represent the raw rates of change of each biomarker, which were calculated as the individual slope per participant in a linear regression (ie, biomarker of study by time). β values in each panel are the β coefficient for the linear and quadratic interaction terms in each linear or quadratic regression model. The exact regression models carried out are summarised in the appendix (p 14). The SE is expressed in parentheses. The continuous lines in each panel are linear or quadratic estimates of the represented data. PiB-PET=Pittsburgh compound B PET. p-tau=phosphorylated tau on threonine 181.
Figure 5
Figure 5
Associations between rate of increase in soluble TREM2, cortical shrinkage in the precuneus, hippocampal shrinkage, and cognitive decline in presymptomatic and symptomatic carriers of pathogenic variants (A) A significant association was seen between an augmented rate of increase in soluble TREM2 and decreased cortical shrinkage in the precuneus, in presymptomatic carriers of pathogenic variants (shown in blue, n=100), and weak evidence was noted for a similar potential association in symptomatic carriers of pathogenic variants (shown in dark red, n=48). (B) The raw rate of cortical shrinkage in the precuneus is shown (for illustrative purposes only) according to EYO in carriers of pathogenic variants. Carriers of pathogenic variants were divided into two groups according to their raw rate of change in soluble TREM2 (above the median [shown in green], and below the median [shown in blue]). (C) There was no significant association between the rate of increase in soluble TREM2 and the hippocampal shrinkage rate in presymptomatic or symptomatic carriers of pathogenic variants. (D) The raw rate of hippocampal shrinkage according to EYO in carriers of pathogenic variants is shown (for illustrative purposes only), divided into two groups according to raw rate of change in soluble TREM2 (above the median [shown in green], and below the median [shown in blue]). (E) A strong correlation between higher soluble TREM2 increase rates and slower cognitive decline was observed in presymptomatic carriers of pathogenic variants (shown in blue, n=100), but not in the symptomatic carriers of pathogenic variants (shown in dark red, n=48). (F) The raw rate of cognitive decline according to EYO in carriers of pathogenic variants is shown (for illustrative purposes only), divided into two groups according to their raw rate of soluble TREM2 (above the median [shown in green], and below the median [shown in blue]). The raw rates of change were calculated as the individual slope per participant in a linear regression (ie, biomarker or cognitive composite by time). The correlations (r) between each pair of rates of change in panels A, C, and E, and the correspondent p values, were estimated from the covariance matrix of each separate bivariate LME model. The rates of change represented in panels A, C, and E were extracted from the correspondent bivariate LME model. The continuous lines in each panel are linear estimates of the represented data. The dashed lines in panels B, D, and F indicate that the change was equal to zero, indicating stability. CDR=Clinical Dementia Rating. EYO=estimated years to symptom onset. LME=linear mixed effects. *The cognitive change was calculated on the basis of the cognitive composite already described.

Comment in

References

    1. Heneka MT, Kummer MP, Stutz A, et al. NLRP3 is activated in Alzheimer's disease and contributes to pathology in APP/PS1 mice. Nature. 2013;493:674–678. - PMC - PubMed
    1. Keren-Shaul H, Spinrad A, Weiner A, et al. A unique microglia type associated with restricting development of Alzheimer's disease. Cell. 2017;169:1276–1290.e17. - PubMed
    1. Guerreiro R, Wojtas A, Bras J, et al. TREM2 variants in Alzheimer's disease. N Engl J Med. 2013;368:117–127. - PMC - PubMed
    1. Kleinberger G, Yamanishi Y, Suárez-Calvet M, et al. TREM2 mutations implicated in neurodegeneration impair cell surface transport and phagocytosis. Sci Transl Med. 2014;6 - PubMed
    1. Mazaheri F, Snaidero N, Kleinberger G, et al. TREM2 deficiency impairs chemotaxis and microglial responses to neuronal injury. EMBO Rep. 2017;18:1186–1198. - PMC - PubMed

Publication types