. 2022 Mar 19;10(1):37.
doi: 10.1186/s40478-022-01329-4.

Cerebellar morphometric and spectroscopic biomarkers for Machado-Joseph Disease

Affiliations

Cerebellar morphometric and spectroscopic biomarkers for Machado-Joseph Disease

Catarina Oliveira Miranda et al. Acta Neuropathol Commun. .

Abstract

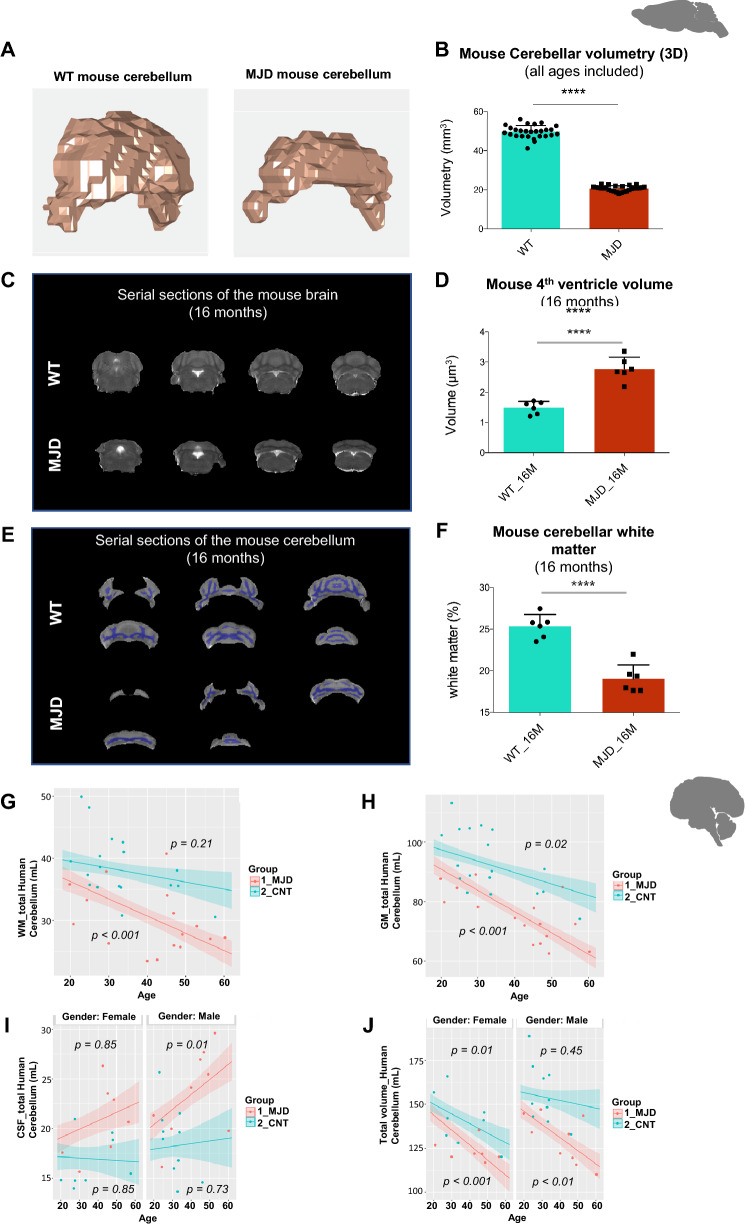
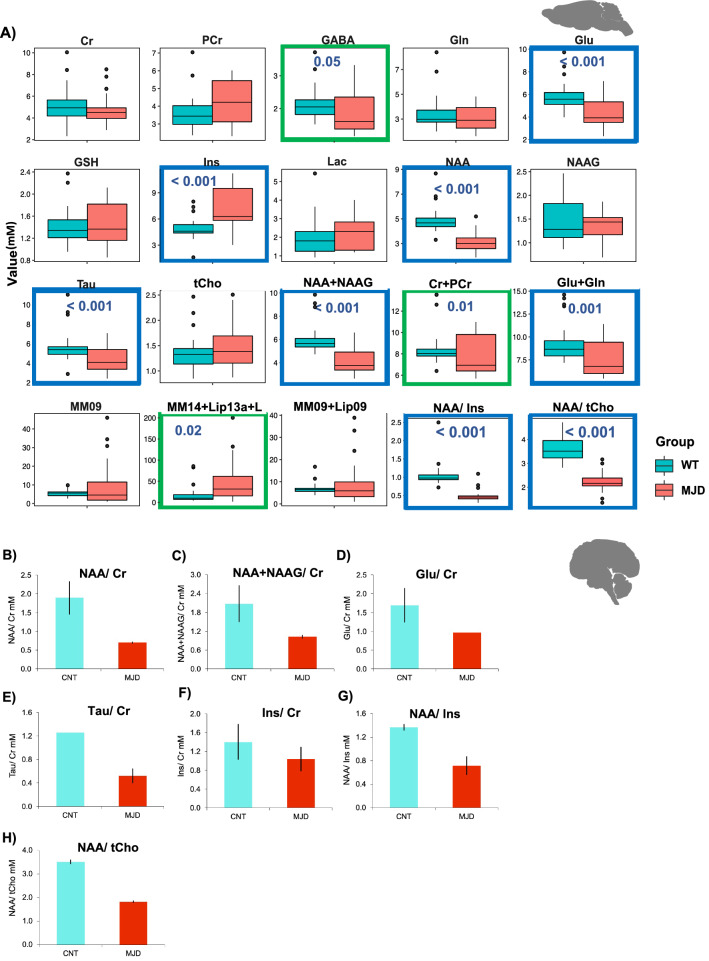
Machado-Joseph disease (MJD) or Spinocerebellar ataxia type 3 (SCA3) is the most common form of dominant SCA worldwide. Magnetic Resonance Imaging (MRI) and Proton Magnetic Resonance Spectroscopy (1H-MRS) provide promising non-invasive diagnostic and follow-up tools, also serving to evaluate therapies efficacy. However, pre-clinical studies showing relationship between MRI-MRS based biomarkers and functional performance are missing, which hampers an efficient clinical translation of therapeutics. This study assessed motor behaviour, neurochemical profiles, and morphometry of the cerebellum of MJD transgenic mice and patients aiming at establishing magnetic-resonance-based biomarkers. 1H-MRS and structural MRI measurements of MJD transgenic mice were performed with a 9.4 Tesla scanner, correlated with motor performance on rotarod and compared with data collected from human patients. We found decreased cerebellar white and grey matter and enlargement of the fourth ventricle in both MJD mice and human patients as compared to controls. N-acetylaspartate (NAA), NAA + N-acetylaspartylglutamate (NAA + NAAG), Glutamate, and Taurine, were significantly decreased in MJD mouse cerebellum regardless of age, whereas myo-Inositol (Ins) was increased at early time-points. Lower neurochemical ratios levels (NAA/Ins and NAA/total Choline), previously correlated with worse clinical status in SCAs, were also observed in MJD mice cerebella. NAA, NAA + NAAG, Glutamate, and Taurine were also positively correlated with MJD mice motor performance. Importantly, these 1H-MRS results were largely analogous to those found for MJD in human studies and in our pilot data in human patients. We have established a magnetic resonance-based biomarker approach to monitor novel therapies in preclinical studies and human clinical trials.

Keywords: Machado-Joseph disease (MJD); Magnetic resonance imaging (MRI); Motor performance; Proton magnetic resonance spectroscopy (1H-MRS) biomarkers; Spinocerebellar ataxia type 3 (SCA3).


Conflict of interest statement

The authors have declared that no conflict of interest exists.

Figures

Fig. 1
Fig. 1
Cerebellar structural/anatomical alterations in MJD mice and patients. a Representative 3D images of the cerebellum of wild type (WT) and Tg-ATXN3-69Q (MJD) mice. b Cerebellar volumetry of WT (n = 27) and MJD (n = 27) mice (all ages included), obtained through the analyses of cerebellar images pre-processed and segmented in Matlab R2012b. c Illustrative serial sections of the brain of a WT (up) and an MJD (bottom) mouse with 16 months, showing the space occupied by the 4th ventricle (white structure). d Fourth ventricle volume of WT (n = 6) and MJD mice (n = 6) at 16 months obtained through the analyses of cerebellar images pre-processed and segmented in Matlab R2012b. e Illustrative serial images of the cerebellum of a WT (up) and an MJD (bottom) mouse at 16 months, showing cerebellar white matter (purple structure). f Cerebellar white matter in WT (n = 6) and MJD mice (n = 6) was obtained through the analysis of cerebellar images pre-processed and segmented in Matlab R2012b. Multiple regressions to test the effect of group (MJD patients, n = 16 vs. CNT (healthy individuals), n = 18) in WM (g), GM (h), CSF (i) and the sum of those volumes (mL) (j) in the whole cerebellum. The covariates age and gender were only kept in the models when they had a significant effect in explaining data variability. From a–f: unpaired t test with Welch’s correction was used to test for differences among groups. Multiple regressions were performed from g–j. ** p < 0.01; ****p < 0.0001. Abbreviations: WM—white matter; GM—grey matter; CSF—cerebrospinal fluid; CNT—controls; MJD—Machado-Joseph disease patients. Image created by me or a co-author
Fig. 2
Fig. 2
Cerebellar Proton Magnetic Resonance Spectroscopy assessed in MJD mice and patients. a Representative images of the cerebellum of wild type (WT) and Tg-ATXN3-69Q (MJD) mice showing voxel localization. b Proton magnetic resonance spectroscopy (1H-MRS) average plots of WT and MJD mice (all ages included). c Representative images of the human brain showing voxel localization. d Proton magnetic resonance spectroscopy (1H-MRS) average plots of MJD patients and controls. e Principal Component Analysis (PCA) of the neurometabolites analysed by 1H-MRS in WT and MJD mice. PC1 and PC2 explained 51.8 and 15.3% of the variance in the data, respectively. Abbreviations: Cr—Creatinine; PCr—Phosphocreatinine; Glu—Glutamate; Gln—Glutamine; Ins—Myo-inositol; Tau—Taurine; Cho—Choline; PCh—Phosphocoline; GPC—Glycerophosphocholine; GSH—Glutathione; NAA—N-acetylaspartate; NAAG—N-acetylaspartylglutamate; GABA—Gamma-Amino Butyric Acid; Lac—lactate; MM—Macromolecules; Lip—Lipids. Image created by me or a co-author
Fig. 3
Fig. 3
Neurochemical alterations in MJD mice and patients. a Boxplots (median, 25–75% inter-quartile range, non-outlier range, and outliers) illustrating concentration of neurometabolites in the cerebellum of WT and MJD mice (all ages included). b–h Graphic representation of the concentration (mM) of the principal cerebellar neurometabolies in MJD patients (n = 2) and gender and age-matched controls (CNT, n = 2): NAA (b), NAA + NAAG (c), Glu (d), Tau (e) and Ins (f), normalized with Cr; as well as the ratios NAA/Ins (g) and NAA/Total Cho (h). In (a), Bonferroni corrected t-tests were used to test for differences among groups (WT, n = 28; MJD, n = 28). *p < 0.05, **p < 0.01, and ***p < 0.001. Abbreviations: Cr—Creatinine; PCr—Phosphocreatinine; Glu—Glutamate; Gln—Glutamine; Ins—Myo-inositol; Tau—Taurine; tCho—total Choline (Phosphocoline + Glycerophosphocholine); GSH—Glutathione; NAA—N-acetylaspartate; NAAG—N-acetylaspartylglutamate; GABA—Gamma-Amino Butyric Acid; Lac—lactate; MM—Macromolecules; Lip—Lipids. Image created by me or a co-author
Fig. 4
Fig. 4
Relationship between the cerebellar concentration of key metabolites and accelerated rotarod performance on Tg-ATXN3-69Q (MJD) Mice. Linear regression between the cerebellar concentration (mM) of NAA, NAA + NAAG, Glu, Tau and Ins normalized with Cr, as well as NAA/tCho ratio, and the performance of MJD mice of 2 and 4 months of age (n = 22) in accelerated rotarod (sec). *p < 0.05 and ***p < 0.001. Abbreviations: NAA—N-acetylaspartate; NAAG—N-acetylaspartylglutamate; Cr—Creatinine; Glu—Glutamate; Tau—Taurine; Ins—Myo-inositol; tCho—Total Choline. Image created by me or a co-author

References

    1. Kawaguchi Y, Okamoto T, Taniwaki M, Aizawa M, Inoue M, Katayama S, et al. CAG expansions in a novel gene for Machado-Joseph disease at chromosome 14q32.1. Nat Genet. 1994;8:221–228. - PubMed
    1. Paulson HL, Perez MK, Trottier Y, Trojanowski JQ, Subramony SH, Das SS, et al. Intranuclear inclusions of expanded polyglutamine protein in spinocerebellar ataxia type 3. Neuron. 1997;19:333–344. - PubMed
    1. Koeppen AH. Polyglutamine disorders. Adv Exp Med Biol. 2018;1049:233–241. - PubMed
    1. Murata Y, Yamaguchi S, Kawakami H, Imon Y, Maruyama H, Sakai T, et al. Characteristic magnetic resonance imaging findings in Machado-Joseph disease. Arch Neurol-chicago. 1998;55:33–37. - PubMed
    1. Schulz JB, Borkert J, Wolf S, Schmitz-Hübsch T, Rakowicz M, Mariotti C, et al. Visualization, quantification and correlation of brain atrophy with clinical symptoms in spinocerebellar ataxia types 1, 3 and 6. Neuroimage. 2010;49:158–168. - PubMed

Publication types

LinkOut - more resources