. 2022 May;33(5):500-510.
doi: 10.1016/j.annonc.2022.02.007. Epub 2022 Mar 17.

Residual ctDNA after treatment predicts early relapse in patients with early-stage non-small cell lung cancer

Affiliations

Residual ctDNA after treatment predicts early relapse in patients with early-stage non-small cell lung cancer

D Gale et al. Ann Oncol. 2022 May.

Abstract

Background: Identification of residual disease in patients with localized non-small cell lung cancer (NSCLC) following treatment with curative intent holds promise to identify patients at risk of relapse. New methods can detect circulating tumour DNA (ctDNA) in plasma to fractional concentrations as low as a few parts per million, and clinical evidence is required to inform their use.

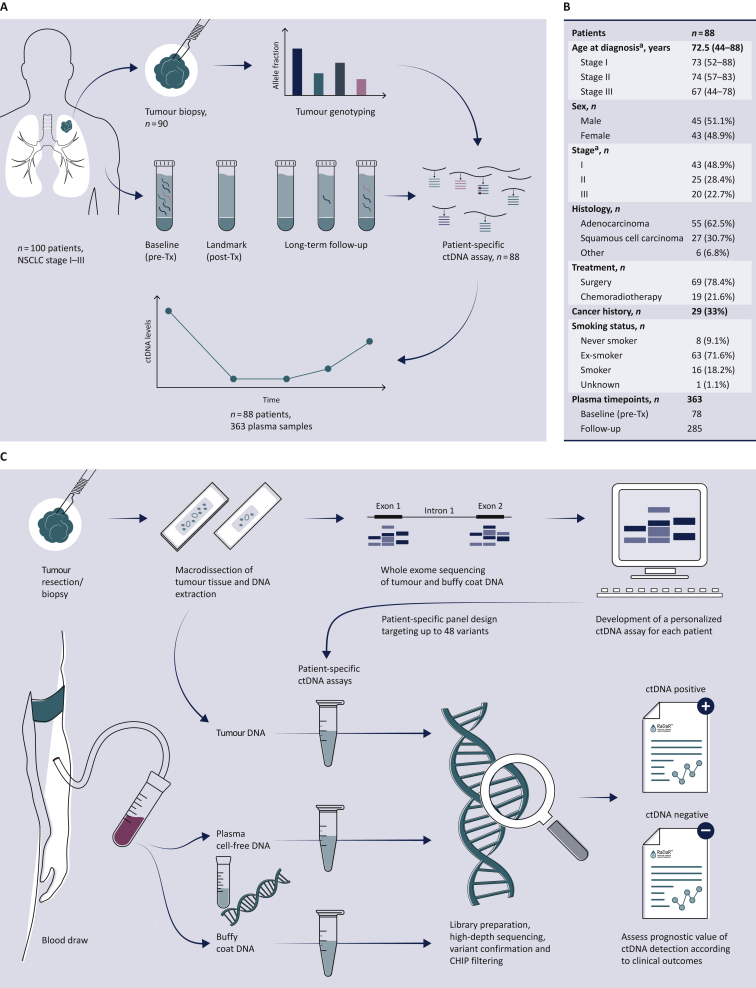
Patients and methods: We analyzed 363 serial plasma samples from 88 patients with early-stage NSCLC (48.9%/28.4%/22.7% at stage I/II/III), predominantly adenocarcinomas (62.5%), treated with curative intent by surgery (n = 61), surgery and adjuvant chemotherapy/radiotherapy (n = 8), or chemoradiotherapy (n = 19). Tumour exome sequencing identified somatic mutations and plasma was analyzed using patient-specific RaDaR™ assays with up to 48 amplicons targeting tumour-specific variants unique to each patient.

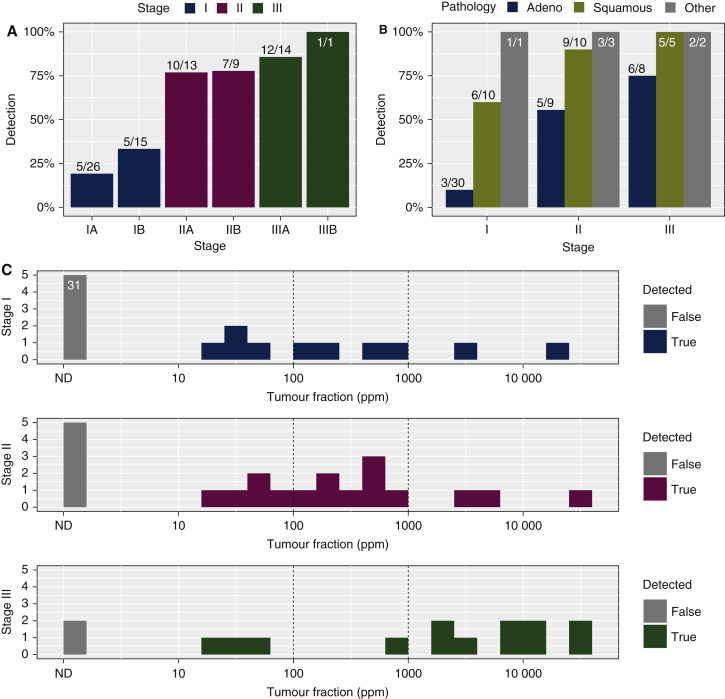
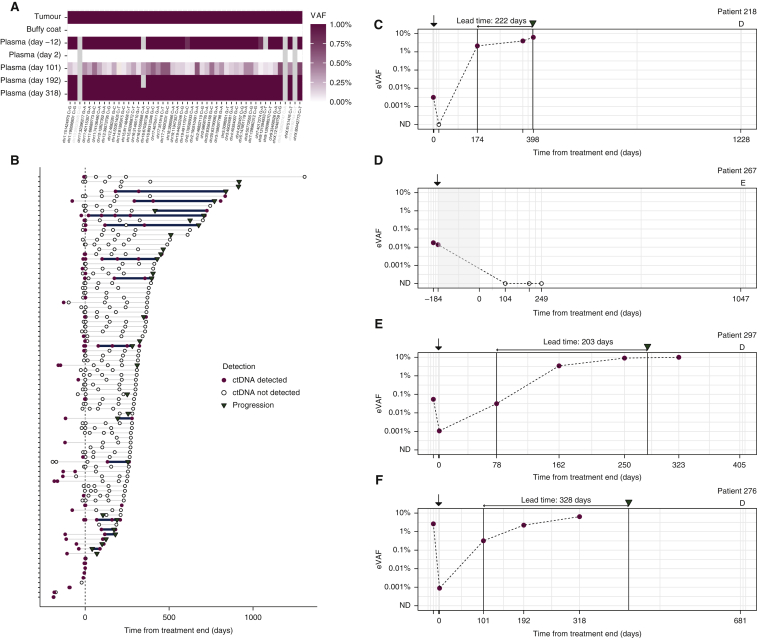
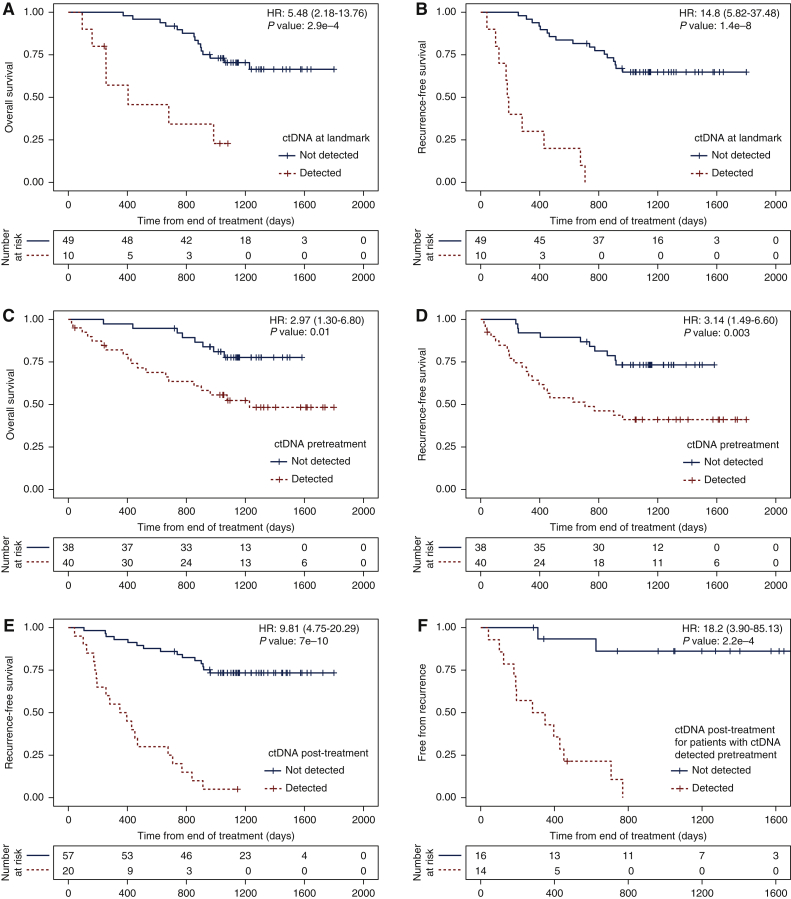
Results: ctDNA was detected before treatment in 24%, 77% and 87% of patients with stage I, II and III disease, respectively, and in 26% of all longitudinal samples. The median tumour fraction detected was 0.042%, with 63% of samples <0.1% and 36% of samples <0.01%. ctDNA detection had clinical specificity >98.5% and preceded clinical detection of recurrence of the primary tumour by a median of 212.5 days. ctDNA was detected after treatment in 18/28 (64.3%) of patients who had clinical recurrence of their primary tumour. Detection within the landmark timepoint 2 weeks to 4 months after treatment end occurred in 17% of patients, and was associated with shorter recurrence-free survival [hazard ratio (HR): 14.8, P <0.00001] and overall survival (HR: 5.48, P <0.0003). ctDNA was detected 1-3 days after surgery in 25% of patients yet was not associated with disease recurrence. Detection before treatment was associated with shorter overall survival and recurrence-free survival (HR: 2.97 and 3.14, P values 0.01 and 0.003, respectively).

Conclusions: ctDNA detection after initial treatment of patients with early-stage NSCLC using sensitive patient-specific assays has potential to identify patients who may benefit from further therapeutic intervention.

Keywords: cell-free DNA (cfDNA); circulating tumour DNA (ctDNA); early detection; liquid biopsy; minimal residual disease (MRD); non-small cell lung cancer (NSCLC).


Conflict of interest statement

Disclosure NR and DGa are co-founders, and NR, DGa, MP, KHo, SH, GM, CGS and GS are current or former employees/officers/consultants of Inivata Ltd. Inivata provided analysis of samples using the RaDaR™ assays. DGa and KHe are current employees of AstraZeneca Inc. All other authors have declared no conflicts of interest.

Figures

Figure 1
Figure 1
Study overview. (A) Study design: 100 patients with NSCLC stage I-III were recruited to the LUCID study. For 90 patients, tumour specimens were available and were analyzed by whole exome sequencing (WES), to identify somatic single nucleotide variants for design of patient-specific assays. Assays were successfully developed (panel B) for 88 patients. A total of 363 plasma samples collected from these patients at multiple timepoints before and after treatment were analyzed using those personalized assays to detect ctDNA and estimate its fractional concentration. The prognostic value of ctDNA detection was assessed by comparing ctDNA data with clinical outcomes to evaluate the relapse-free survival and overall survival for patient subgroups. A CONSORT flow diagram is provided in Supplementary Figure S1, available at https://doi.org/10.1016/j.annonc.2022.02.007. (B) Patient demographics of the 88 patients enrolled in the LUCID study who had available tumour tissue for sequencing and a patient-specific ctDNA assay successfully designed. ca., carcinoma; ctDNA, circulating tumour DNA; NSCLC, non-small cell lung cancer; Tx, treatment. aCancer stage was defined at the time of diagnosis according to diagnostic pathways, and was updated after surgery based on pathological analysis of the tumour specimen for patients who underwent surgery. (C) Overview of the workflow involved in the development of the RaDaR™ sequencing assays used in this study. Personalized sequencing assays were designed based on WES data from tumour and buffy coat samples, targeting 48 somatic variants for each assay. These were used to amplify regions in plasma cell-free DNA, tumour DNA and buffy coat DNA using multiplex PCR and high-depth next generation sequencing. Data from tumour DNA and buffy coat samples were used to confirm the detection of somatic variants and to exclude variants which may derive from clonal hematopoiesis of indeterminate potential (CHIP). Plasma samples were classified as ctDNA positive (detected) or ctDNA negative (not detected) based on the RaDaR™ assay sequencing data and analytical pipeline, and the estimated variant allele fraction (eVAF) was calculated.
Figure 2
Figure 2
ctDNA detection before treatment. Histograms showing detection rates of ctDNA before treatment of 78 patients where plasma samples were available pretreatment, (A) according to disease stage and (B) according to disease stage and histological subtype. Detection rates are shown in percentages, and the numbers of samples in each group are indicated above the bars (detected/total). (C) ctDNA levels, shown as estimated variant allele fraction (eVAF) in parts per million (ppm) of tumour DNA to total DNA, in plasma samples collected before treatment from patients with non-small cell lung cancer at stage I (top), II (middle) and III (bottom). Samples with ctDNA not detected are shown in grey bars, including 31 samples from patients with stage I in which ctDNA was not detected before treatment. Vertical dotted lines indicate eVAF of 0.01% (100 ppm) and 0.1% (1000 ppm). ctDNA, circulating tumour DNA; ND, not detected.
Figure 3
Figure 3
Longitudinal monitoring of ctDNA levels in plasma. (A) Example heat map showing the results of analysis of 48 variants in tumour DNA, buffy coat DNA and cell-free DNA from multiple plasma samples from patient 276 using a patient-specific RaDaR™ assay, using a color-coded scale of variant allele fractions (VAFs) ranging from 0% to ≥1%. Each row represents a different sample type or plasma timepoint (indicating days from end of treatment), and each column represents a single variant. Variants shaded in grey were excluded from analysis due to low read depth. (B) Summary of all 363 serial plasma samples from 88 patients indicating when ctDNA was detected (red dots) or not detected (black circles). Clinical recurrence is indicated with an inverted triangle. The lead time between ctDNA detection ≥2 weeks from end of treatment and clinical recurrence is indicated with a solid line. Time is measured from end of treatment. Supplementary Figure S2, available at https://doi.org/10.1016/j.annonc.2022.02.007 shows the data split into cases that had ctDNA detected or not detected in the baseline (pretreatment) samples. Examples of longitudinal monitoring of ctDNA in plasma from: (C) patient 218 with adenocarcinoma and stage IA disease treated by surgery; (D) patient 267 with adenocarcinoma and stage IIB disease, treated with surgery followed by adjuvant chemotherapy and radiotherapy (indicated by the shaded region)—the patient had no clinical progression until they were lost to follow-up 1047 days after the end of treatment; (E) patient 297 with adenocarcinoma and stage IIA disease treated by surgery; (F) patient 276 with squamous cell carcinoma and stage IIA disease, treated by surgery. Red dots indicate samples with ctDNA detected, and black circles indicate samples in which ctDNA was not detected, when analyzed using patient-specific RaDaR™ assays. Time is measured (horizontal axis) from the end of treatment. Black arrows above the plot indicate the time of surgery, and clinical recurrence if this occurred during the study is indicated by an inverted triangle. ‘D’ or ‘E’ above the axes indicate death, or end of follow-up. Time of these events is indicated on the horizontal axis. Bold vertical lines are a guide to the eye and indicate the lead time (shown in text above the axes) between the earliest detection of ctDNA, ≥2 weeks after the end of treatment, and when clinical progression was first recorded for each patient. Supplementary Figure S3, available at https://doi.org/10.1016/j.annonc.2022.02.007 shows time courses, with long-term outcomes, for all 88 patients. ctDNA, circulating tumour DNA; ND, not detected.
Figure 4
Figure 4
Survival analysis based on ctDNA detection. Kaplan–Meier analysis showing the fraction of patients without events as a function of time. Patients right-censored due to loss of information are shown as vertical tick-marks. Patient subgroups are defined based on ctDNA detection using the RaDaR™ assay at different timepoints (see individual panels). Patients with ctDNA detected are shown in red dotted lines, and those with ctDNA not detected at the respective timepoints are shown in black solid lines. The numbers of patients remaining at risk are shown below each graph. (A) Overall survival (OS) and (B) recurrence-free survival (RFS, counting as events either recurrence of the first primary tumour or death if not preceded by a second primary tumour), for patients split by ctDNA detection at the landmark timepoint, which is the first plasma sample available in the window ≥2 weeks and ≤4 months after the end of treatment (data available for 59 patients in total). Hazard ratios: 5.48 [95% confidence interval (CI): 2.18-13.76] and 14.8 (95% CI: 5.82-37.48) for OS and RFS, respectively (P values: 2.9e-4 and 1.4e-8). (C) OS and (D) RFS for patients split by ctDNA detection before treatment (data available for 78 patients in total). Hazard ratios: 2.97 (95% CI: 1.30-6.80) and 3.14 (95% CI: 1.49-6.60) for OS and RFS, respectively (P values: 0.01 and 0.003). (E) RFS for patients split by ctDNA detection at any timepoint ≥2 weeks after the end of treatment (data available for 77 patients in total). Hazard ratio: 9.81 (95% CI: 4.75-20.29, P value: 7e-10). (F) Fraction of patients who remain free from recurrence split by ctDNA detection at any timepoint ≥2 weeks after the end of treatment, for patients for whom ctDNA was detected before treatment (data available for 30 patients in total). Hazard ratio: 18.2 (95% CI: 3.9-85.13, P value: 2.2e-4).

References

    1. Globocan 2020. World Health Organisation, International Agency for Research on Cancer. https://gco.iarc.fr/today/data/factsheets/cancers/15-Lung-fact-sheet.pdf Available at. Accessed March 18, 2020.
    1. Cancer Research UK. 2020. https://www.cancerresearchuk.org/health-professional/cancer-statistics/s... Available at. Accessed March 18, 2020.
    1. NICE. Lung cancer in adults: treatments with curative intent. Webpage. 2021. https://www.nice.org.uk/guidance/qs17/chapter/Quality-statement-5-Treatm... Available at. Accessed March 18, 2020.
    1. Wan J.C.M., Massie C., Garcia-Corbacho J., et al. Liquid biopsies come of age: towards implementation of circulating tumour DNA. Nat Rev Cancer. 2017;17(4):223–238. - PubMed
    1. Dawson S.-J., Tsui D.W.Y., Murtaza M., et al. Analysis of circulating tumour DNA to monitor metastatic breast cancer. N Engl J Med. 2013;368(13):1199–1209. - PubMed

Publication types

MeSH terms