. 2022 Apr:283:121464.
doi: 10.1016/j.biomaterials.2022.121464. Epub 2022 Mar 16.

Soluble ECM promotes organotypic formation in lung alveolar model

Affiliations

Soluble ECM promotes organotypic formation in lung alveolar model

Jonard C Valdoz et al. Biomaterials. 2022 Apr.

Abstract

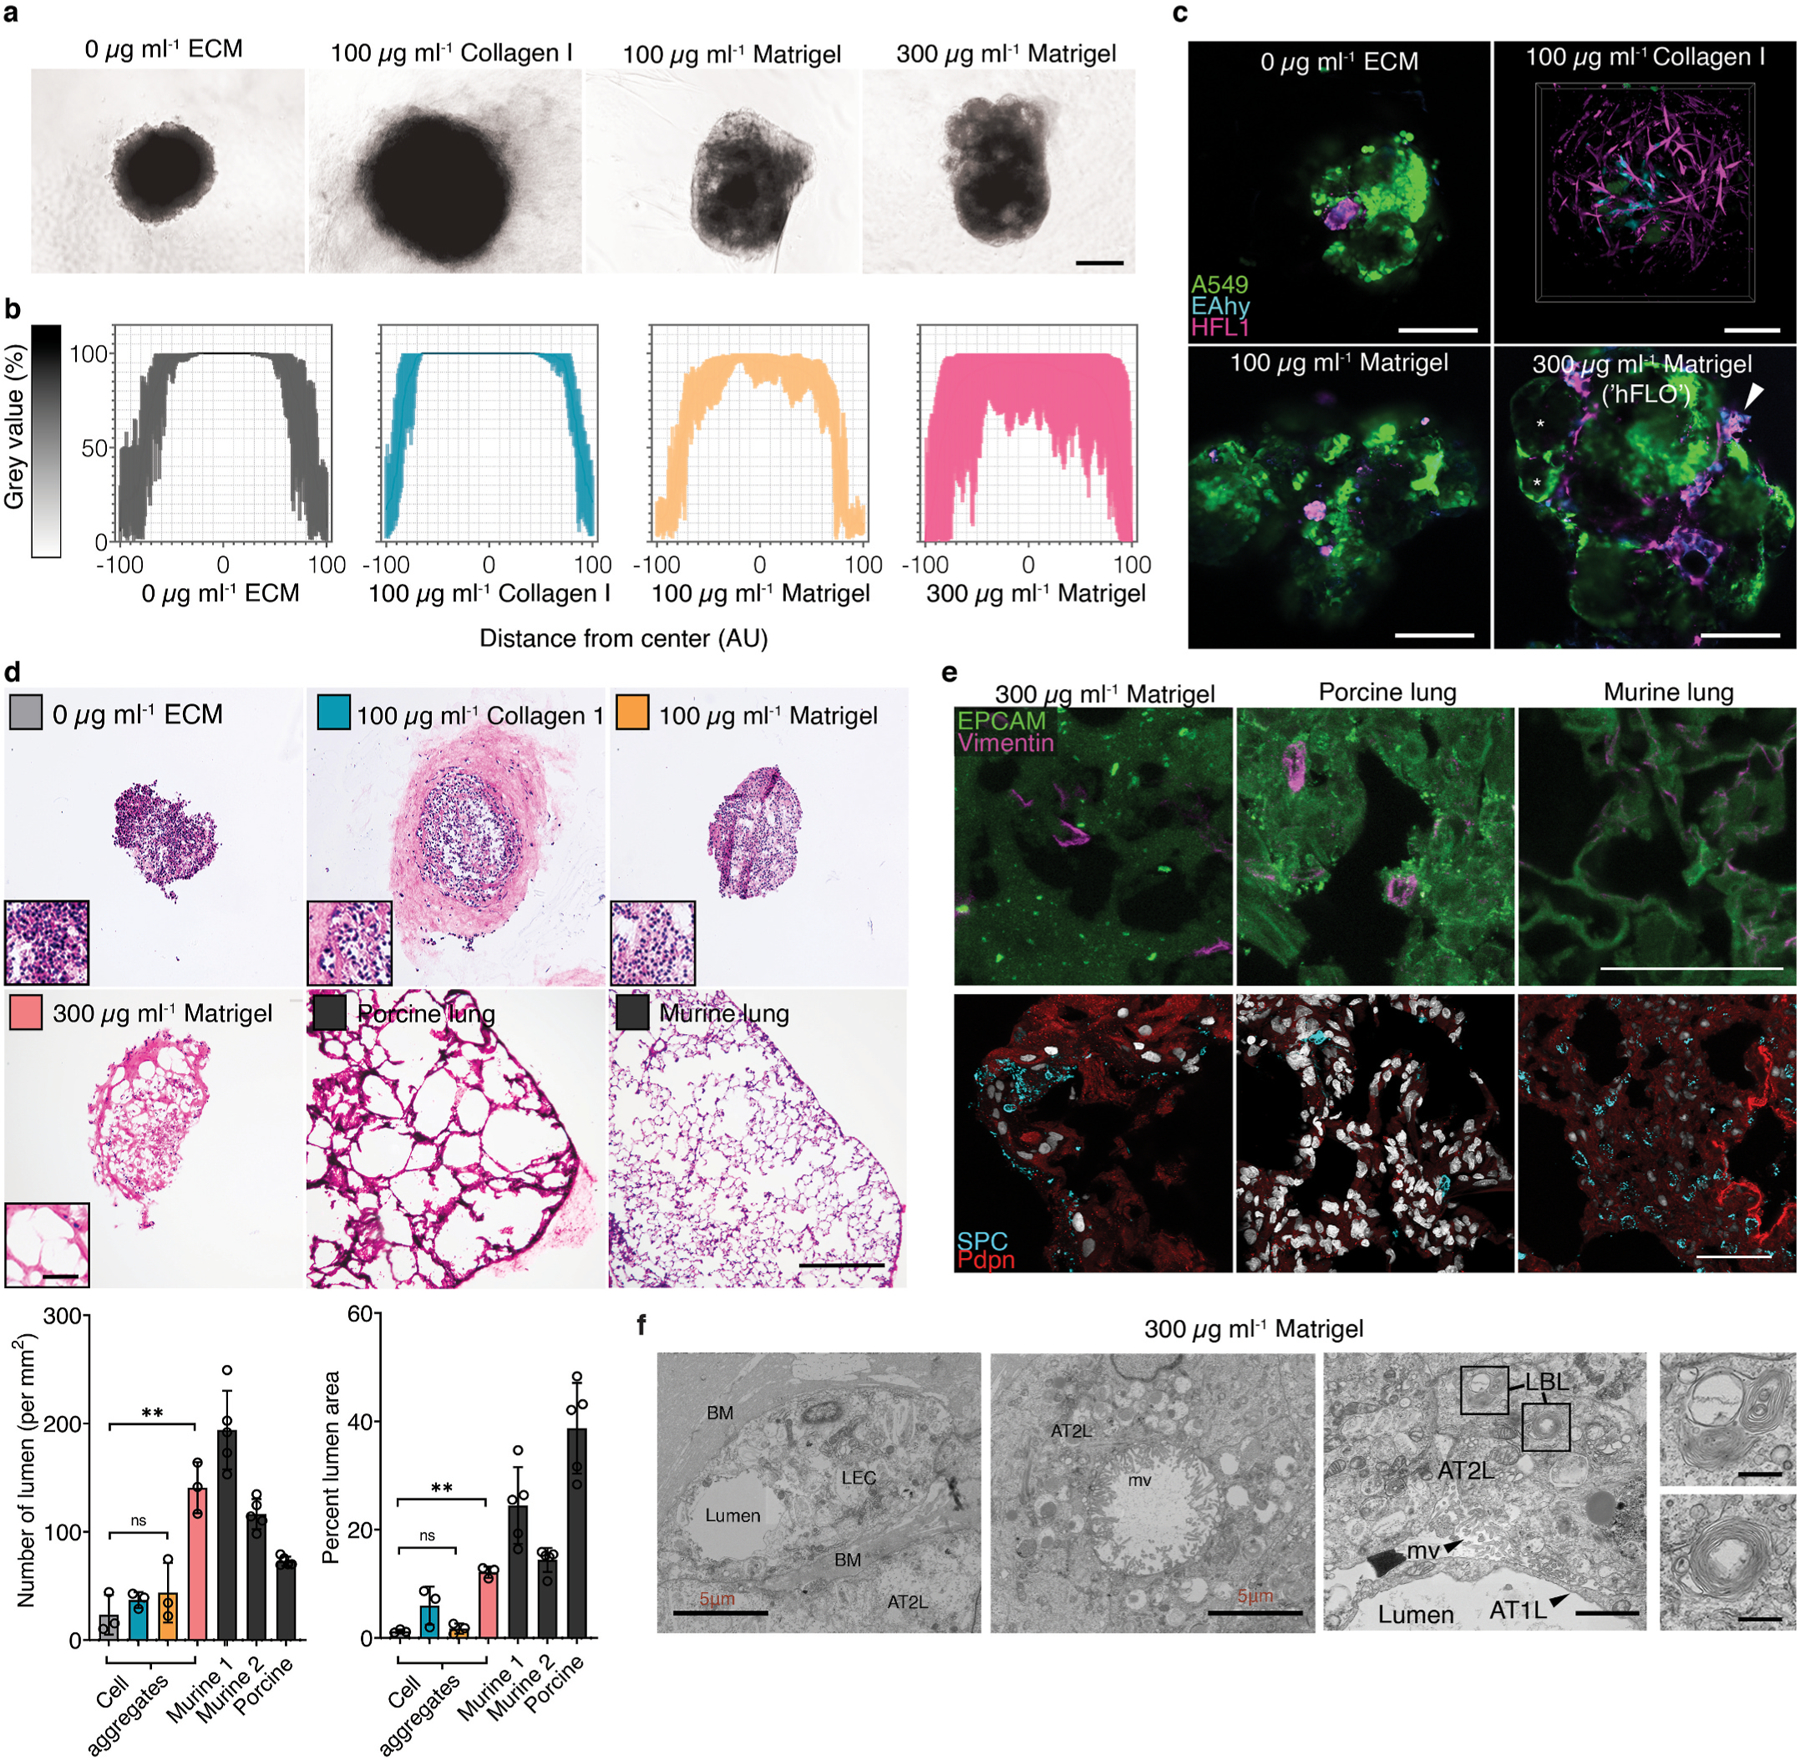
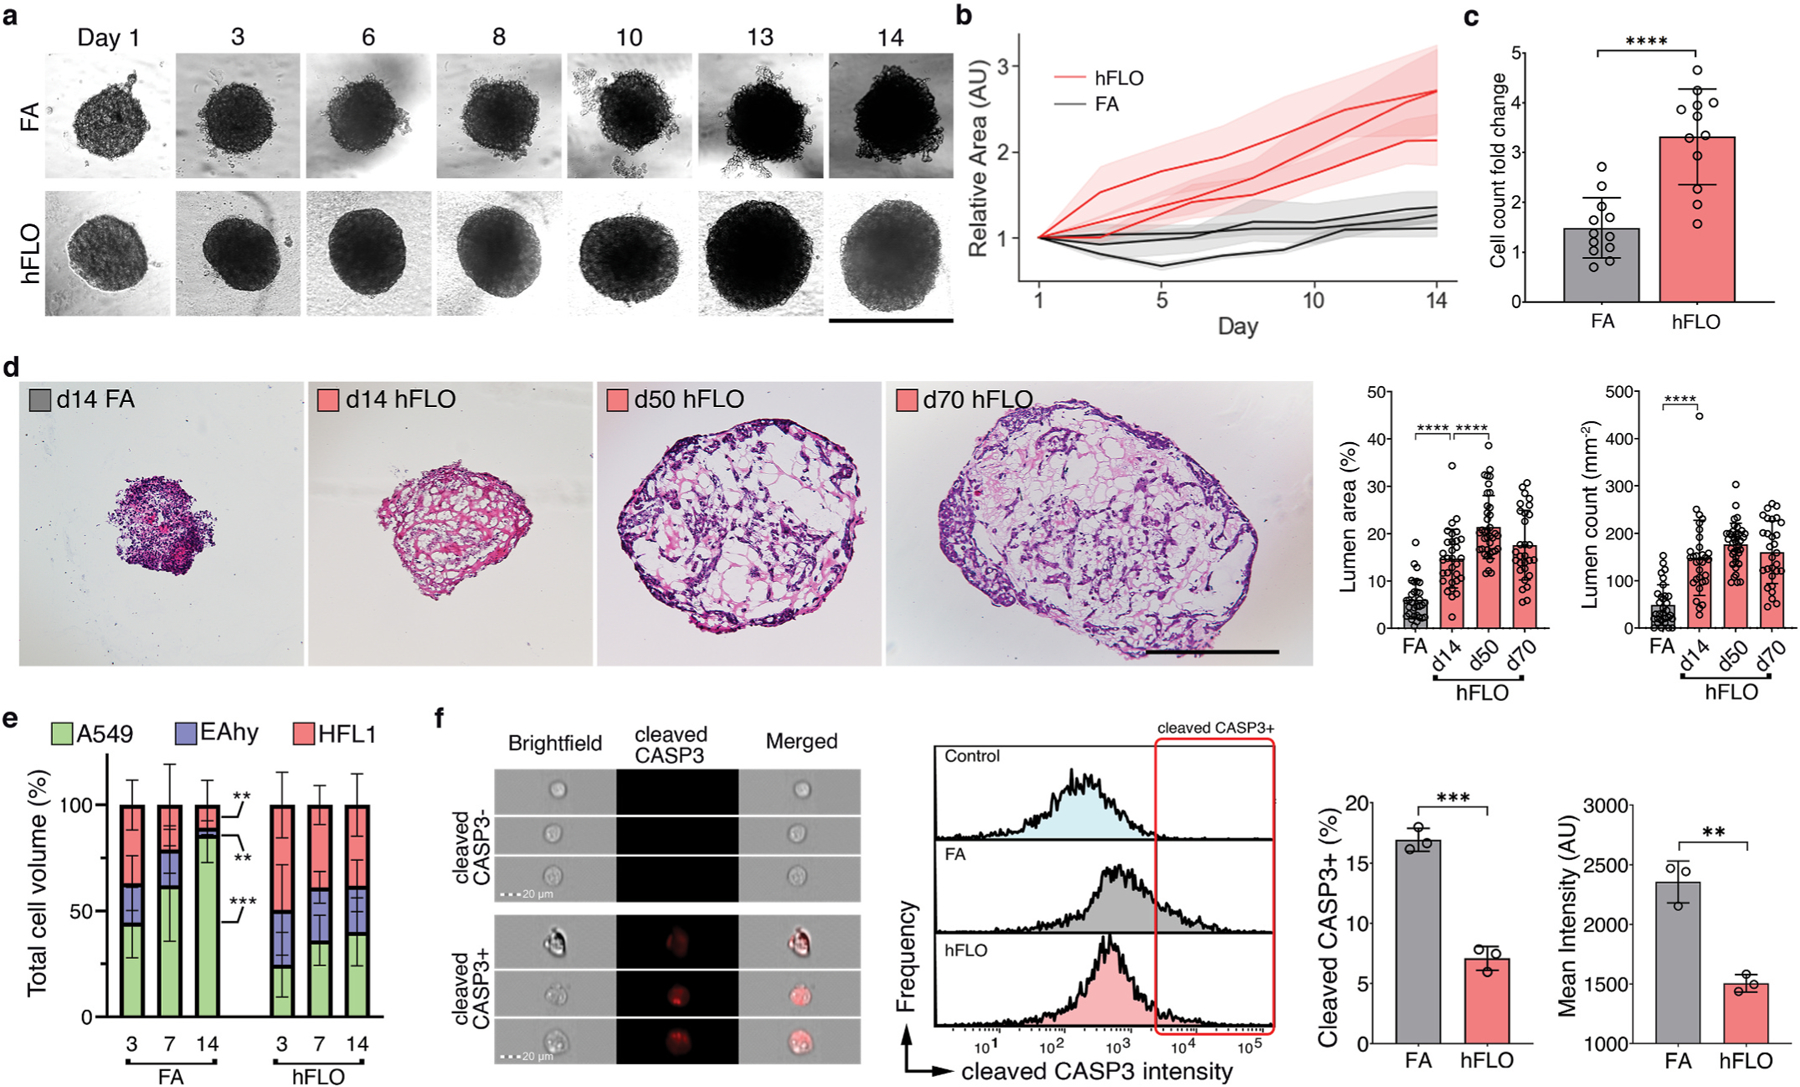
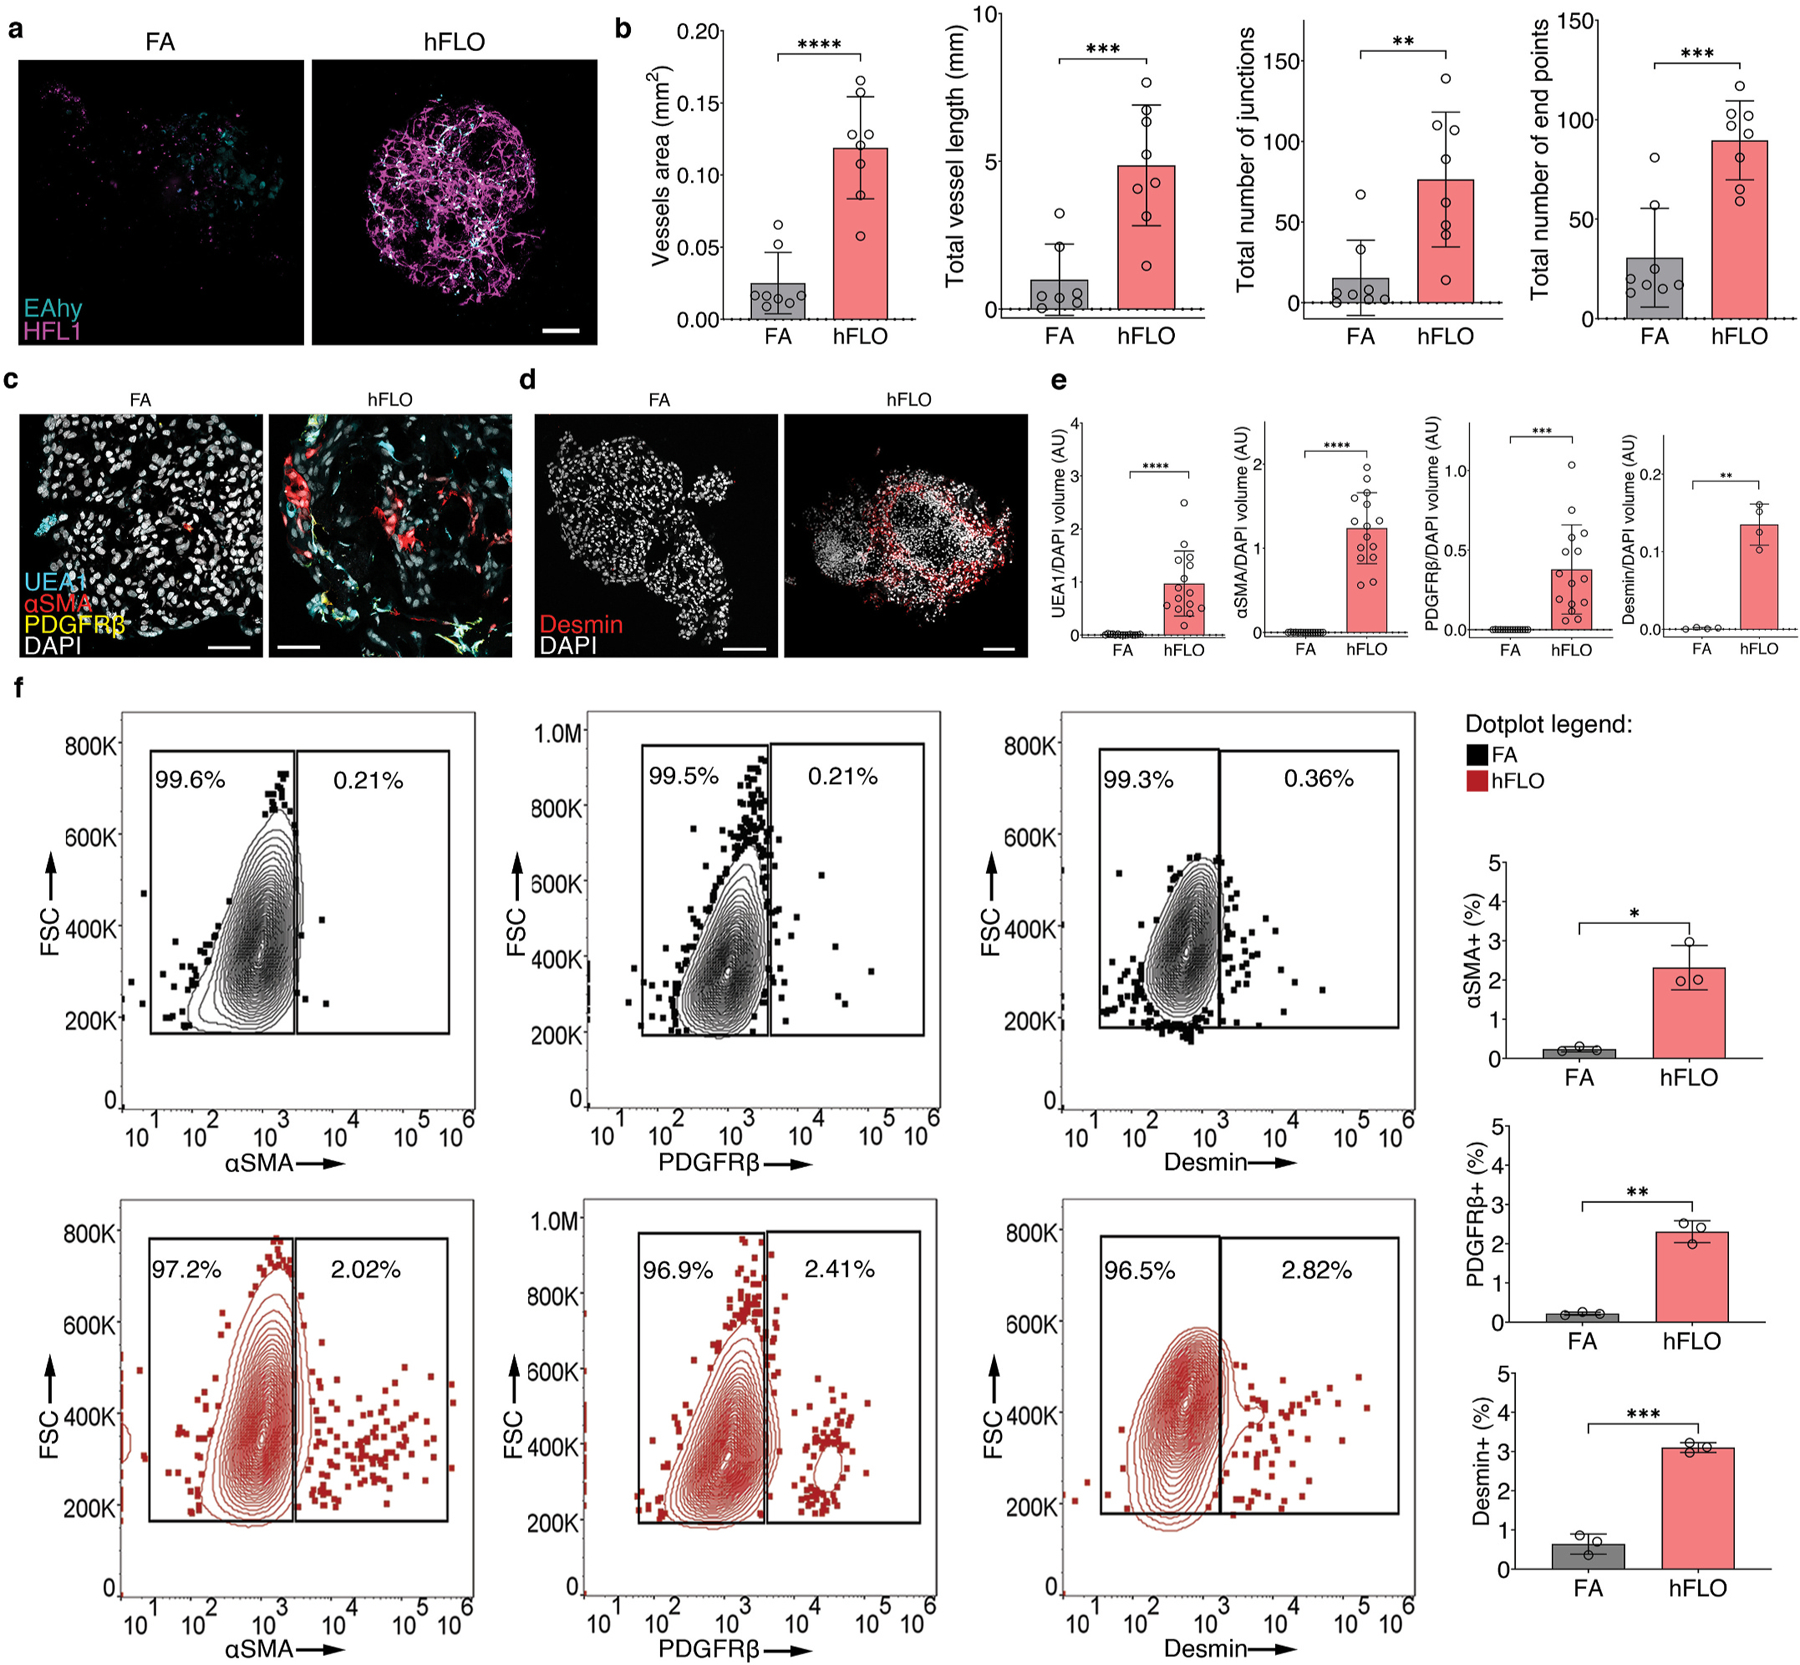
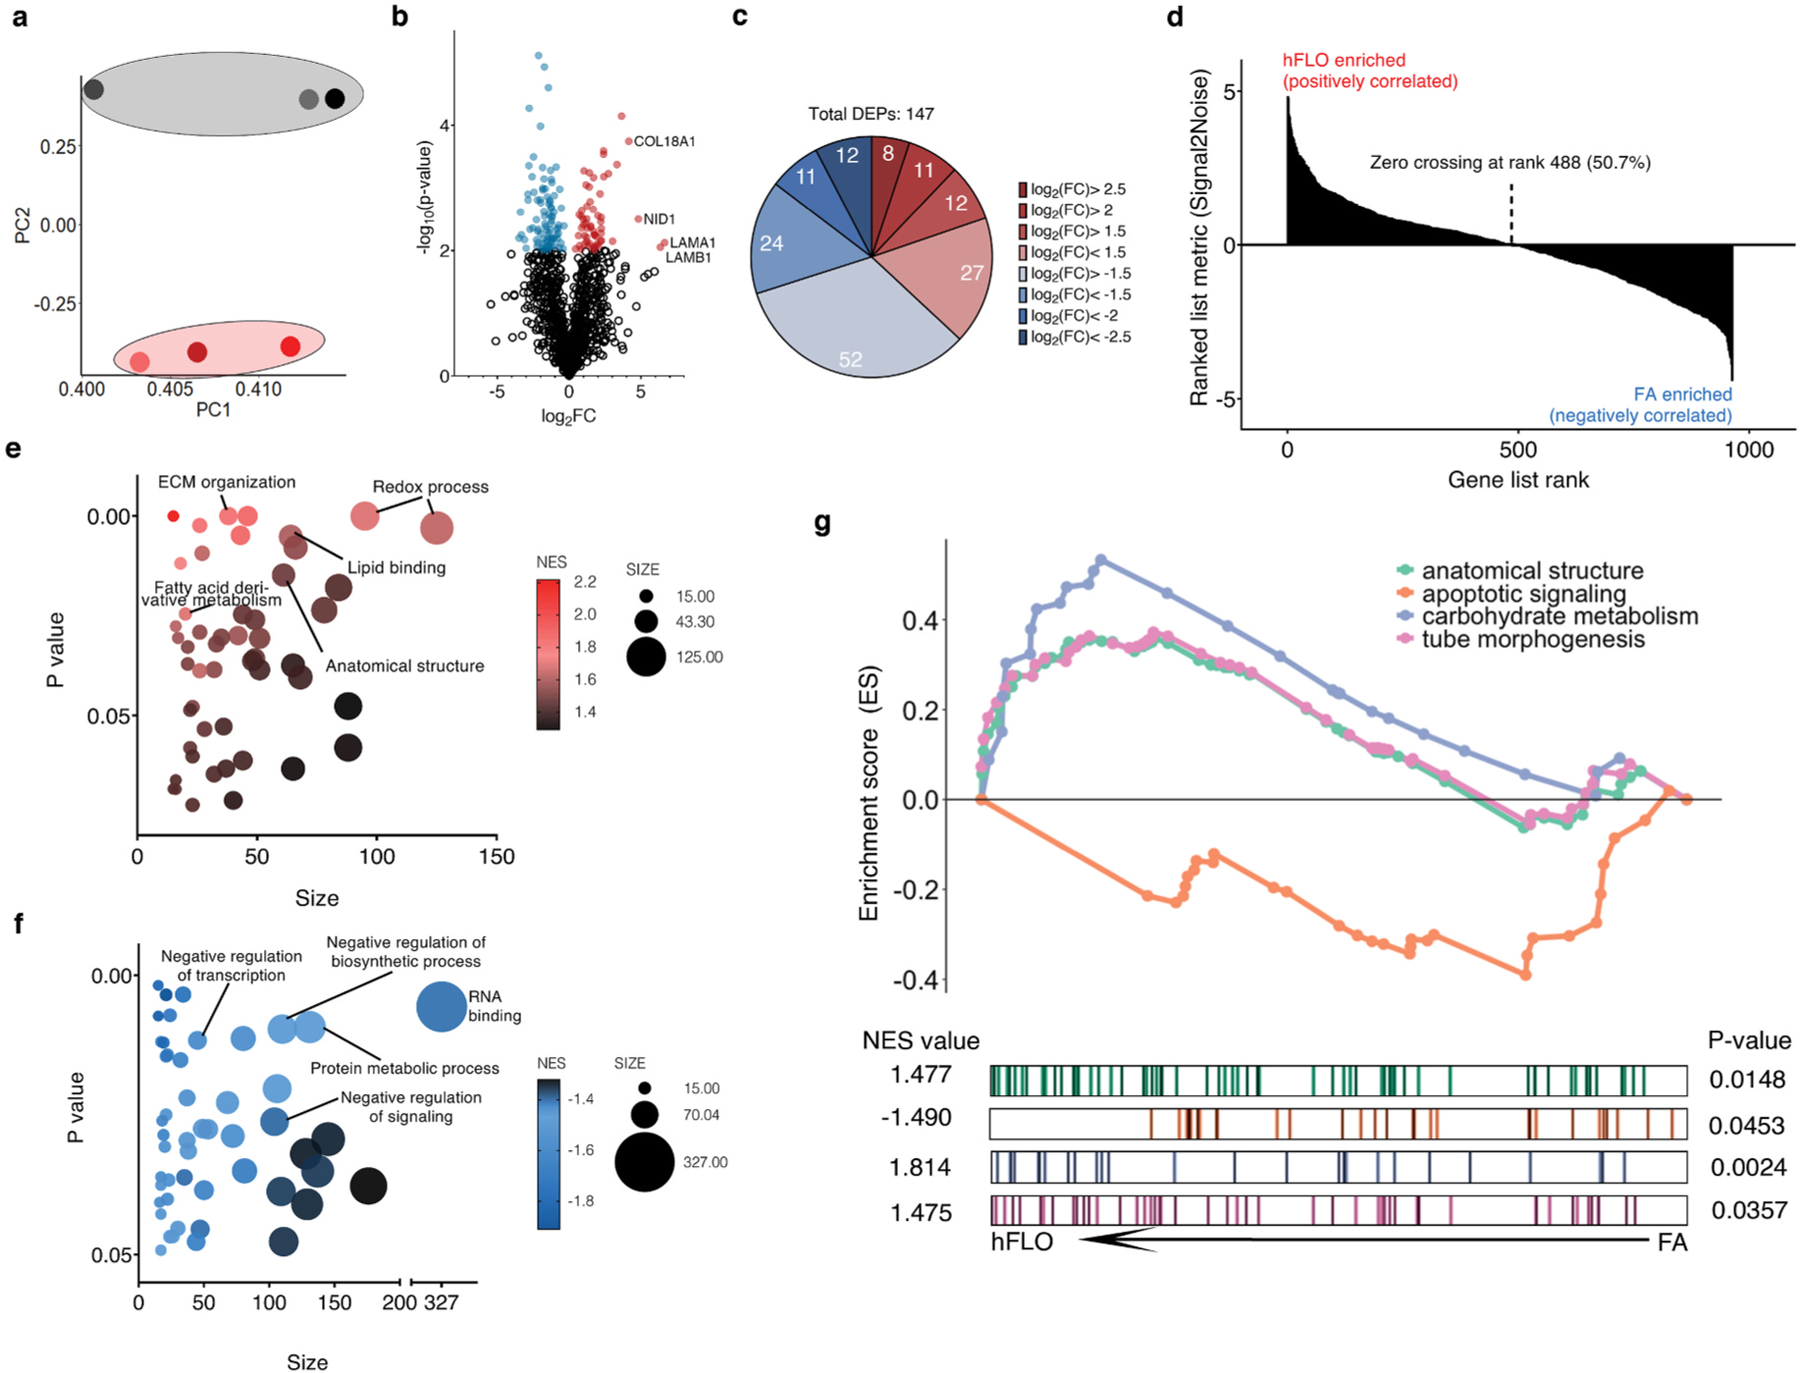
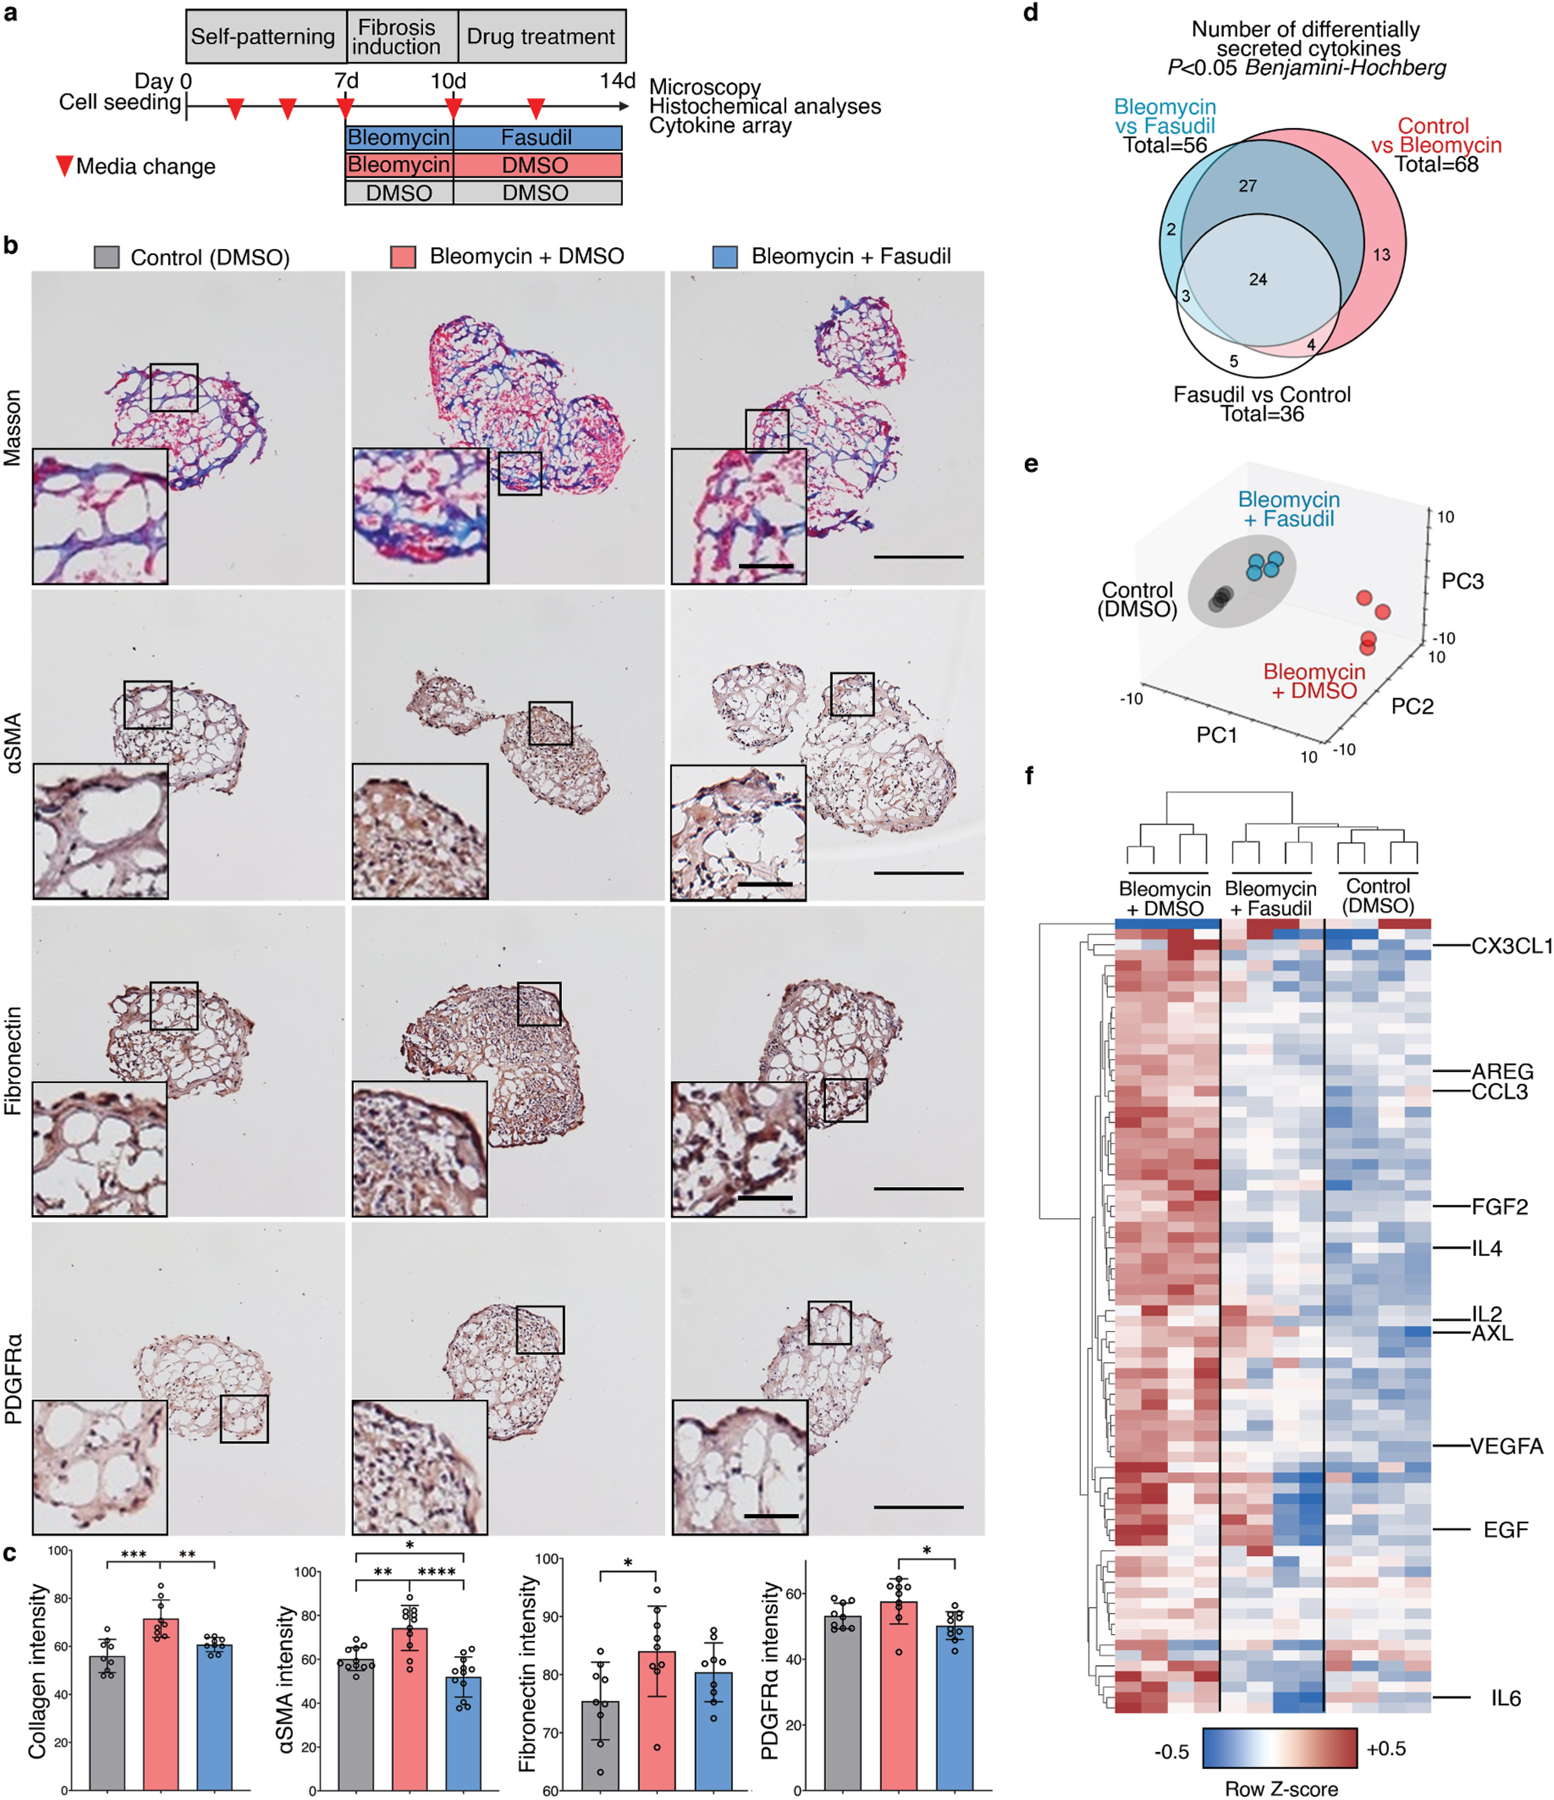
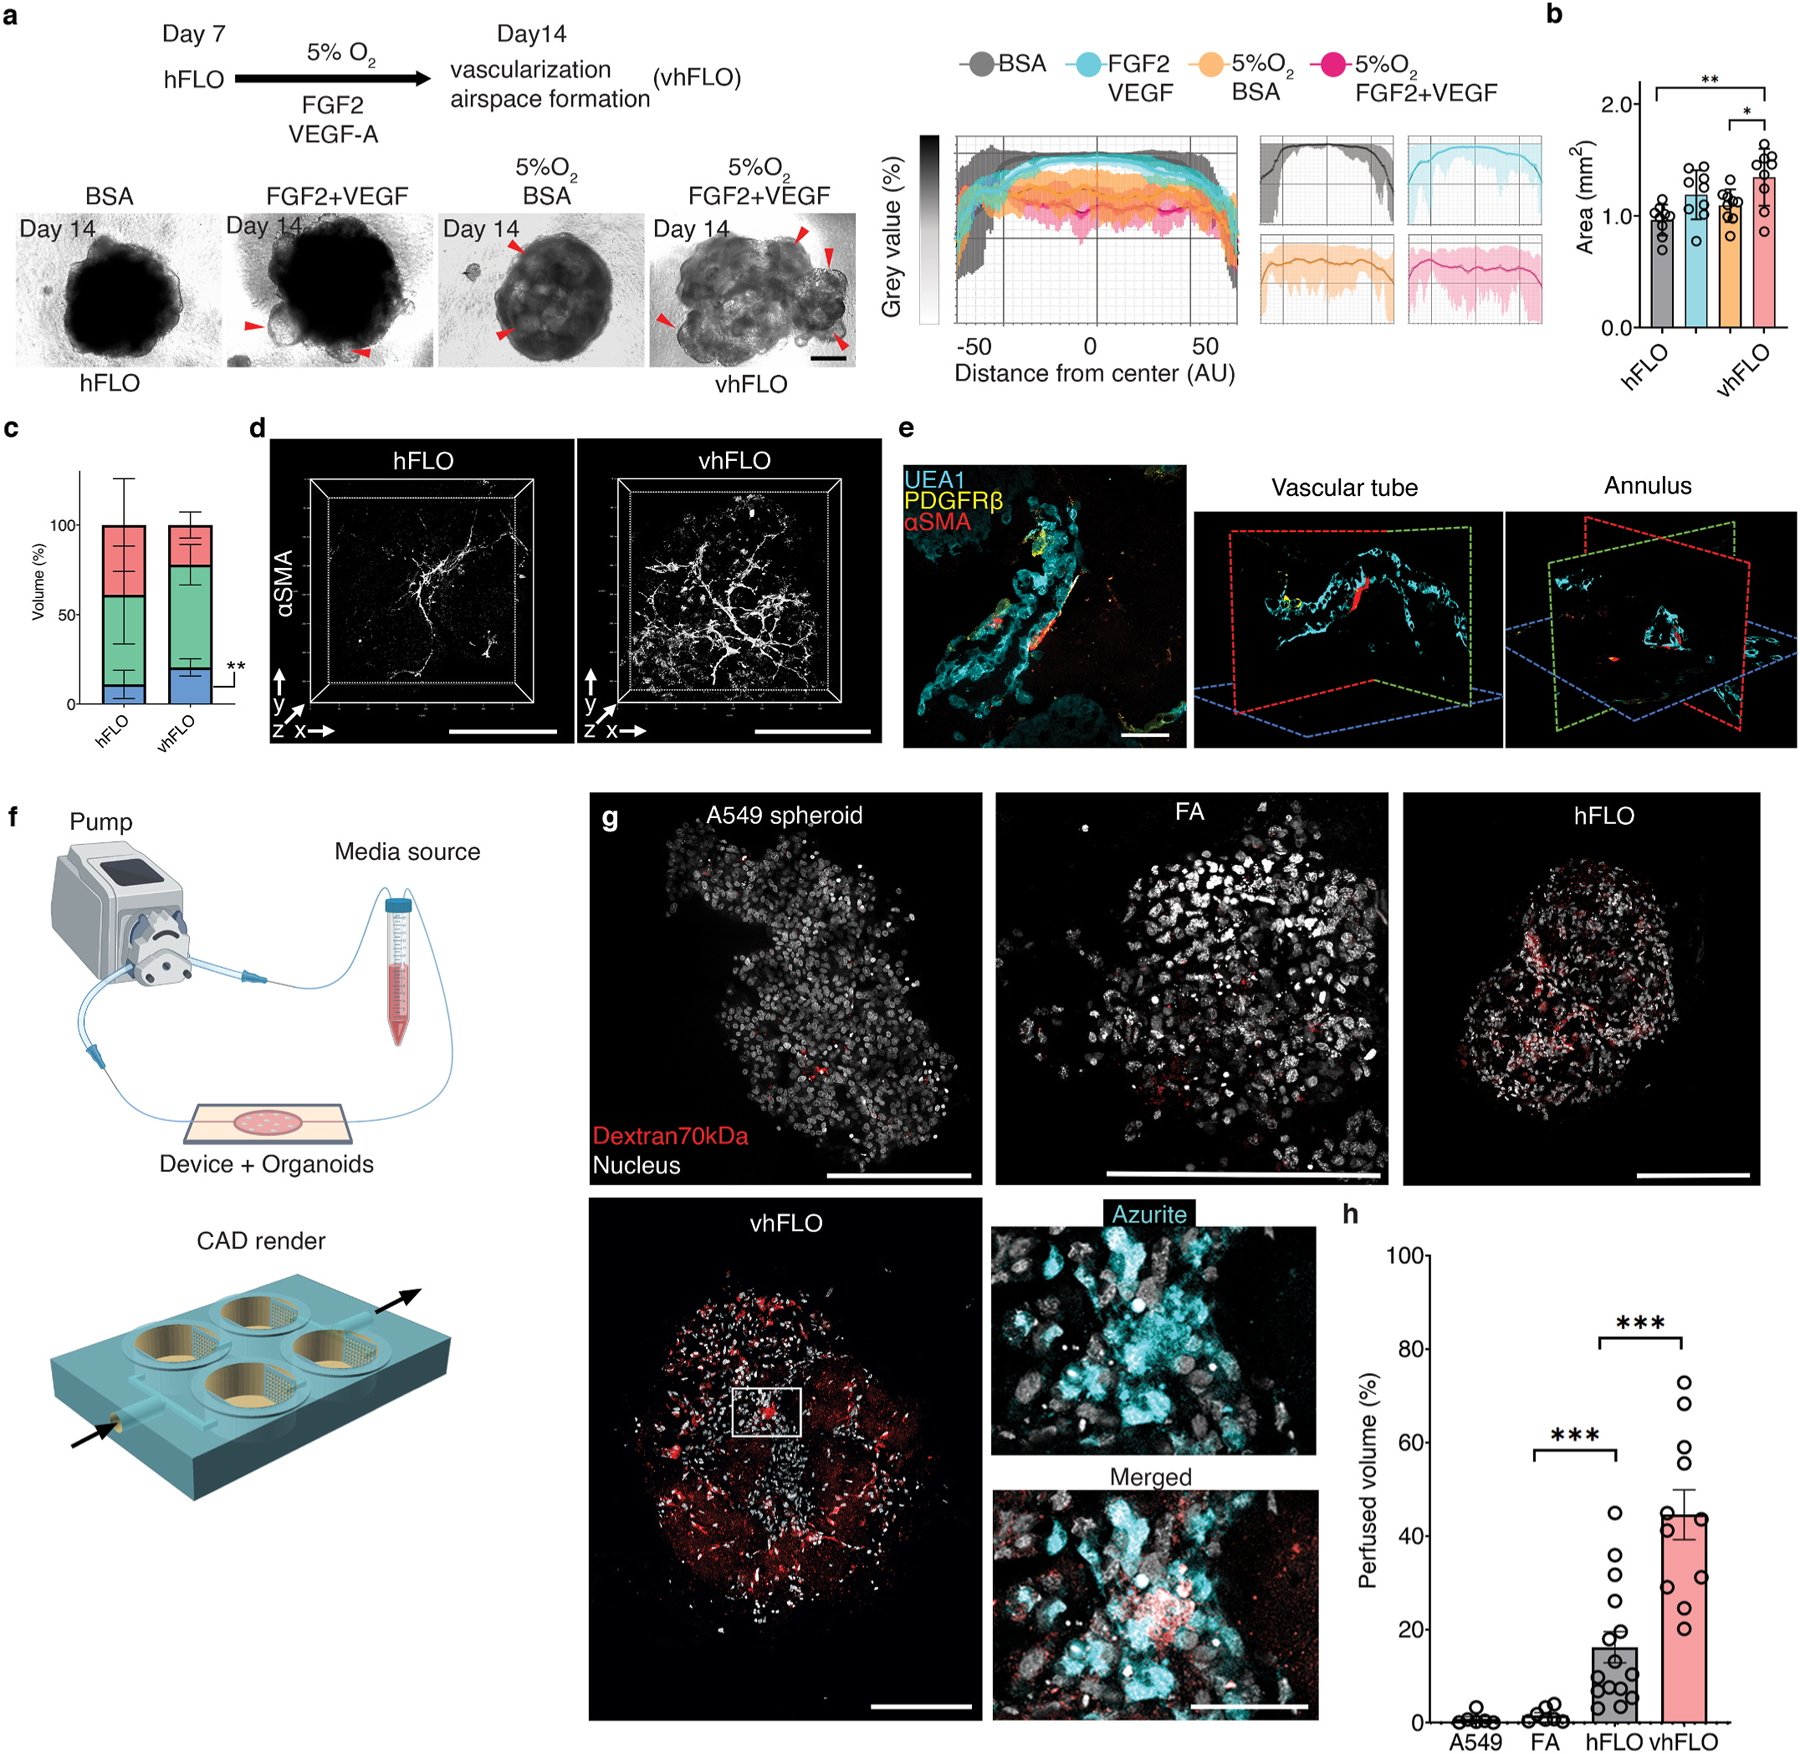
Micropatterned suspension culture creates consistently sized and shaped cell aggregates but has not produced organotypic structures from stable cells, thus restricting its use in accurate disease modeling. Here, we show that organotypic structure is achieved in hybrid suspension culture via supplementation of soluble extracellular matrix (ECM). We created a viable lung organoid from epithelial, endothelial, and fibroblast human stable cell lines in suspension culture. We demonstrate the importance of soluble ECM in organotypic patterning with the emergence of lumen-like structures with airspace showing feasible gas exchange units, formation of branching, perfusable vasculature, and long-term 70-day maintenance of lumen structure. Our results show a dependent relationship between enhanced fibronectin fibril assembly and the incorporation of ECM in the organoid. We successfully applied this technology in modeling lung fibrosis via bleomycin induction and test a potential antifibrotic drug in vitro while maintaining fundamental cell-cell interactions in lung tissue. Our human fluorescent lung organoid (hFLO) model represents features of pulmonary fibrosis which were ameliorated by fasudil treatment. We also demonstrate a 3D culture method with potential of creating organoids from mature cells, thus opening avenues for disease modeling and regenerative medicine, enhancing understanding of lung cell biology in health and lung disease.

Keywords: Extracellular matrix; Lung organoid; Pulmonary fibrosis; Suspension culture; Tissue engineering; Vascularization.


Conflict of interest statement

Declaration of competing interest

The authors declare the following financial interests/personal relationships which may be considered as potential competing interests: Jonard C. Valdoz and Pam M. Van Ry filed a provisional patent for “A Suspension-based 3D culture method for stable or primary cells and a fluorescent lung triculture organoid” (Provisional Pat. No. 63185423, Docket No. 2021–012). G.P.N. owns shares in Acrea 3D, a company commercializing microfluidic 3D printing.

Figures

Fig. 1.
Fig. 1.
Alveolar-like lumen structure formation. a, Representative bright-field images of 3D cell aggregates after 14 days of culture. Scale bars, 300 μm b, Effect of soluble ECM in aggregate density. Line profile analysis at the major axis of the aggregates expressed as normalized grey value. Lines indicate the grey value range at the specific normalized distance from the center. c, Live 3D fluorescence confocal image (single z-section) showing the self-organized localization of the three cell lines—A549 (green), EAHy (blue), and HFL1 (magenta). In aggregates grown using 300 μg mL−1 Matrigel, organotypic structures such as the lumina (*) and endothelial networks (arrow) are indicated. Scale bars, 200 μm d, Hematoxylin and Eosin staining of the aggregates showing that the lumen formation in 300 μg mL−1 Matrigel aggregates is comparable to the mammalian lung parenchyma. Scale bars, 300 μm for full image; 50 μm for inset. Lumen formation is quantified using number of lumen normalized to aggregate size and percent lumen area. Bar colors are indicated in the micrographs above. Mean, individual measurements, and standard deviation are shown. Three independent cell aggregates and lungs from two mice and one pig were used. **P < 0.01, ns (P > 0.05) determined by One-way ANOVA with Welch’s correction. e, Fluorescence confocal images (maximum projection) showing localization of epithelial cells (EPCAM, green) and mesenchymal cells (Vimentin, magenta) relative to the lumen. Specific alveolar epithelial subtypes: Type I (Podoplanin, red) and Type II (prosurfactant protein C, blue). Scale bars, 50 μm f, Transmission electron microscopy of cell aggregates showing stratification and lumen formation in 300 μg mL−1 Matrigel aggregates. Alveolar type II-like epithelial cells (AT2L) shown with their lamellar body-like inclusions (LBL) and microvilli (mv). Other features include: thin, alveolar type I-like cells (AT1L), a luminal structure, presence of a basement membrane (BM), and luminal endothelial cells (LEC). Scale bars, 3 μm for full images; 500 nm for zoomed images. (For interpretation of the references to color in this figure legend, the reader is referred to the Web version of this article.)
Fig. 2.
Fig. 2.
3D aggregate growth and cell survival. a, Bright-field images of 3D cell aggregates during the 14-day culture. Scale bar, 300 μm b, Line graph showing change in aggregate area. Areas were normalized to their respective day 1 area. Means and standard deviation are shown. Individual line indicates independent experiments performed by independent researchers. N = 10 independently sampled aggregates on each measured day. c, Cell counts at day 14-fold change from day 0 seeding density. Means, individual values, and standard deviation are shown. 3 independent experiments were performed with >3 cell aggregates used; N = 12 aggregates. ****P < 0.0001 determined by two-tailed t-test with Welch’s correction. d, Hematoxylin and Eosin staining of cell aggregates showing stability of lumen structure in hFLO (up to 70 days of culture) as quantified using lumen area and count. Mean, individual values, and standard deviation are shown. ****P < 0.0001 determined using two-tailed t-test with Welch’s correction using values from n = 27 independent aggregates. e, Cell population composition at days 3, 7, and 14 of culture; n = 7 independently sampled aggregates. **P < 0.01, ***P < 0.001 determined using One-way ANOVA with Welch’s correction comparing day 14 to day 3 values. f, Expression of cleaved caspase 3 of day 14 cell aggregates using imaging flow cytometry. Three independent plates (around 200 cell aggregates) were used and an unstained control from pooled samples was used as a negative gating control. Left bar plot shows percent positive cells with mean, individual points, and standard deviation indicated. Right bar plot shows mean intensities found in each of the samples. ***P < 0.001 determined using two-tailed t-test with Welch’s correction.
Fig. 3.
Fig. 3.
Vascular endothelial branching. a, Live fluorescence confocal images (maximum projection) of day 14 cell aggregates showing EAHy (endothelial, blue) and HFL1 (magenta). Scale bars, 100 μm b, AngioTool outputs characterizing the abundance and branching of the EAhy-HFL1 networks. We used 8 independent aggregates per condition. **P < 0.01, ***P < 0.001, ****P < 0.0001 determined using two-tailed t-test with Welch’s correction. c, Fluorescence confocal images (maximum projections) of day 14 hFLO showing the presence of vascular cells including endothelial-like (UEA1 lectin), smooth muscle-like (αSMA), and pericyte-like (PDGFRβ) cells.d, Another perivascular marker, desmin was detected in day 14 hFLO. DAPI was used as the nuclear stain. Scale bars, 100 μm e, Volumetric analyses of UEA1, αSMA, PDGFRβ, and desmin in FA and hFLO aggregates normalized to DAPI volume. We used n = 15 independent cell aggregates for UEA1, αSMA, and PDGFRβ, and n = 4 independent cell aggregates for desmin. **P < 0.01, ***P < 0.001, ****P < 0.0001 determined using two-tailed t-test with Welch’s correction. f, Flow cytometric analysis of whole cell aggregates for expression of αSMA, PDGFRβ, and desmin in FA and hFLO. Contour plots show percent gated cells, contours, and outliers were indicated as dots. Three independent plates were used for each. Bar plots show means, individual points, and standard deviation from positive gates. *P < 0.05, **P < 0.01, ***P < 0.001 determined using two-tailed t-test with Welch’s correction. (For interpretation of the references to color in this figure legend, the reader is referred to the Web version of this article.)
Fig. 4.
Fig. 4.
Shotgun proteomics. a, Principal component analysis plot of the first and second components. Dots represent the whole proteome of three independent samples used for FA aggregates (grey) and hFLO (pink). Grouping is highlighted using an enclosing oval. b, Volcano plot showing fold changes (log2FC) of hFLO versus FA aggregates. P values were calculated using two-tailed t-tests with Welch’s correction. Red points indicate proteins with P < 0.01. c, Distribution of the differentially expressed proteins (DEPs, P < 0.01). d, Gene set enrichment analysis (GSEA) plot of all proteins ranked based on enrichment score (Signal2Noise). e, Scatter plot of the top 50 GO-Terms enriched in hFLO. Dot size corresponds to number of genes annotated per term and color corresponds to the normalized enrichment score (NES). f, Scatter plot of the top 50 GO-Terms enriched in FA (negative enrichment in hFLO). g, GSEA enrichment plot for selected GO-Terms. Barcodes show individual proteins annotated in each GO-Term and their respective ranks based on enrichment of hFLO versus FA. (For interpretation of the references to color in this figure legend, the reader is referred to the Web version of this article.)
Fig. 5.
Fig. 5.
Pre-clinical hFLO-bleomycin fibrotic model and resolution of fibrotic features using fasudil. a, Schematic diagram of the workflow showing aggregate formation and self-patterning for 7 days, induction of fibrosis using bleomycin (20 μg mL−1) for 3 days, and antifibrotic trial using fasudil (10 μM). Dimethyl sulfoxide (DMSO) is the vehicle used for the bleomycin and fasudil. b, Histochemical and immunohistochemical analyses for the extent of induced fibrosis in the hFLO aggregates. Insets show fibroblastic foci for bleomycin-treated aggregates. Scale bars, 300 μm for full image; 60 μm for inset. Masson staining shows the extent of collagen deposition (blue). We used 9 independent aggregates per condition. Hematoxylin and DAB immunostaining (H-DAB) of pro-fibrotic markers αSMA, fibronectin, and PDGFRα, respectively. We used n = 11, n = 9, and n = 9 independent aggregates per condition for H-DAB probing for αSMA, fibronectin, and PDGFRα, respectively. c, Histochemical and immunohistochemical image analyses. Bar graphs show means, individual values, and standard deviations are shown. *P < 0.05, **P < 0.01, ***P < 0.001, ****P < 0.0001 determined using One-way ANOVA with Welch’s correction. Color legends shown in b. d-f, Cytokine array profiling the secreted factors from the treatment groups. Raw immunoblot intensity were normalized to internal positive and negative controls. d, Differentially secreted factors (P < 0.05) were determined using two-tailed Welch’s t-test with Benjamini-Hochberg FDR correction. Statistical tests were done comparing each group to each other. Venn diagram shows overlap among differentially secreted factors. e, Principal component analysis of the differentially secreted factors. Dots show media samples collected from the organoids and axes represent principal components (PC) 1, 2, and 3. Clustering among fasudil-treated and control samples is emphasized by the grey ellipse. f, Cluster heatmap (Euclidean) of the differentially secreted factors showing clustering of fasudil-treated and control samples, separate from bleomycin-treated samples. Known cytokine/chemokine effectors of angiogenesis and fibrosis are annotated. Cell color is based on row average-normalized z-scores. (For interpretation of the references to color in this figure legend, the reader is referred to the Web version of this article.)
Fig. 6.
Fig. 6.
Hypoxic vascularization using hFLO. a, Schematic diagram of the workflow showing further vascular growth using hypoxia and pro-angiogenic factors (top left). Bright-field images of aggregates at day 14 of culture (bottom left). vhFLO is hFLO grown under hypoxia for 7 days with supplementation of FGF2 and VEGF. Line profile analysis at the major axis of the aggregates expressed as normalized grey value. Effects of the hypoxic culture in aggregate density is shown using line profile analysis (right). Lines indicate the grey value range at the specific normalized distance from the center. Scale bar, 300 μm b, Aggregate area at day 14 of culture. 9 independent aggregates were measured for each condition. *P < 0.05, **P < 0.01 determined using One-way ANOVA with Welch’s t-test. c, HFL1 (red), A549 (green), and EAhy (blue) cell population percent volume composition in hFLO and vhFLO. N = 7 independent 3D live confocal images were used. **P < 0.01 determined using two-tailed t-test with Welch’s correction. d, Whole aggregate immunostaining of αSMA expression. Scale bar, 200 μm e, 3D fluorescence confocal image of vhFLO showing vascular-like formation and localization of endothelial-like (UEA1 lectin+, BLUE), pericyte-like (PDGFRβ+, yellow), and smooth muscle-like (αSMA+, red). 3D renderings highlight annular tube morphology typical of a vasculature. Scale bar, 50 μm f, Illustration of the vascular perfusion assay using dextran 70 kDa flown through a peristaltic pump system (top). The chip used for this assay is shown as a CAD render with fluidic flow indicated by arrows. Additional information could be found in Supplementary Fig. 10 g, Whole aggregate fluorescence confocal images (single z section) of A549 spheroid, FA, hFLO and vhFLO. Images show extent of dextran 70 kDa perfusion. Zoomed images showing dextran and azurite colocalization in vhFLO. Scale bars, 200 μm for full images; 50 μm for zoomed images. h, Volumetric analysis of extent of perfusion in the aggregates. A549 spheroid was used as a negative control. We used n = 6 A549 spheroid, n = 7 FA, n = 15 hFLO, and n = 11 vhFLO independent aggregates. ***p < 0.001 determined using One-way ANOVA with Welch’s t-test. (For interpretation of the references to color in this figure legend, the reader is referred to the Web version of this article.)

Similar articles

Cited by

References

    1. Lu P, Weaver VM, Werb Z, The extracellular matrix: a dynamic niche in cancer progression, J. Cell Biol 196 (4) (2012) 395–406. - PMC - PubMed
    1. Bonnans C, Chou J, Werb Z, Remodelling the extracellular matrix in development and disease, Nat. Rev. Mol. Cell Biol 15 (12) (2014) 786–801. - PMC - PubMed
    1. Rousselle P, Scoazec JY, Laminin 332 in cancer: when the extracellular matrix turns signals from cell anchorage to cell movement, Semin. Cancer Biol 62 (2020) 149–165. - PubMed
    1. Smith LR, Cho S, Discher DE, Stem cell differentiation is regulated by extracellular matrix mechanics, Physiology 33 (1) (2018) 16–25. - PMC - PubMed
    1. Buchheit CL, Rayavarapu RR, Schafer ZT, The regulation of cancer cell death and metabolism by extracellular matrix attachment, Semin. Cell Dev. Biol 23 (4) (2012) 402–411. - PubMed

Publication types