. 2022 May:51:102281.
doi: 10.1016/j.redox.2022.102281. Epub 2022 Mar 15.

Live cell imaging of oxidative stress in human airway epithelial cells exposed to isoprene hydroxyhydroperoxide

Affiliations

Live cell imaging of oxidative stress in human airway epithelial cells exposed to isoprene hydroxyhydroperoxide

Syed Masood et al. Redox Biol. 2022 May.

Abstract

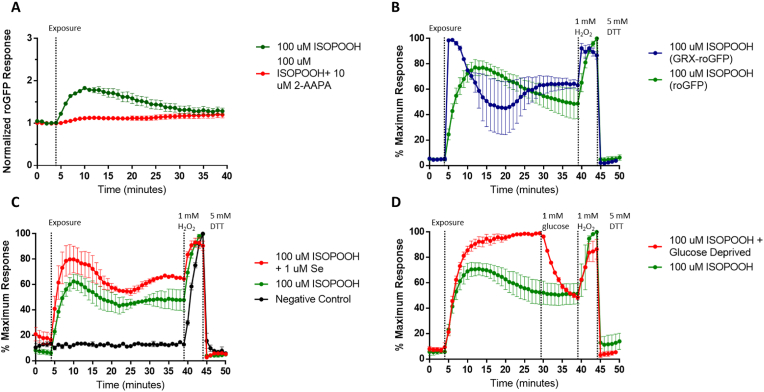
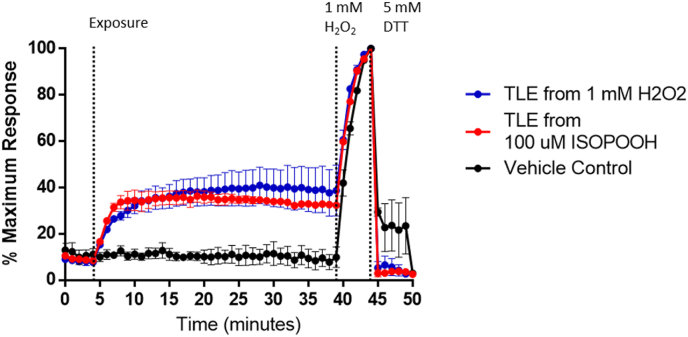
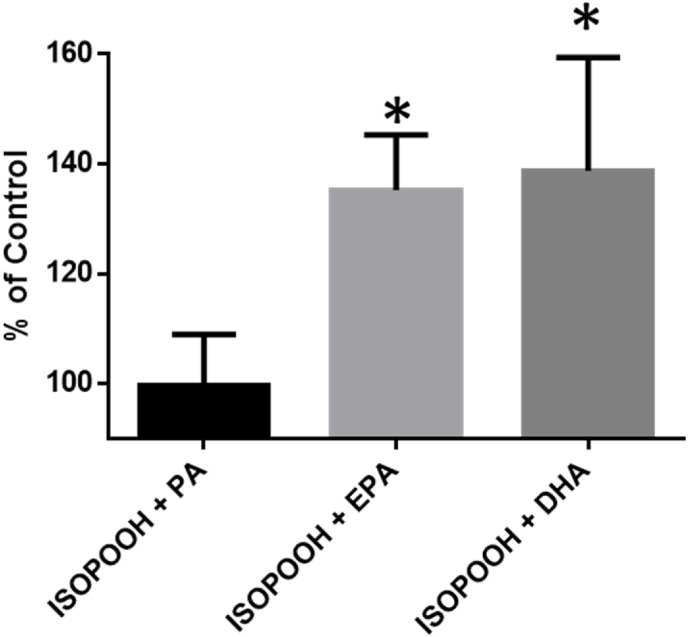
Exposure to respirable air particulate matter (PM2.5) in ambient air is associated with morbidity and premature deaths. A major source of PM2.5 is the photooxidation of volatile plant-produced organic compounds such as isoprene. Photochemical oxidation of isoprene leads to the formation of hydroperoxides, environmental oxidants that lead to inflammatory (IL-8) and adaptive (HMOX1) gene expression in human airway epithelial cells (HAEC). To examine the mechanism through which these oxidants alter intracellular redox balance, we used live-cell imaging to monitor the effects of isoprene hydroxyhydroperoxides (ISOPOOH) in HAEC expressing roGFP2, a sensor of the glutathione redox potential (EGSH). Non-cytotoxic exposure of HAEC to ISOPOOH resulted in a rapid and robust increase in EGSH that was independent of the generation of intracellular or extracellular hydrogen peroxide. Our results point to oxidation of GSH through the redox relay initiated by glutathione peroxidase 4, directly by ISOPOOH or indirectly by ISOPOOH-generated lipid hydroperoxides. We did not find evidence for involvement of peroxiredoxin 6. Supplementation of HAEC with polyunsaturated fatty acids enhanced ISOPOOH-induced glutathione oxidation, providing additional evidence that ISOPOOH initiates lipid peroxidation of cellular membranes. These findings demonstrate that ISOPOOH is a potent environmental airborne hydroperoxide with the potential to contribute to oxidative burden of human airway posed by inhalation of secondary organic aerosols.

Keywords: Air pollution; Glutathione redox potential; Lipid peroxidation; Live cell imagining; Oxidative stress; Secondary organic aerosols.


Figures

Image 1
Graphical abstract
Fig. 1
Fig. 1
Exposure to ISOPOOH induces a rapid increase in EGSHin HAEC. A) Exposure of roGFP-HAEC to 100 μM ISOPOOH for 40 min followed by the addition of 1 mM H2O2 and 5 mM DTT. (B) Cytotoxicity of 100 μM ISOPOOH was measured in HAEC prelabeled with Calcein AM. Cells were treated with to 0.1% Triton-X at 40 min as a positive control. Data shown represent the fluorescence intensity at 510 nm resulting from sequential excitation with 488 and 405 nm laser light. Calculated ratios are corrected for baseline ratio and expressed as percent of the maximal response observed. Values are presented as mean ± SEM, n = 3.
Fig. 2
Fig. 2
ISOPOOH induces GSH oxidation through a redox relay as reported by roGFP. (A) roGFP-HAEC were treated with a GRX inhibitor 2-AAPA or vehicle for 3 h prior to exposure to 100 μM ISOPOOH at the indicated time. (B) A comparison of 16-HBEs cells expressing roGFP or GRX-roGFP exposed to 100 μM ISOPOOH at the indicated time. (C) roGFP-HAEC were supplemented 1 μM sodium selenite or vehicle for 36 h prior to exposure to 100 μM ISOPOOH. (D) roGFP-HAEC were deprived of glucose for 2 h prior to exposure to 100 μM ISOPOOH followed by the addition of glucose (1 mM final). All fluorescence intensity values were normalized to baseline and/or maximal sensor response. All values are presented as mean ± SEM, n = 3.
Fig. 3
Fig. 3
GSH oxidation induced by ISOPOOH is independent of extracellular H2O2. (A) roGFP-HAEC were exposed to 100 μM H2O2 in the presence of 100 units/mL of extracellular catalase or vehicle alone. (B) roGFP-HAEC exposed to 100 μM ISOPOOH in the presence of 100 units/mL of extracellular catalase or vehicle alone. All fluorescence intensity values were normalized to baseline and maximal sensor response. All values are presented as mean ± SEM, n = 3.
Fig. 4
Fig. 4
GSH oxidation by ISOPOOH is independent of intracellular H2O2. (A) roGFP-HAEC overexpressing intracellular catalase were exposed to 100 μM H2O2 or vehicle alone. (B) roGFP-HAEC overexpressing intracellular catalase were exposed to 100 μM ISOPOOH or vehicle alone. (C) HAEC expressing the sensor HyPer were exposed to 100 μM H2O2 or vehicle alone. (D) HAEC expressing the sensor HyPer were exposed to 100 μM ISOPOOH or vehicle alone. All fluorescence intensity values were normalized to baseline and maximal sensor response. All values are presented as mean ± SEM, n = 3.
Fig. 5
Fig. 5
ISOPOOH-induced GSH oxidation is mediated by GPX4. HAEC expressing roGFP and GPX4 shRNA (GPX4 KD) or a scramble control were exposed to (A) 100 μM H2O2 (C) 100 μM ISOPOOH, or (E) 100 μM t-BOOH. EGSH response to (B) 100 μM H2O2 (D) 100 μM ISOPOOH, or (F) 100 μM t-BOOH expressing GPX4 knockdown were compared to roGFP-HAEC with wildtype GPX4 expression in the same cultures. All fluorescence intensity values were normalized to baseline. All values are presented as mean ± SEM, n = 3.
Fig. 6
Fig. 6
ISOPOOH-induced GSH oxidation is not mediated by PRX6. HAEC expressing roGFP and PRX6 shRNA (PRX6 KD) or a scramble control were exposed to (A) 100 μM H2O2 (C) 100 μM ISOPOOH, or (E) 100 μM t-BOOH. EGSH response to (B) 100 μM H2O2 (D) 100 μM ISOPOOH, or (F) 100 μM t-BOOH expressing PRX6 knockdown were compared to roGFP-HAEC with wildtype PRX6 expression in the same cultures. All fluorescence intensity values were normalized to baseline. All values are presented as mean ± SEM, n = 3.
Fig. 7
Fig. 7
ISOPOOH exposure produces secondary organic oxidative species in HAEC. roGFP-HAEC were exposed to total lipid extracts (TLE) prepared from HAEC exposed to either 100 μM ISOPOOH, 1 mM H2O2, or 0.025% BSA (Vehicle Control) for 40 min. All fluorescence intensity values were normalized to baseline and maximal sensor response. All values are presented as mean ± SEM, n = 3.
Fig. 8
Fig. 8
ISOPOOH exposure produces secondary lipid hydroperoxides in HAEC membranes. HAEC prelabeled with the fluorophore Liperfluo were exposed to either 100 μM t-BOOH (green line), ISOPOOH (red line), H2O2 (blue line), or vehicle (black line) for 35 min after a 5-min baseline. Data shown represent the fluorescence intensity at 510 nm resulting from excitation with 488 nm laser light. All fluorescence intensity values were corrected for baseline fluorescence. All values are presented as mean ± SEM, n = 3. One-sided error bars were used for clarity. (For interpretation of the references to colour in this figure legend, the reader is referred to the Web version of this article.)
Fig. 9
Fig. 9
ISPOOH induces lipid peroxidation in a cell free biomimetic membrane preparation. (A) Representative images of untreated GUVs visualized with Liperfluo (0.1 mol%) (left panel) and GUVs treated with 100 μM H2O2, ISOPOOH, and t-BOOH, respectively (right panel). GUVs were composed of (18:0–22:6) PC/(16:0–20:4) PC/(18:1)2DOPE (33.3/33.3/33.3 mol%). (B) The average fluorescence intensity of individual GUV membranes (left panel), either untreated or treated with 100 μM H2O2, ISOPOOH, and t-BOOH, respectively was determined for each individual vesicle, as well as the average GUV diameter (right panel). Data shwon are average ± SEM from a total of 150–300 vesicles analyzed from n = 2–3 independent experiments. Asterisks indicate significance from untreated vesicles: ***p < 0.001, ****p < 0.0001. Scale bars are 10 μm.
Fig. 10
Fig. 10
Polyunsaturated fatty acids increase HAEC sensitivity to ISOPOOH-induced changes in EGSH. roGFP-HAEC were supplemented with 30 μM PA, EPA, or DHA for 16–18 h prior to exposure to 100 μM ISOPOOH for 5 min. The ratio of 510 nm fluorescence intensity by 488 nm–405 nm excitation was controlled for baseline and positive control (1 mM H2O2 treatment) is shown as the percent of the response in unsupplemented controls. All values are presented as mean ± SEM, n = 3. Asterisks denote significance difference from unsupplemented controls: *, p < 0.05.

References

    1. Shrivastava M., Cappa C.D., Fan J., Goldstein A.H., Guenther A.B., Jimenez J.L., Kuang C., Laskin A., Martin S.T., Ng N.L., Petaja T., Pierce J.R., Rasch P.J., Roldin P., Seinfeld J.H., Shilling J., Smith J.N., Thornton J.A., Volkamer R., Wang J., Worsnop D.R., Zaveri R.A., Zelenyuk A., Zhang Q. Recent advances in understanding secondary organic aerosol: implications for global climate forcing. Rev. Geophys. 2017;55:509–559. doi: 10.1002/2016RG000540. - DOI
    1. Pandis S.N., Harley R.A., Cass G.R., Seinfeld J.H. Secondary organic aerosol formation and transport. Atmos. Environ. Part A, Gen. Top. 1992;26:2269–2282. doi: 10.1016/0960-1686(92)90358-R. - DOI
    1. Guenther A.B., Jiang X., Heald C.L., Sakulyanontvittaya T., Duhl T., Emmons L.K., Wang X. The model of emissions of gases and aerosols from nature version 2.1 (MEGAN2.1): an extended and updated framework for modeling biogenic emissions. Geosci. Model Dev. 2012;5:1471–1492. doi: 10.5194/gmd-5-1471-2012. - DOI
    1. Kiendler-Scharr A., Wildt J., Maso M.D., Hohaus T., Kleist E., Mentel T.F., Tillmann R., Uerlings R., Schurr U., Wahner A. New particle formation in forests inhibited by isoprene emissions. Nature. 2009;461:381–384. doi: 10.1038/nature08292. - DOI - PubMed
    1. Samet J.M., Zeger S.L., Dominici F., Curriero F., Coursac I., Dockery D.W. 2000. The National Morbidity , Mortality , Part II : Morbidity and Mortality from Air Pollution in the United States Final Version Includes a Commentary by the Institute ’ S Health Review Committee. - PubMed

Publication types

LinkOut - more resources