. 2022 Mar 19;12(1):4767.
doi: 10.1038/s41598-022-08657-4.

Relevance of cortisol and copeptin blood concentration changes in an experimental pain model

Affiliations

Relevance of cortisol and copeptin blood concentration changes in an experimental pain model

Claudine A Blum et al. Sci Rep. .

Abstract

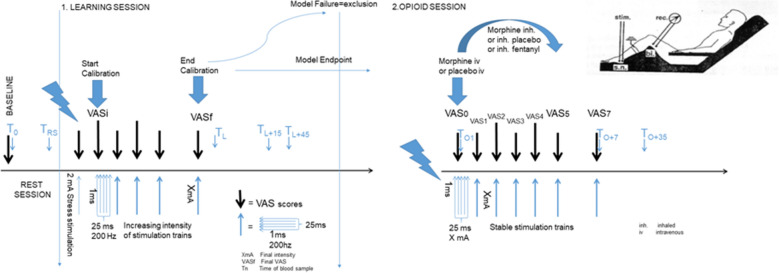
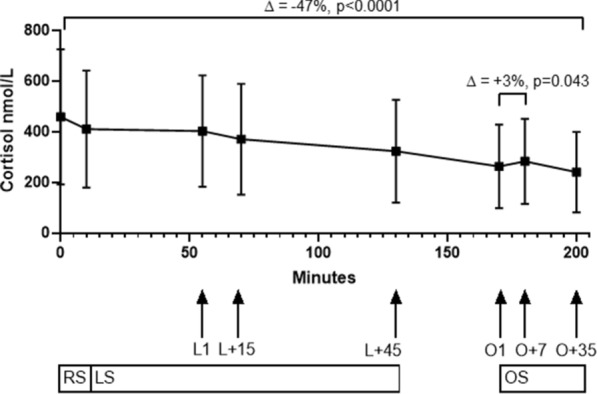
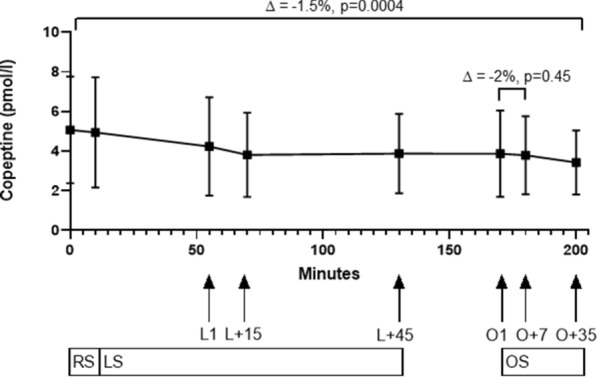
The effect of pain and analgesics on stress biomarkers is not well studied. We evaluated the effect of acute pain and analgesics on serum cortisol and copeptin in an experimental pain model in healthy volunteers. Healthy volunteers presented at 8 a.m. for an experimental pain stimulation. Cortisol and copeptin levels were measured before, during and after electrophysiological stimulation, first before and then during opioid delivery. Difference in biomarker levels compared to baseline levels was calculated, and potential influencing factors were evaluated by linear regression analysis. Cortisol decreased by 13% during the 10 min of rest at baseline, but copeptin did not change significantly. Cortisol had a median decrease of -24% or -83 nmol/l (-44 to -124 nmol/l, p = 0.0002) during the electrophysiological stimulation training session, while the median difference for copeptin was -22% or -1.01 pmol/l (-2.35 to 0.08 pmol/l, p = 0.0003). After administration of opioids, cortisol did not decrease but increased by 3% (p = 0.043), indicating an increasing opioids effect on cortisol. This effect was not visible for copeptin (median change -0.003 pmol/l (-0.50 to 0.24), p = 0.45). In this experimental pain model performed in the morning, moderate pain did not have a relevant effect on cortisol or copeptin levels, whereas opioids led to a discrete peak of cortisol.Clinicaltrials.gov identifier: NCT01975753 (registered on November 5, 2013, before start of recruitment).


Conflict of interest statement

C. A. B. received an unrestricted research grant from Novo Nordisk. ThermoFisher SA, the manufacturer of the copeptin assay, provided the assays for copeptin measurements. PH has received lectures and educational honorarium from ThermoFisher Scientific and bioMérieux unrelated to this study. All other authors have no competing interest linked to the whole trial.

Figures

Figure 1
Figure 1
Experimental pain model setup. Adapted from Willer. VAS visual analog pain scale rating from 0 to 100, 0 meaning no pain and 100 the worst imaginable pain.
Figure 2
Figure 2
Time plot of cortisol during all test sessions. RS resting session. ∆ = −13%, p < 0.0001. LS learning session. ∆ = −24%, p = 0.0002. L1 time point when reaching target pain. L + 15 time point L1 plus 15 min. L + 45 time point L1 plus 45 min. OS opioid session. ∆ = −18%, p = 0.0491. O1 time point of administration of opioids in addition to target pain. O + 7 7 min after O1. O + 35 35 min after O1. Arrows point to the corresponding time points. Boxes and whiskers represent mean and SD. Spearman rank correlation between cortisol levels and VAS scores at the trial endpoint time showed no correlation between VAS scores and cortisol levels (Spearman r −0.42 (95% CI −0.74 to 0.055), p = 0.07).
Figure 3
Figure 3
Time plot of copeptin during all test sessions. RS resting session. ∆ = −0.9%, p = 0.14. LS learning session. ∆ = −22%, p = 0.0003. L1 time point when reaching target pain. L + 15 time point L1 plus 15 min. L + 45 time point L1 plus 45 min. OS opioid session. ∆ = −6%, p = 0.1. O1 time point of administration of opioids in addition to target pain. O + 7 7 min after O1. O + 35 35 min after O1. Arrows point to the corresponding time points. Boxes and whiskers represent mean and SD. Spearman rank correlation between copeptin levels and VAS scores at the trial endpoint time showed no correlation between VAS scores and copeptin levels (Spearman r − 0.26 (95% CI −0.65 to 0.25), p = 0.31).

References

    1. Cordell WH, et al. The high prevalence of pain in emergency medical care. Am. J. Emerg. Med. 2002;20:165–169. doi: 10.1053/ajem.2002.32643. - DOI - PubMed
    1. Stang AS, Hartling L, Fera C, Johnson D, Ali S. Quality indicators for the assessment and management of pain in the emergency department: A systematic review. Pain Res. Manag. 2014;19:e179–190. doi: 10.1155/2014/269140. - DOI - PMC - PubMed
    1. Brennan F, Carr DB, Cousins M. Pain management: A fundamental human right. Anesth. Analg. 2007;105:205–221. doi: 10.1213/01.ane.0000268145.52345.55. - DOI - PubMed
    1. Woolf AD, et al. Musculoskeletal pain in Europe: Its impact and a comparison of population and medical perceptions of treatment in eight European countries. Ann. Rheum Dis. 2004;63:342–347. doi: 10.1136/ard.2003.010223. - DOI - PMC - PubMed
    1. Anand KJ. Pain, plasticity, and premature birth: A prescription for permanent suffering? Nat. Med. 2000;6:971–973. doi: 10.1038/79658. - DOI - PubMed

Publication types

Associated data