. 2022 Jun;13(3):1785-1799.
doi: 10.1002/jcsm.12975. Epub 2022 Mar 20.

Skeletal muscle mitoribosomal defects are linked to low bone mass caused by bone marrow inflammation in male mice

Affiliations

Skeletal muscle mitoribosomal defects are linked to low bone mass caused by bone marrow inflammation in male mice

Jingwen Tian et al. J Cachexia Sarcopenia Muscle. 2022 Jun.

Abstract

Background: Mitochondrial oxidative phosphorylation (OxPhos) is a critical regulator of skeletal muscle mass and function. Although muscle atrophy due to mitochondrial dysfunction is closely associated with bone loss, the biological characteristics of the relationship between muscle and bone remain obscure. We showed that muscle atrophy caused by skeletal muscle-specific CR6-interacting factor 1 knockout (MKO) modulates the bone marrow (BM) inflammatory response, leading to low bone mass.

Methods: MKO mice with lower muscle OxPhos were fed a normal chow or high-fat diet and then evaluated for muscle mass and function, and bone mineral density. Immunophenotyping of BM immune cells was also performed. BM transcriptomic analysis was used to identify key factors regulating bone mass in MKO mice. To determine the effects of BM-derived CXCL12 (C-X-C motif chemokine ligand 12) on regulation of bone homeostasis, a variety of BM niche-resident cells were treated with recombinant CXCL12. Vastus lateralis muscle and BM immune cell samples from 14 patients with hip fracture were investigated to examine the association between muscle function and BM inflammation.

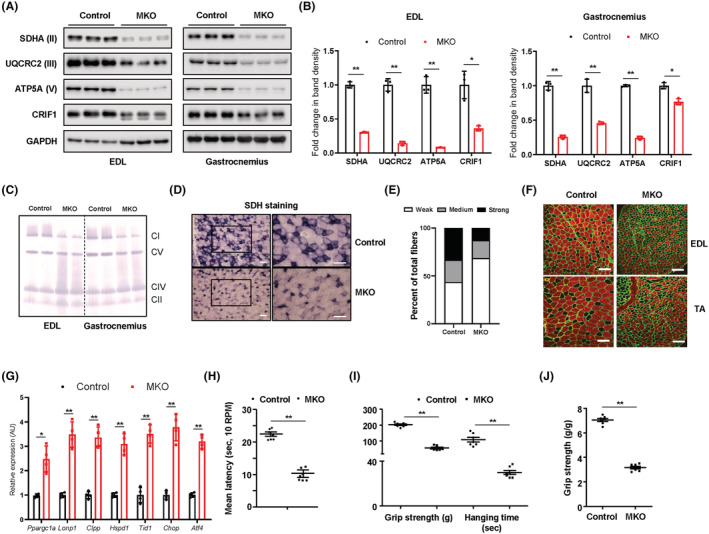
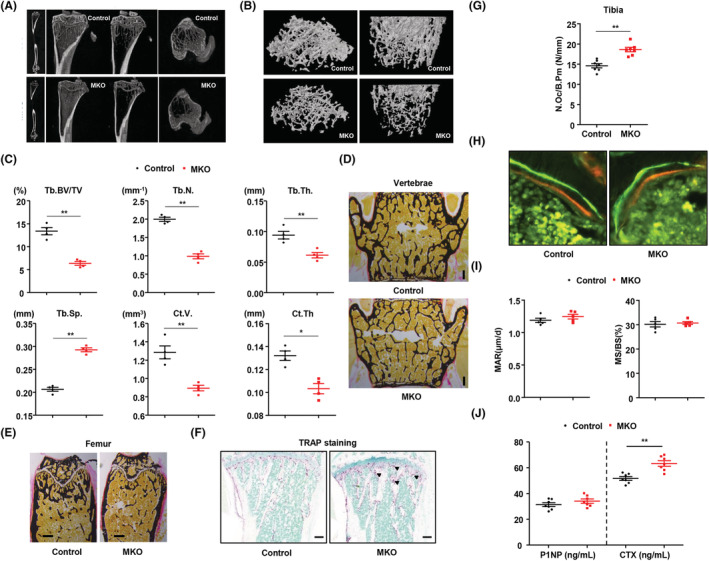
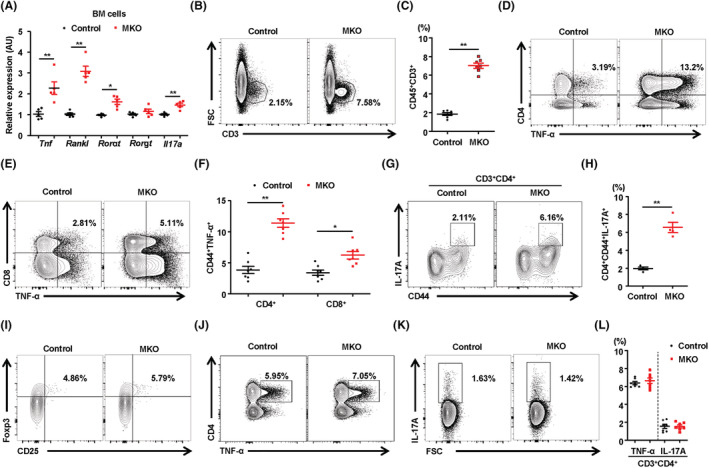
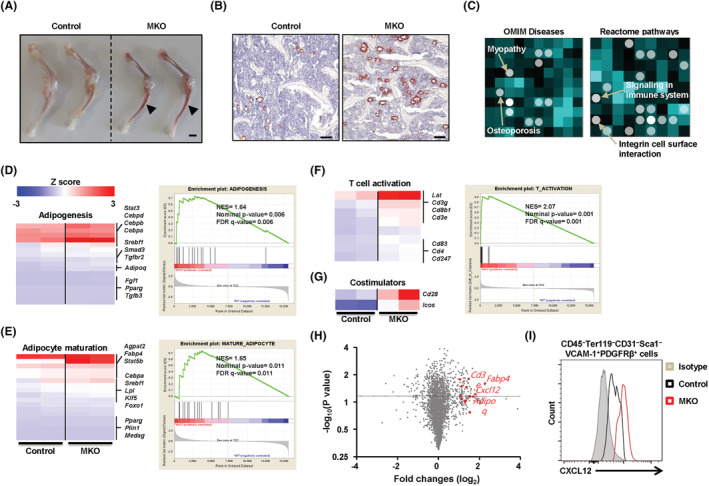
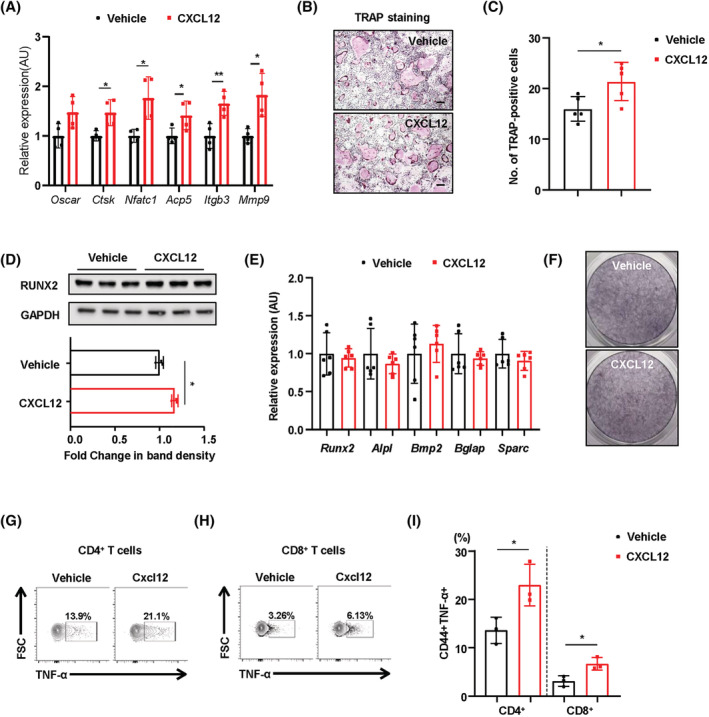
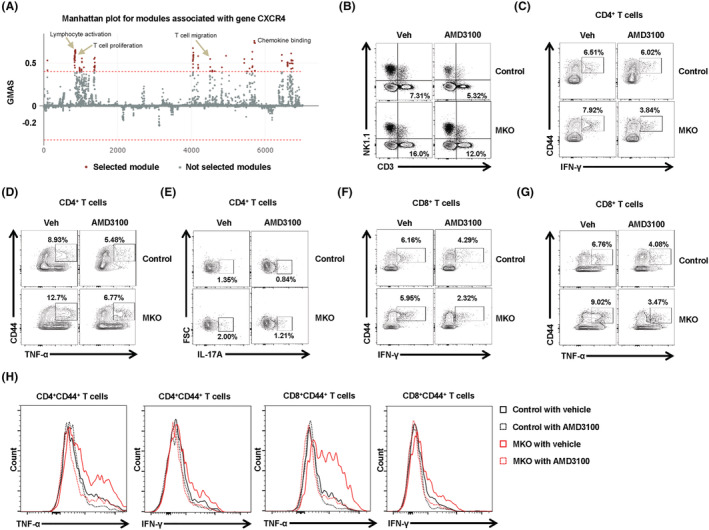
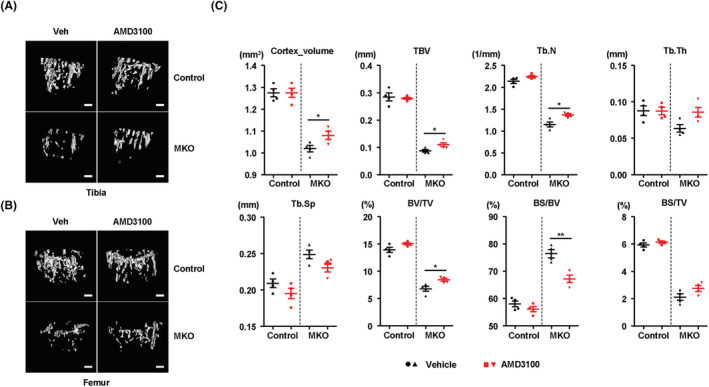
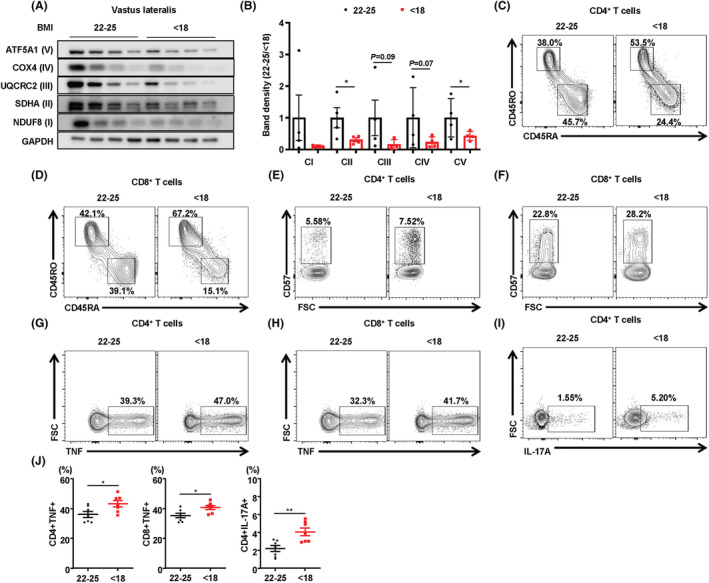
Results: MKO mice exhibited significant reductions in both muscle mass and expression of OxPhos subunits but increased transcription of mitochondrial stress response-related genes in the extensor digitorum longus (P < 0.01). MKO mice showed a decline in grip strength and a higher drop rate in the wire hanging test (P < 0.01). Micro-computed tomography and von Kossa staining revealed that MKO mice developed a low mass phenotype in cortical and trabecular bone (P < 0.01). Transcriptomic analysis of the BM revealed that mitochondrial stress responses in skeletal muscles induce an inflammatory response and adipogenesis in the BM and that the CXCL12-CXCR4 (C-X-C chemokine receptor 4) axis is important for T-cell homing to the BM. Antagonism of CXCR4 attenuated BM inflammation and increased bone mass in MKO mice. In humans, patients with low body mass index (BMI = 17.2 ± 0.42 kg/m2 ) harboured a larger population of proinflammatory and cytotoxic senescent T-cells in the BMI (P < 0.05) and showed reduced expression of OxPhos subunits in the vastus lateralis, compared with controls with a normal BMI (23.7 ± 0.88 kg/m2 ) (P < 0.01).

Conclusions: Defects in muscle mitochondrial OxPhos promote BM inflammation in mice, leading to decreased bone mass. Muscle mitochondrial dysfunction is linked to BM inflammatory cytokine secretion via the CXCL12-CXCR4 signalling axis, which is critical for inducing low bone mass.

Keywords: Bone loss; Bone marrow; Inflammation; Mitochondria.


Conflict of interest statement

The authors declare no competing interests.

Figures

Figure 1
Figure 1
MKO mice show impairment in OxPhos and deterioration in physical performance. (A,B) Representative western blots and band density measurements for OxPhos complex subunits and CRIF1 in the EDL and gastrocnemius of chow‐fed control and MKO mice at 14 weeks of age; n = 3. (C) Representative blots showing BN‐PAGE of the assembled OxPhos complex in EDL and gastrocnemius from chow‐fed control and MKO mice at 14 weeks of age. (D) Transverse EDL sections were stained histochemically for SDH to identify oxidative muscle fibres at 14 weeks of age. Scale bar, 100 μm. (E) Quantification of unstained fibres in the EDL of controls and MKO mice at 14 weeks of age; n = 5. (F) Cross‐sections of the EDL and TA muscle from 10‐week‐old control and MKO mice were subjected to immunohistochemical staining for MyHC2b (red) and laminin (green). Scale bar, 100 μm. (G) Relative expression of mRNA encoding genes related to mitochondrial stress response from EDL in 14‐week‐old control and MKO mice; n = 4. (H) Latency to fall in rotarod test at 0.00336 g; n = 7. (I) Forelimb grip strength and time to fall in the wire hanging assay for control and MKO mice; n = 10. (J) Grip strength normalized to the body weight of control and MKO mice; n = 10. Data are expressed as the mean ± standard error of the mean. Statistical significance was analysed by unpaired t‐tests. *, P < 0.05 and **, P < 0.01 compared with the indicated group.
Figure 2
Figure 2
Mitochondrial stress response in skeletal muscle promotes lower bone mass compared with wild‐type control. (A,B) Representative images of micro‐CT of cortical and trabecular regions in the distal femur from control and MKO mice at 14 weeks of age. (C) Measurement of Tb.Th., trabecular number (Tb.N.), BV/TV, BS/TV, BS/BV, cortical volume (Ct.V.), Tb.Sp., and total bone volume (TBV) using micro‐CT analysis. (D,E) Von Kossa staining of undecalcified sections of vertebrae and femurs of control and MKO mice at 14 weeks of age. Scale bars, 250 μm. (F) TRAP staining to reveal osteoclasts. Scale bars: 100 μm. (G) The number of osteoclasts per bone perimeter [N.Oc/B.Pm (N/mm)] is indicated. (H) Histomorphometric analysis of calcein/alizarin red double‐stained sections was conducted to quantify bone formation in vertebrae; n = 5 per group. Green indicates calcein, and red indicates alizarin red. (I) Measurement of endocortical MAR and MS/BS (%) of vertebrae in control and MKO mice. (J) Serum levels of P1NP and CTX in 14‐week‐old control and MKO mice; n = 7. Data are expressed as the mean ± standard error of the mean. Statistical significance was analysed by unpaired t‐tests. *, P < 0.05 and **, P < 0.01 compared with the indicated group.
Figure 3
Figure 3
MKO mice exhibit local induction of TNF‐α and IL‐17 in BM without a systemic inflammatory response. (A) BM cells isolated from control and MKO mice at 14 weeks of age were subjected to real‐time PCR analysis of osteoclastogenic genes; n = 5. (B) Representative flow cytometry contour plots are presented for CD3 expression by BM cells in control and MKO mice at 14 weeks of age; n = 7. (C) Statistical analysis of the population of CD3+ T‐cells in BM cells in the two groups. (D–H) The number of TNF‐α‐secreting or IL‐17A‐secreting cells in the populations of BM CD4+CD44+ and CD8+C44+ T‐cells was compared between the two groups; n = 7. (I) Population of regulatory T‐cells (CD4+CD25+FOXP3+) in the BM of 14‐week‐old control and MKO mice; n = 7. (J–L) TNF‐α‐producing or IL‐17A‐producing cells among CD4+ and CD8+ T‐cells from the spleens of control and MKO mice at 14 weeks of age; n = 7. Data are expressed as the mean ± standard error of the mean. Statistical significance was analysed by unpaired t‐tests. *, P < 0.05 and **, P < 0.01 compared with the indicated group.
Figure 4
Figure 4
Transcriptome analysis shows adipogenesis and inflammatory response in the BM of MKO mice. (A) Femur and tibia of a 14‐week‐old control and MKO mouse. BM is more visible through the thin cortical bone of MKO mice. (B) A transverse section of femur from a 14‐week‐old control and MKO mouse stained with Oil Red O. Adipocyte‐rich BM (arrowhead) are visible in the MKO femur. (C) Using RNA sequencing data, genes that were significantly up‐regulated in the BM cells of control and MKO mice were analysed for gene‐list enrichment with gene set libraries created from Level 4 of the MGI mouse phenotype ontology using Network2Canvas. (D–G) The diagram shows the results of gene set (adipogenesis, adipocyte maturation, T‐cell activation, and co‐stimulators) enrichment analysis, including the enrichment scores. (H) Volcano plot based on the differential expression and significance of the differences in the data from RNA sequencing of BM cells of control and MKO mice at 14 weeks of age. Red dots represent genes associated with adipogenesis and T‐cell activation with a P‐value < 0.05 and a fold change > 1 log2. (I) In the flow cytometry analysis, total BM cells were gated on a population negative for CD45, Ter119, CD31, and Sca1 and positive for VCAM and PDGFRβ, the phenotype of CXCL12‐abundant reticular cells. Intracellular levels of CXCL12 are shown as amount of protein in CAR cells in the BM of MKO mice relative to CAR cells in the BM of the controls at 14 weeks of age, n = 4 mice/genotype. Scale bars: 2 mm (A) and 100 μm (B).
Figure 5
Figure 5
Treatment with recombinant CXCL12 increases activation of osteoclasts and promotes production of TNF‐α by BM T‐cells in vitro. (A) Transcript levels of osteoclast‐specific genes in differentiated osteoclasts treated with or without recombinant CXCL12 (5 ng/mL). (B) TRAP staining of osteoclasts. Scale bars: 100 μm. (C) The number of TRAP‐positive multinucleated cells was counted. (D) Representative western blots and band density of RUNX2 in MC3T3‐E1 cells treated with or without recombinant CXCL12 (5 ng/mL). (E, F) MC3T3‐E1 cells treated with or without recombinant CXCL12 (5 ng/mL) were subjected to real‐time PCR analysis of genes related to osteoblastogenesis. Cells were also stained for alkaline phosphatase activity. (G–I) TNF‐α‐producing cells within the BM CD4+ and CD8+ T‐cell populations treated with or without recombinant CXCL12 (5 ng/mL). Data are expressed as the mean ± standard error of the mean. Statistical significance was analysed by unpaired t‐tests. *, P < 0.05 and **, P < 0.01 compared with the indicated group.
Figure 6
Figure 6
Treatment with CXCR4 antagonist reduces BM inflammation in MKO mice. (A) G‐MAD analysis shows that CXCR4 is associated with T‐cell migration and proliferation, and with chemokine‐binding modules, in mice. The threshold of significant gene‐module association is indicated by the red dashed line. Modules are organized by module similarities. Known modules connected to CXCR4 are highlighted in red. GMAS, gene‐module association score. (B) BM cells were subjected to flow cytometry for mature T‐cells, natural killer, and natural killer T‐cell phenotypes. (C,D) Populations of BM CD44+IFN‐γ+ or CD44+TNF‐α+ among CD4+ T‐cells from control and MKO mice treated with AMD3100 or vehicle at 14 weeks of age. (E) IL‐17A production by BM CD4+ T‐cells was analysed by flow cytometry. (F,G) Populations of BM CD44+IFN‐γ+ or CD44+TNF‐α+ among CD8+ T‐cells from control and MKO mice treated with AMD3100 or vehicle at 14 weeks of age. (H) Production of IFN‐γ or TNF‐α by BM CD4+CD44+ or CD8+CD44+ T‐cells of control and MKO mice treated with AMD3100 or vehicle at 14 weeks of age. Data are expressed as the mean ± standard error of the mean. Statistical significance was analysed by one‐way ANOVA.
Figure 7
Figure 7
Treatment with AMD3100 attenuates bone loss in MKO mice. (A,B) At 9 weeks of age, control and MKO mice were injected intraperitoneally with AMD3100 (5 mg/kg, three times per week) for 3 weeks. Tibial and femoral trabeculae of control and MKO mice were measured by micro‐CT. Scale bars, 250 μm. (C) Measurement of Tb.N., Tb.Th., BV/TV, BS/TV, BS/BV, Ct.V., Tb.Sp., and TBV in the tibiae from control and MKO mice using micro‐CT analysis. Data are expressed as the mean ± standard error of the mean. Statistical significance was analysed by one‐way ANOVA. *, P < 0.05 and **, P < 0.01 compared with the indicated group. DW, distilled water.
Figure 8
Figure 8
Immunophenotyping of BM T‐cells in patients with hip fracture according to BMI. (A) Representative western blots of OxPhos complex subunits in the vastus lateralis muscle of patients with a normal (22–25 kg/m2) or low (<18 kg/m2) BMI. (B) Band density measurement of OxPhos complex subunits in vastus lateralis muscle from the patients with low or normal BMI. (C, D) Representative flow cytometry contour plots are presented for CD4 and CD8 expression by CD3+ T‐cells in hip fracture patients with normal (22–25 kg/m2) and low (<18 kg/m2) BMI. Representative plots of CD45RO and CD45RA expression among CD4+ or CD8+ T‐cells in the BM from hip fracture patients with a low (<18 kg/m2) or normal (22–25 kg/m2) BMI (each n = 7). (E,F) CD57+ senescent population in CD4+ and CD8+ T‐cells of the BM from hip fracture patients with a low (<18) or normal (22–25) BMI, each n = 7. (G–I) Frequency of TNF‐α‐producing or IL‐17A‐producing cells among the BM CD4+ and CD8+ cells were evaluated by flow cytometry, each n = 7. (J) Statistical analysis of the population of TNF‐α‐producing or IL‐17A‐producing cells among the BM CD4+ and CD8+ cell populations in the two groups, n = 7 per group. Data are expressed as the mean ± standard error of the mean. Statistical significance was analysed by unpaired t‐tests. *, P < 0.05 and **, P < 0.01 compared with the indicated group.

References

    1. Romanello V, Sandri M. Mitochondrial quality control and muscle mass maintenance. Front Physiol 2015;6:422. - PMC - PubMed
    1. Giresi PG, Stevenson EJ, Theilhaber J, Koncarevic A, Parkington J, Fielding RA, et al. Identification of a molecular signature of sarcopenia. Physiol Genomics 2005;21:253–263. - PubMed
    1. Johannsen DL, Conley KE, Bajpeyi S, Punyanitya M, Gallagher D, Zhang Z, et al. Ectopic lipid accumulation and reduced glucose tolerance in elderly adults are accompanied by altered skeletal muscle mitochondrial activity. J Clin Endocrinol Metab 2012;97:242–250. - PMC - PubMed
    1. Verschueren S, Gielen E, O'Neill TW, Pye SR, Adams JE, Ward KA, et al. Sarcopenia and its relationship with bone mineral density in middle‐aged and elderly European men. Osteoporos Int 2013;24:87–98. - PubMed
    1. Trifunovic A, Wredenberg A, Falkenberg M, Spelbrink JN, Rovio AT, Bruder CE, et al. Premature ageing in mice expressing defective mitochondrial DNA polymerase. Nature 2004;429:417–423. - PubMed

Publication types