. 2022 Apr 27;7(2):e0003322.
doi: 10.1128/msphere.00033-22. Epub 2022 Mar 21.

Machine Learning of All Mycobacterium tuberculosis H37Rv RNA-seq Data Reveals a Structured Interplay between Metabolism, Stress Response, and Infection

Affiliations

Machine Learning of All Mycobacterium tuberculosis H37Rv RNA-seq Data Reveals a Structured Interplay between Metabolism, Stress Response, and Infection

Reo Yoo et al. mSphere. .

Abstract

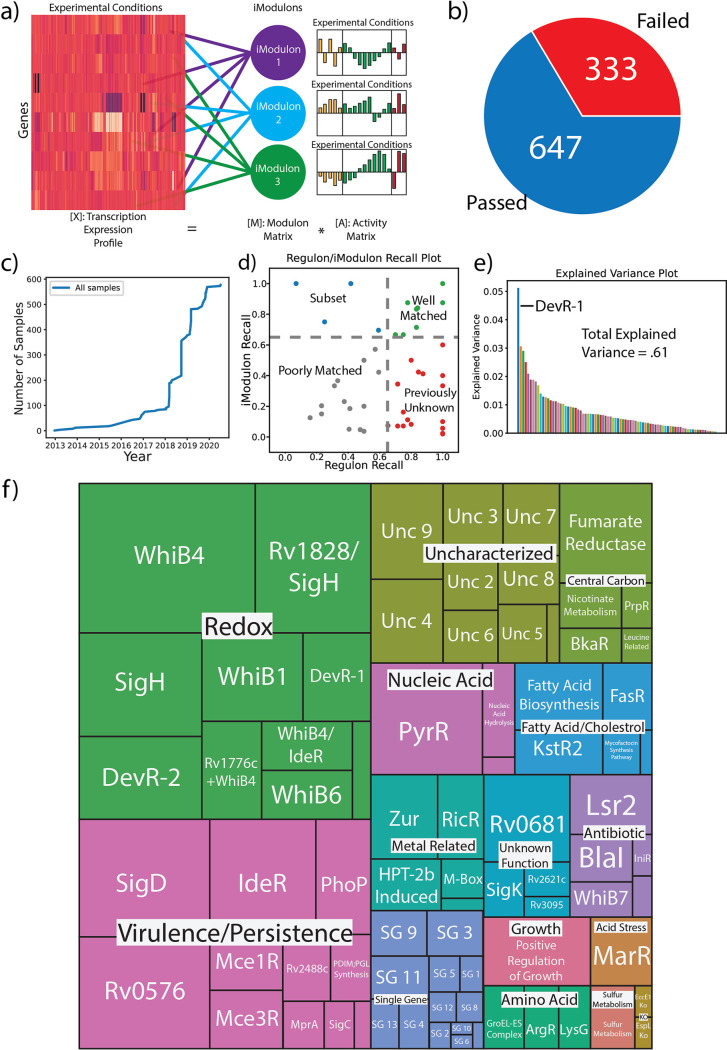
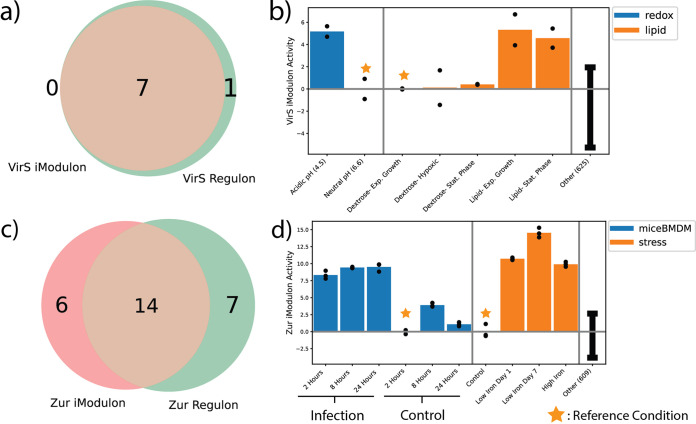
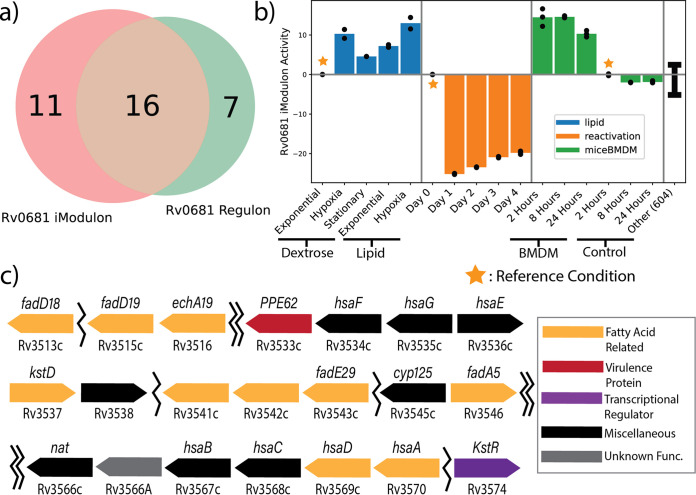
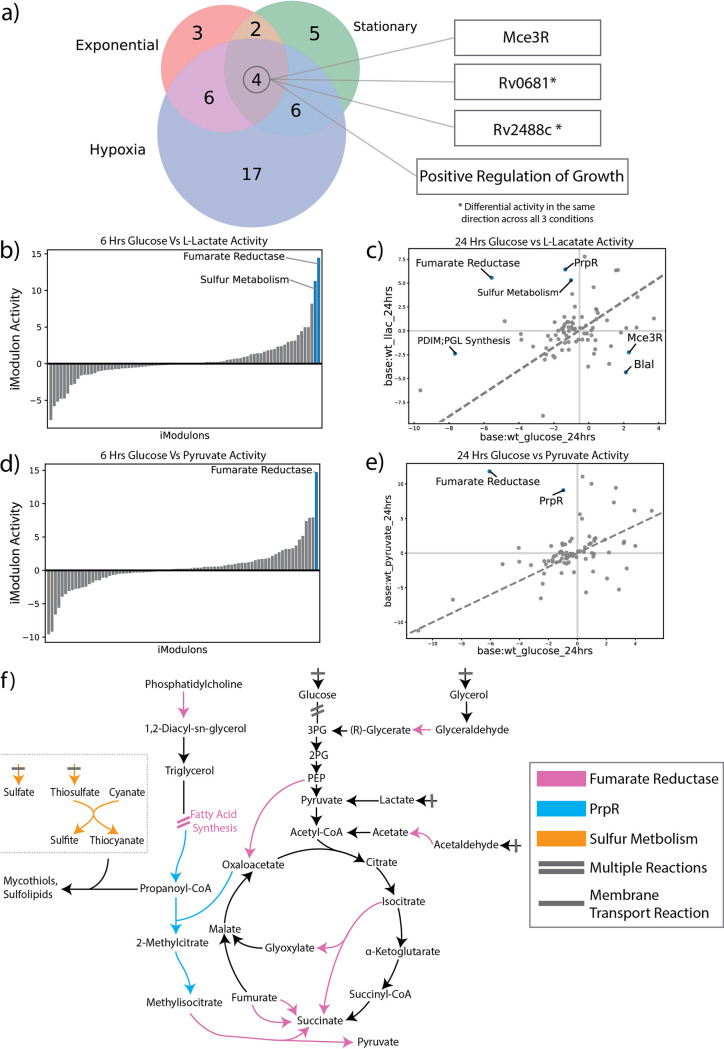
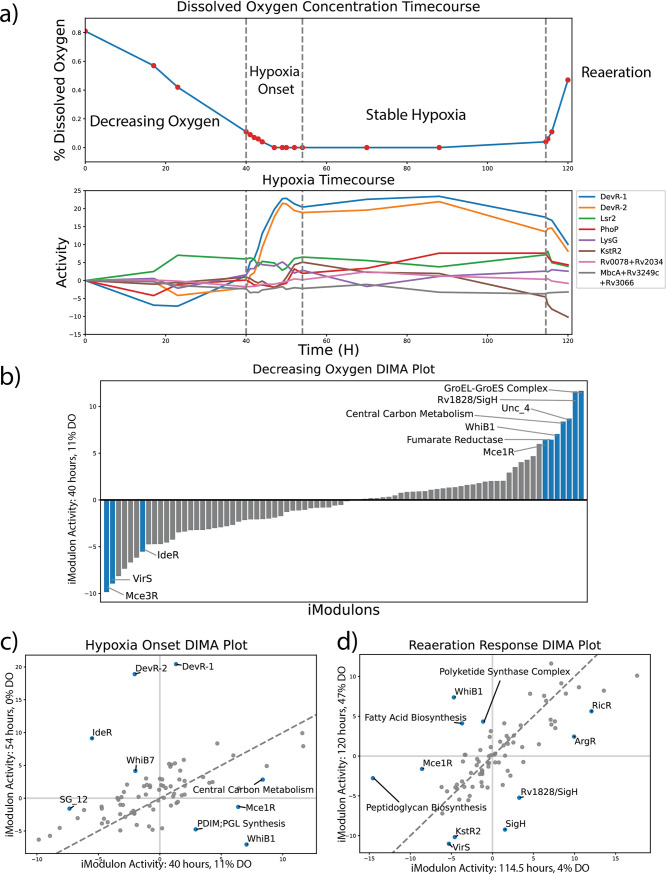
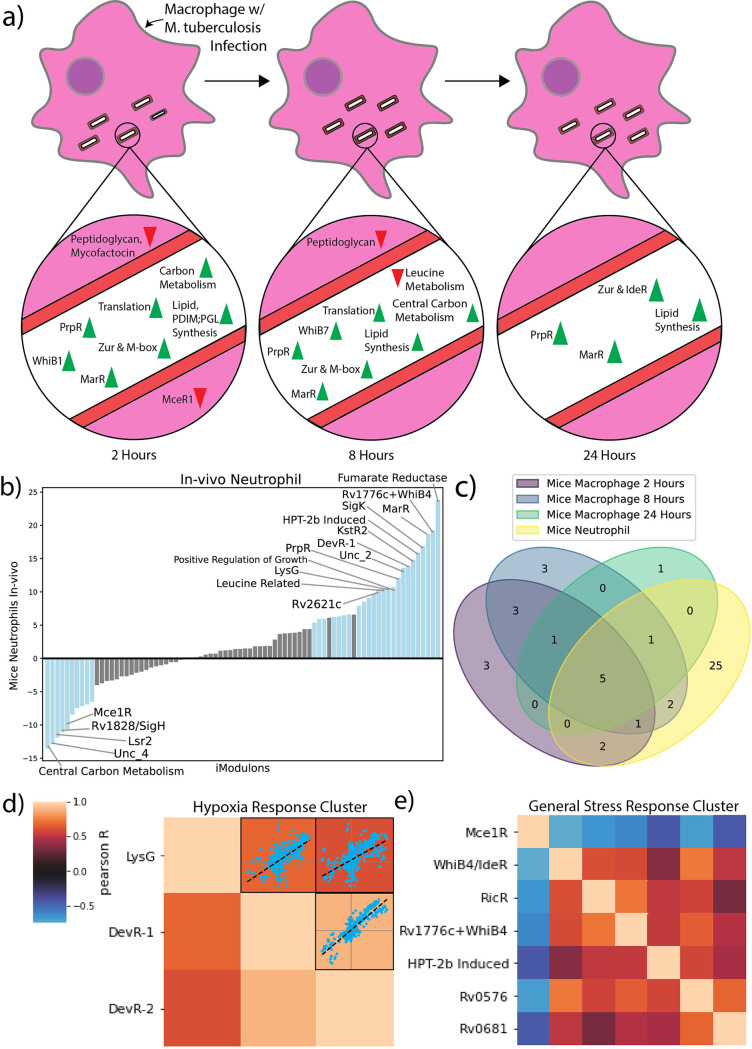
Mycobacterium tuberculosis is one of the most consequential human bacterial pathogens, posing a serious challenge to 21st century medicine. A key feature of its pathogenicity is its ability to adapt its transcriptional response to environmental stresses through its transcriptional regulatory network (TRN). While many studies have sought to characterize specific portions of the M. tuberculosis TRN, and some studies have performed system-level analysis, few have been able to provide a network-based model of the TRN that also provides the relative shifts in transcriptional regulator activity triggered by changing environments. Here, we compiled a compendium of nearly 650 publicly available, high quality M. tuberculosis RNA-sequencing data sets and applied an unsupervised machine learning method to obtain a quantitative, top-down TRN. It consists of 80 independently modulated gene sets known as "iModulons," 41 of which correspond to known regulons. These iModulons explain 61% of the variance in the organism's transcriptional response. We show that iModulons (i) reveal the function of poorly characterized regulons, (ii) describe the transcriptional shifts that occur during environmental changes such as shifting carbon sources, oxidative stress, and infection events, and (iii) identify intrinsic clusters of regulons that link several important metabolic systems, including lipid, cholesterol, and sulfur metabolism. This transcriptome-wide analysis of the M. tuberculosis TRN informs future research on effective ways to study and manipulate its transcriptional regulation and presents a knowledge-enhanced database of all published high-quality RNA-seq data for this organism to date. IMPORTANCE Mycobacterium tuberculosis H37Rv is one of the world's most impactful pathogens, and a large part of the success of the organism relies on the differential expression of its genes to adapt to its environment. The expression of the organism's genes is driven primarily by its transcriptional regulatory network, and most research on the TRN focuses on identifying and quantifying clusters of coregulated genes known as regulons. While previous studies have relied on molecular measurements, in the manuscript we utilized an alternative technique that performs machine learning to a large data set of transcriptomic data. This approach is less reliant on hypotheses about the role of specific regulatory systems and allows for the discovery of new biological findings for already collected data. A better understanding of the structure of the M. tuberculosis TRN will have important implications in the design of improved therapeutic approaches.

Keywords: Mycobacterium tuberculosis; gene regulation; independent component analysis; machine learning; transcriptomics.


Conflict of interest statement

The authors declare no conflict of interest.

Figures

FIG 1
FIG 1
QC/QA, ICA Decomposition, and iModulon Characterization of M. tuberculosis RNA-seq Data from Sequence Read Archive. (A) iModulons are clusters of genes computed by decomposing RNA-Seq data into independently modulated sets (9). (B) Percentage of samples with metadata that passed and failed the QC/QA process. The RNA-seq data and associated metadata from 980 H37Rv SRA samples were processed, and 647 samples passed all QC/QA metrics. (C) A timeline of the number of high quality samples (samples that passed QC/QA) used in this study added to the Sequence Read Archive. (D) Scatterplot comparing the Regulon Recall to the iModulon Recall. iModulon Recall is defined as the number of shared genes divided by all genes in the iModulon, while Regulon Recall is defined as the number of shared genes divided by all the genes found in the regulon. iModulons in green are considered well matched, those in red contain mostly uncharacterized genes, those in blue are considered to be subsets of the regulon (i.e regulons can have multiple iModulons showing the dynamic dimensionality of the regulon), and those in gray only have a slight match. (E) Plot detailing how much explained variance is captured by each iModulon. Most iModulons capture relatively small amounts of explained variance, with the DevR-1 capturing the most variance in M. tuberculosis. (F) A treemap that organizes the iModulons by category. The size of each iModulon box corresponds with how many genes were found within that iModulon.
FIG 2
FIG 2
iModulons Capture Activity of Known Transcriptional Regulators Zur and Lsr2. (A) Venn diagram showing the genes that overlap between the established Zur regulon and the calculated iModulon. (B) Bar plot representing the activity of the Zur iModulon across infection, high iron, and low iron conditions. In general, iModulon activity corresponds with expression of the genes within that iModulon, with positive activity representing increased expression. (C) Venn diagram showing the genes that overlap between the established Lsr2 regulon and the calculated iModulon. (D) Bar plot representing the activity of the Lsr2 iModulon across three different infection conditions (THP-1 macrophages, mice bone marrow derived macrophages (miceBMDM), and mice neutrophils (miceNF)). For activity bar plots, error bars represent mean and standard deviation of all other samples, black dots represent the activity of each replicate for a condition, and vertical gray bars separate the samples into projects. Each project is normalized to a reference condition within that project such that the reference condition represents zero activity.
FIG 3
FIG 3
Functional Characterization of Rv0681 and involvement in lipid metabolism. (A) Venn diagram displaying the genes that overlap between the predicted Rv0681 regulon and the calculated Rv0681 iModulon. (B) Barplot displaying the activities of the Rv0681 iModulon across lipid, hypoxic reactivation, and infection conditions. (C) A diagram that characterizes the position and function of the genes found in the Rv0681 iModulons. Many of these genes are related to fatty acids and cholesterol, including the KstR transcription factor (27, 79, 80). Single jagged lines indicate a small skip between two iModulon genes (less than 10 genes), while double jagged lines indicate larger skips.
FIG 4
FIG 4
iModulons Illuminate Metabolic Shifts from Changes in Carbon Source. (A) A three-way venn displaying the differentially activated iModulons between dextrose and lipid conditions across three metabolic states (exponential, stationary, and hypoxia). The iModulons that were differentially activated across all three states represent the core lipid response. (B) A 1D DIMA plot representing the differentially activated iModulons at 6 h between L-lactate and glucose conditions. (C) DIMA plot representing the differentially activated iModulons at 24 h between L-lactate and glucose conditions. (D) A 1D DIMA plot representing the differentially activated iModulons at 6 h between pyruvate and glucose conditions. (E) DIMA plot representing the differentially activated iModulons at 24 h between pyruvate and glucose conditions. (F) A metabolic map representing the reactions controlled by differentially activated iModulons across carbon source shifts. Arrows represent reactions between metabolites, and reactions with bars represent transport from the environment. Map displays how reactions controlled by the significant iModulons are connected to one another, and in conjunction with DIMA plots can describe potential changes in metabolite flux. For example, the Fumarate Reductase iModulon is differentially upregulated across all time points and carbon sources, which would tend to increase the amount of enzyme present and ultimately catalyze higher flux through the pink pathways (in the absence of protein and metabolite-level regulation, which cannot be studied with our data).
FIG 5
FIG 5
iModulons help Categorize the Phases of Hypoxia Response, including Metabolic Anticipation. (A) Time Course of M. tuberculosis undergoing Decreasing Oxygen, Hypoxia Onset, and Reaeration. The top plot displays the dissolved oxygen concentration in the environment, and the bottom plot displays the activities over time for iModulons controlled by TFs previously identified to be highly involved in hypoxic response (2). The TF Rv2034 is represented by the iModulon Rv0078+Rv2034 and Rv3249c is represented by MbcA+Rv3249c+Rv3066 iModulons. (B) DIMA plots of hypoxia phases were created by comparing the iModulon activities between the first and last time point of each phase. The bar graph represents a 1D DIMA plot for the decreasing oxygen phase, since the original t = 0 time point served as the reference condition. (C) DIMA plot for the Hypoxia Onset Phase. (D) DIMA plot for the Reaeration phase.
FIG 6
FIG 6
iModulon Response to Infection of Mice Macrophages and Neutrophils and Pearson R iModulon Clusters. (A) A time course of the iModulon activities during infection of mice BMDM. The iModulons with differential activities at each time point are displayed as upregulated (green) or downregulated (red). Peptidoglycan, Mycofactocin, and MceR1 are displayed outside the cell to indicate regulation of secretory pathways. (B) 1D DIMA plot of differential iModulons between control noninfectious condition and in vivo infection condition. Surprisingly, the most upregulated and most downregulated iModulons both regulate different portions of central carbon metabolism, which suggests that central carbon metabolism plays a large role in infection. (D) A core infection response was constructed by examining the iModulons with differential activity across all infection conditions (3 time points in mice macrophage infection and 1 neutrophil condition). The core infection response was found to consist of KstR2, MarR, PrpR, Rv0681, Uncharacterized 2, and Zur. (D) Hypoxia Response iModulon cluster calculated using Pearson R score and agglomerative clustering. Scatterplots that provide pairwise comparison of the activities of the iModulons across all experimental conditions is provided to indicate the relatively high correlation between these three iMoudlons. Color bar indicates pairwise Pearson R score. (E) General Stress Response iModulon cluster calculated from Pearson R score and agglomerative clustering.

Similar articles

Cited by

References

    1. World Health Organization. GLOBAL TUBERCULOSIS REPORT 2020. 2020. Available: https://www.who.int/news-room/fact-sheets/detail/tuberculosis.
    1. Galagan JE, Minch K, Peterson M, Lyubetskaya A, Azizi E, Sweet L, Gomes A, Rustad T, Dolganov G, Glotova I, Abeel T, Mahwinney C, Kennedy AD, Allard R, Brabant W, Krueger A, Jaini S, Honda B, Yu W-H, Hickey MJ, Zucker J, Garay C, Weiner B, Sisk P, Stolte C, Winkler JK, Van de Peer Y, Iazzetti P, Camacho D, Dreyfuss J, Liu Y, Dorhoi A, Mollenkopf H-J, Drogaris P, Lamontagne J, Zhou Y, Piquenot J, Park ST, Raman S, Kaufmann SHE, Mohney RP, Chelsky D, Moody DB, Sherman DR, Schoolnik GK. 2013. The Mycobacterium tuberculosis regulatory network and hypoxia. Nature 499:178–183. doi:10.1038/nature12337. - DOI - PMC - PubMed
    1. Ehrt S, Schnappinger D. 2007. Mycobacterium tuberculosis virulence: lipids inside and out. Nat Med 13:284–285. doi:10.1038/nm0307-284. - DOI - PubMed
    1. Turkarslan S, Peterson EJR, Rustad TR, Minch KJ, Reiss DJ, Morrison R, Ma S, Price ND, Sherman DR, Baliga NS. 2015. A comprehensive map of genome-wide gene regulation in Mycobacterium tuberculosis. Sci Data 2:150010. doi:10.1038/sdata.2015.10. - DOI - PMC - PubMed
    1. Larsen SJ, Röttger R, Schmidt HHHW, Baumbach JE. 2019. E. coli gene regulatory networks are inconsistent with gene expression data. Nucleic Acids Res 47:85–92. doi:10.1093/nar/gky1176. - DOI - PMC - PubMed

Publication types