Review
. 2022 May;52(3):382-402.
doi: 10.1053/j.semnuclmed.2022.02.002. Epub 2022 Mar 18.

Advances in Preclinical PET

Affiliations
Review

Advances in Preclinical PET

Stephen S Adler et al. Semin Nucl Med. 2022 May.

Abstract

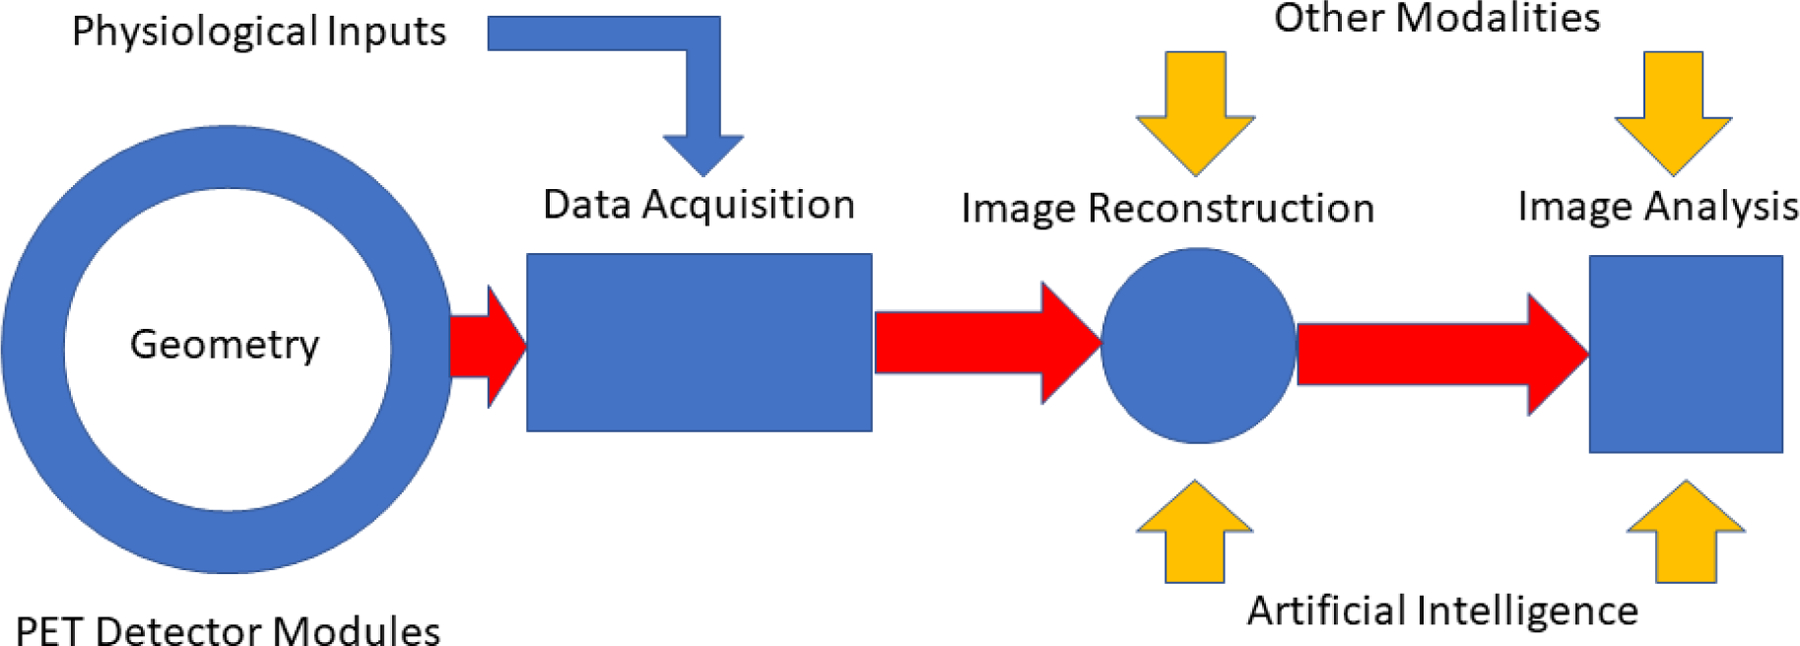
The classical intent of PET imaging is to obtain the most accurate estimate of the amount of positron-emitting radiotracer in the smallest possible volume element located anywhere in the imaging subject at any time using the least amount of radioactivity. Reaching this goal, however, is confounded by an enormous array of interlinked technical issues that limit imaging system performance. As a result, advances in PET, human or animal, are the result of cumulative innovations across each of the component elements of PET, from data acquisition to image analysis. In the report that follows, we trace several of these advances across the imaging process with a focus on small animal PET.


Conflict of interest statement

Declaration of interests The authors declare that they have no known competing financial interests or personal relationships that could have appeared to influence the work reported in this paper

Figures

Figure 1.
Figure 1.
Schematic illustration of an idealized small animal PET imaging system. Relatively low temporal resolution physiological inputs include chest cuff pressure signals, ECG-R wave markers and stimulus gating signals. Compact, high density digital PET detector modules surrounding the full length of the imaging subject provide high temporal resolution LIST mode input of spatial, timing and energy signals from time coincident gamma ray events in the detector array. During image reconstruction these signals are transformed into PET images corrected for a host of confounding effects, e.g., attenuation, scatter, positron range, using physical models of these processes and, more recently, by artificial intelligence methods that achieve some of these same ends. Combination of these images with those from other modalities acquired serially or simultaneously provide complementary information about target structure and function.
Figure 2.
Figure 2.
Maximum intensity whole body human 18F-DCFPyL (left), rat (middle) and mouse (right) 18F albumin PET images displayed at the same physical size. Rat body weights are typically several hundred times smaller and mice several thousand times smaller than the body weight of an adult human. The human scanner has a spatial resolution of approximately 3 mm, the animal scanner approximately 1 mm. The rat and mouse images appear progressively “blurrier” than the human image in part because of poorer spatial sampling density. This effect is somewhat exaggerated here because of the differing body distributions of the two agents.
Figure 3.
Figure 3.
Spatial resolution of a small animal PET scanner needed to produce an image with the same sampling density as a human PET scanner with 3 mm spatial resolution imaging an adult human subject. Red line at 1 mm locates a typical resolution value for contemporary small animal scanners, 0.7 mm, a line that locates an estimate of the best possible physical spatial resolution, and a line at 0.2 mm that locates the resolution needed to image a mouse with human sampling density. Adult animal weights vary widely by age, sex and subtype for each specie and are included here only as a guide. rhe: rhesus macaque monkey; cyn: cynomolgus monkey.
Figure 4.
Figure 4.
Cross sectional side view PET images (left column) of a capped, plastic container with a droplet of 18F in water at the (slightly conical) bottom and the corresponding CT images of the container (right column). The only difference between the images in the upper and lower rows is that a thin layer of non-radioactive oil has been spread over the droplet in the lower row. Without the oil, the plastic walls and cap of the container absorb positrons emitted from the surface of the droplet that pass through the air and annihilate in the walls and cap producing the PET image at the upper left. When the droplet is covered by oil, the positrons emitted from the droplet surface annihilate within the oil and very few escape to reach the walls and cap thereby rendering these structures invisible in the PET image (lower left).
Figure 5.
Figure 5.
Illustration of the effects of non-colinear annihilation (A) and attenuation/scatter (B) in two PET scanners with different bore diameters. B: annihilation site; LORN: erroneous line-of-response for a non-colinear annihilation; LOR: correct line-of-response for a colinear annihilation; S: location of a 511 keV scattering event; LORS: erroneous line-of-response for a scatter event; A: without correction, spatially varying attenuation of either gamma ray will distort the true activity distribution in the reconstructed image of the object. Because of the very large mass difference, scatter and attenuation are much reduced in rodents compared to adult human subjects but are not ignorable. While attenuation for a single mouse plus bed is generally negligible, multiple mice and rats require attenuation correction. The frequency of scattered events within rodents is much smaller than in adult humans but detection of scattered events is higher in large solid angle machines, e.g., small bore diameter, long axial field-of-view small animal scanners, that also require correction.
Figure 6.
Figure 6.
Lines-of-response joining a crystal pair at opposite ends of a ring diameter (A), a crystal pair off the scanner axis (B), and a crystal pair off the scanner axis but with depth-of-interaction readout of scintillation light collected for each event by individual solid state photosensors at each end (C, see text). APD: avalanche photodiode; SiPM: silicon photomultiplier; (C): dotted parallel lines: maximum constraints on LOR choices measured by Ui; Li: length of LOR between interaction sites; xi: distance between annihilation site and LOR midpoint; ti: time of arrival of photon; Ei: energy deposited by photon; Mi: ID number of crystal in detector array.
Figure 7.
Figure 7.
Spatial resolution vs. bore diameter for an “ideal” small animal PET scanner for several different crystal widths imaging 18F. Even a scanner with zero width crystals (and zero sensitivity) cannot physically achieve the 0.2 mm resolution needed to image mice with human equivalent sampling density. It can be argued that, for practical reasons, an ideal rodent scanner should have a ring diameter of about 150 mm yielding an ideal resolution of about 0.65 mm with d = 0.5 mm. Gray region spans the bore range of contemporary small animal PET scanners.
Figure 8.
Figure 8.
Effective spatial resolution (RE) when the object being imaged is moving relative to the scanner for two different scanner resolutions (assuming a Gaussian-like displacement histogram). When the movement histogram width (FWHM) exceeds about twice the scanner resolution, effective image resolution is set by motion and not by the scanner.
Figure 9.
Figure 9.
A: Example of multi-mouse PET imaging. B: Upper panel: “step and shoot” small animal PET scanner; lower panel: total-body small animal PET scanner. A = length of axial field of view of step and shoot (SAS) machine, N = number of bed positions needed to image the length L when the coincidence acceptance angle (small arrow in scanner bore) and injected activity are the same for both machines. If L= 3A, for example, N = 7 for the SAS machine and the total body machine will acquire 7 times more events from every voxel in the object compared to the SAS machine for equal total imaging times.
Figure 10.:
Figure 10.:
A: A Lab PETII detector module showing one-to-one coupling between crystals and individual APDs and between APD arrays and ASIC processors. This arrangement allows independent readout and processing of signals from 128 crystals in each of the 12 detector modules. B: RatCAP APD/ASIC-based PET detector ring. C: wearable rat brain PET scanner. Fig A: Adapted with permission from “Firmware architecture of the data acquisition system for the LabPET II mouse scanner.”, Njejimana, L, et al., 2016 IEEE Nuclear Science Symposium, Medical Imaging Conference and Room-Temperature Semiconductor Detector Workshop (NSS/MIC/RTSD). IEEE, 2016. Fig B and C: Adapted with permission from “RatCAP: miniaturized head-mounted PET for conscious rodent brain imaging.”, Vaska, P., et al. , IEEE Transactions on Nuclear Science 51.5 (2004): 2718–2722.
Figure 11.
Figure 11.
8×8 array of 6 mm2 SiPMs (left) and 12×12 array of 3 mm2 SiPMs (right). (ONsemi, Phoenix AZ).
Figure 12.
Figure 12.
Readout schematics for analog and digital SiPMs. Signal processing in the analog version is pictured as being accomplished by a separate applications specific integrated circuit (ASIC) while signal processing in the digital version is accomplished by reading out each individual SPADs with components physically integrated into the SiPM. ADC: analog to digital converter; TDC: time to digital converter; ID: digital location or SiPM identifier.
Figure 13.
Figure 13.
Time-over-threshold energy estimation. Simulated pulse shapes of various amplitudes crossing the low (T1) and high (T3) thresholds. The measured time difference between T3 and T1 is an effective estimate of the pulse area (energy). Crossing the T2 threshold insures a valid pulse. Figure from LabPETII (2012 Design of a real-time FPGA-based DAQ architecture for the LabPET II). Adapted with permission from “Design of a real-time FPGA-based DAQ architecture for the LabPET II, an APD-based scanner dedicated to small animal PET imaging.”, Njejimana, Larissa, et al., 2012 18th IEEE-NPSS Real Time Conference. IEEE, 2012.
Figure 14.
Figure 14.
Schematic illustration of data processing elements downstream from the detector module array. Time markers from the master clock ensure that events occurring in the detector array are stamped with a common reference time that allows subsequent determination of coincidence events between scintillation crystals anywhere in the array.
Figure 15.
Figure 15.
Comparison of ground truth (left), OSEM (center) and AI (DeepPET, right) PET image reconstructions of the same image slice. OSEM is nearly equal to DeepPET in terms of image quality metrics, albeit mostly appearing noisier and less detailed. Adapted with permission from “DeepPET: A deep encoder–decoder network for directly solving the PET image reconstruction inverse problem.”, Häggström, Ida, et al., Medical image analysis 54 (2019): 253–262.
Figure 16.
Figure 16.
Deep learning (DL) derived CT scan from an FDG PET image of the same section. NAC: non-attenuation corrected PET FDG scan, deepACpseudo-CT image: DL created CT image; Acquired CT image: actual CT scan of the same section. Adapted with permission from “A deep learning approach for 18 F-FDG PET attenuation correction.”, Liu, Fang, et al., EJNMMI physics 5.1 (2018): 1–15.
Figure 17.
Figure 17.
Comparison of FDG PET scans corrected for attenuation with the DL attenuation image (a) and the actual CT image (b). PET error is the difference between the derived and actual PET image. Adapted with permission from “A deep learning approach for 18 F-FDG PET attenuation correction.”, Liu, Fang, et al., EJNMMI physics 5.1 (2018): 1–15.
Figure 18.
Figure 18.
Example slices for 3D simulated [18F]FDG data for a forward-backward splitting expectation maximization (FBSEM-Net network), trained to match high-count reference data, when using ~100 times less data along with a T1w MR image for further information. FBSEM-Net is compared to conventional ordered subset expectation maximization (OSEM, no MRI benefit), without and with point spread function (PSF) modelling, maximum a posteriori expectation maximization (MAP-EM) with MRI guidance, and to a post-reconstruction denoised reconstruction using a U-Net supplied with MRI information. Adapted with permission from2 “Deep learning for PET image reconstruction.”, Reader, Andrew J., et al., IEEE Transactions on Radiation and Plasma Medical Sciences 5.1 (2020): 1–25.
Figure 19.
Figure 19.
Coronal section through a simulated mouse CT scan (a), and simulated PET images of the same slice distribution of 18F (b), 68Ga (c) and 68Ga (d) corrected for positron range using the Deep-PRC neural network. Note similarity between (b) and (d) and the difference between the uncorrected 68Ga image (c). Adapted with permission from “Deep-learning based positron range correction of PET images.”, Herraiz, Joaquín L. et al., Applied sciences 11.1 (2021): 266.
Figure 20.
Figure 20.
Posterior view of a mouse pair imaged with the positron projection imager (PPI). T = tumor; L = liver; K = kidney. Overlayed rectangle indicates the field-of-view of the device.
Figure 21.
Figure 21.
PPI images of two different mouse pairs (A and B) imaged in the geometry shown in Figure 20 where regions of interest (ROIs) have been defined manually (left panels) and by the U-net AI algorithm (right panels). Most of these test studies showed good agreement (as in A) but occasionally disagreed on the size of a background region (rectangle) and/or tumor boundaries (there was no lesion in the mouse at the left in B). Total tumor activity is relatively insensitive to the size of the background ROI but does depend on location between animals. Mean background values in the ROIs shown were not significantly different between methods. (Courtesy of K. Ma, S. Harmon, NCI/NIH)

References

    1. Vaquero JJ, Kinahan P. Positron emission tomography: current challenges and opportunities for technological advances in clinical and preclinical imaging systems. Annual review of biomedical engineering. 2015;17:385–414. - PMC - PubMed
    1. Amirrashedi M, Zaidi H, Ay MR. Advances in preclinical PET instrumentation. PET clinics. 2020;15(4):403–426. - PubMed
    1. Miyaoka RS, Lehnert AL. Small animal PET: a review of what we have done and where we are going. Physics in Medicine & Biology. 2020;65(24):24TR04. - PubMed
    1. Yang Y, Bec J, Zhou J, et al. A prototype high-resolution small-animal PET scanner dedicated to mouse brain imaging. Journal of Nuclear Medicine. 2016;57(7):1130–1135. - PMC - PubMed
    1. Levin CS, Hoffman EJ. Calculation of positron range and its effect on the fundamental limit of positron emission tomography system spatial resolution. Physics in Medicine & Biology. 1999;44(3):781. - PubMed

Publication types

MeSH terms