

Remodeling of the Cortical Structural Connectome in Posttraumatic Stress Disorder: Results From the ENIGMA-PGC Posttraumatic Stress Disorder Consortium
- PMID: 35307575
- PMCID: PMC9835553
- DOI: 10.1016/j.bpsc.2022.02.008
Remodeling of the Cortical Structural Connectome in Posttraumatic Stress Disorder: Results From the ENIGMA-PGC Posttraumatic Stress Disorder Consortium
Abstract
Background: Posttraumatic stress disorder (PTSD) is accompanied by disrupted cortical neuroanatomy. We investigated alteration in covariance of structural networks associated with PTSD in regions that demonstrate the case-control differences in cortical thickness (CT) and surface area (SA).
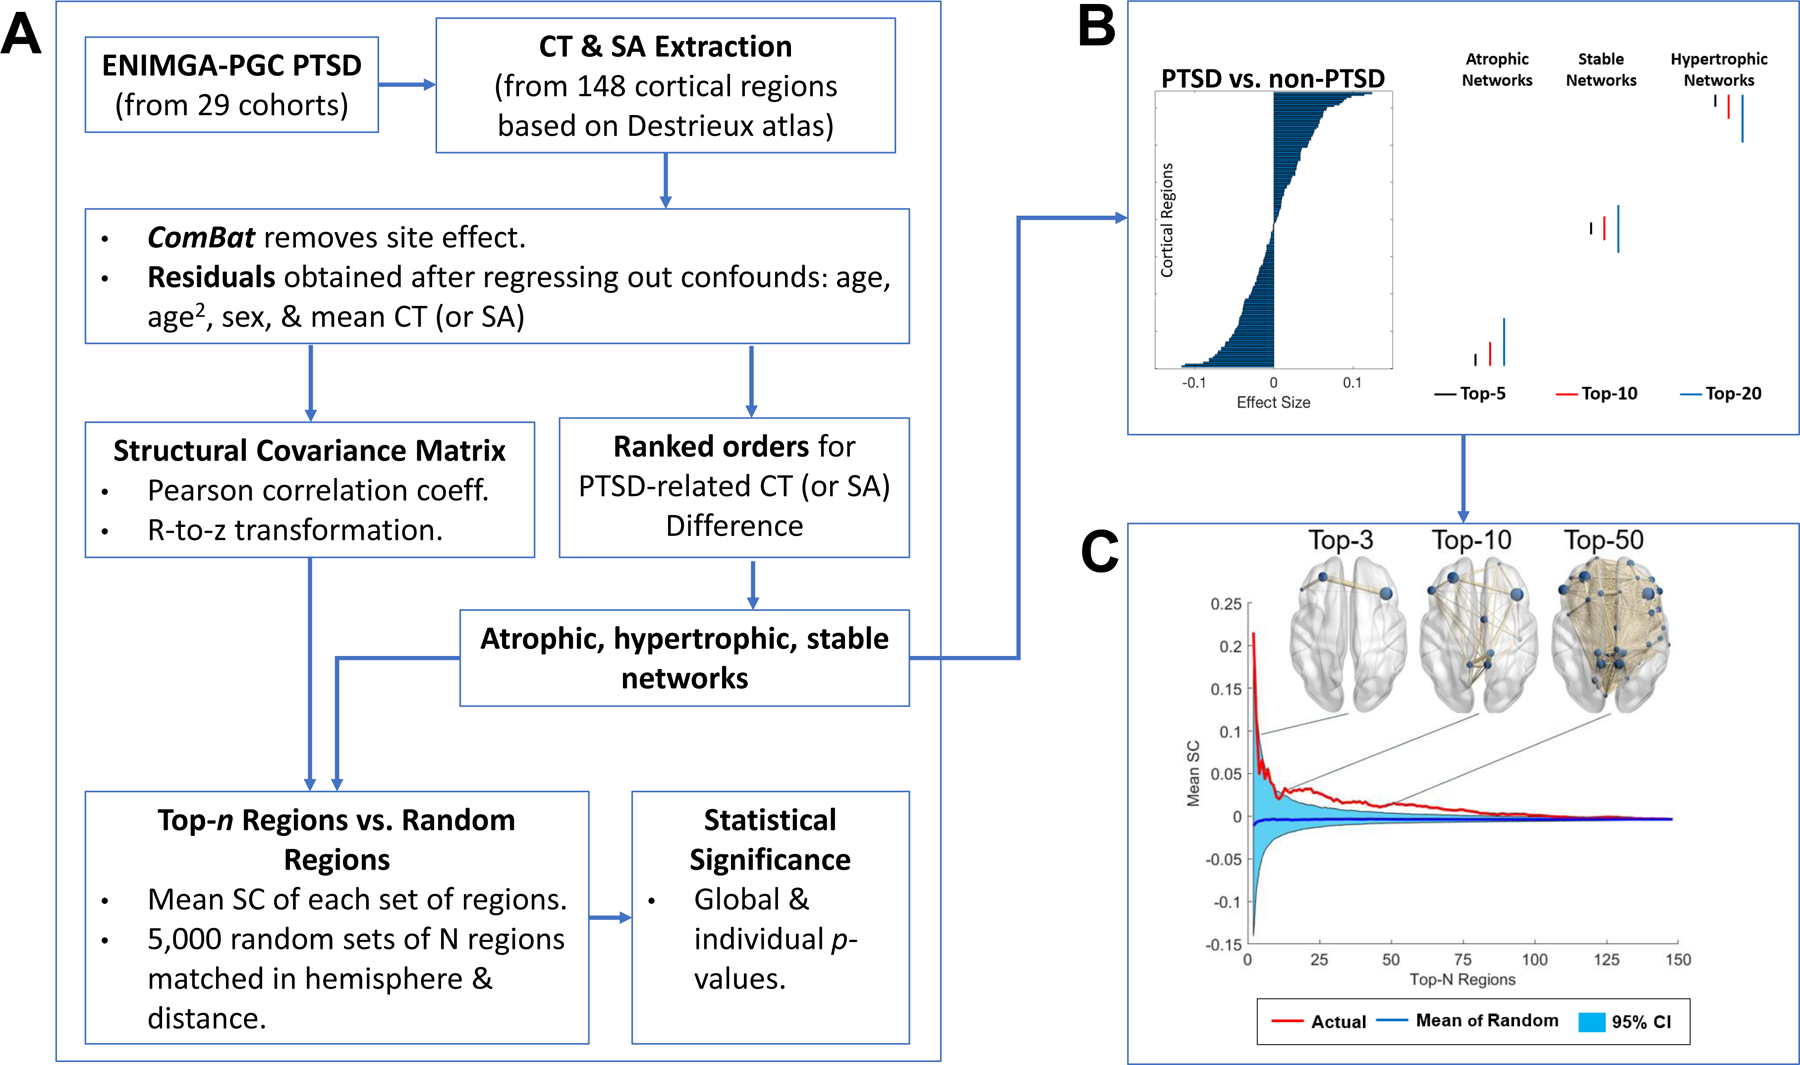
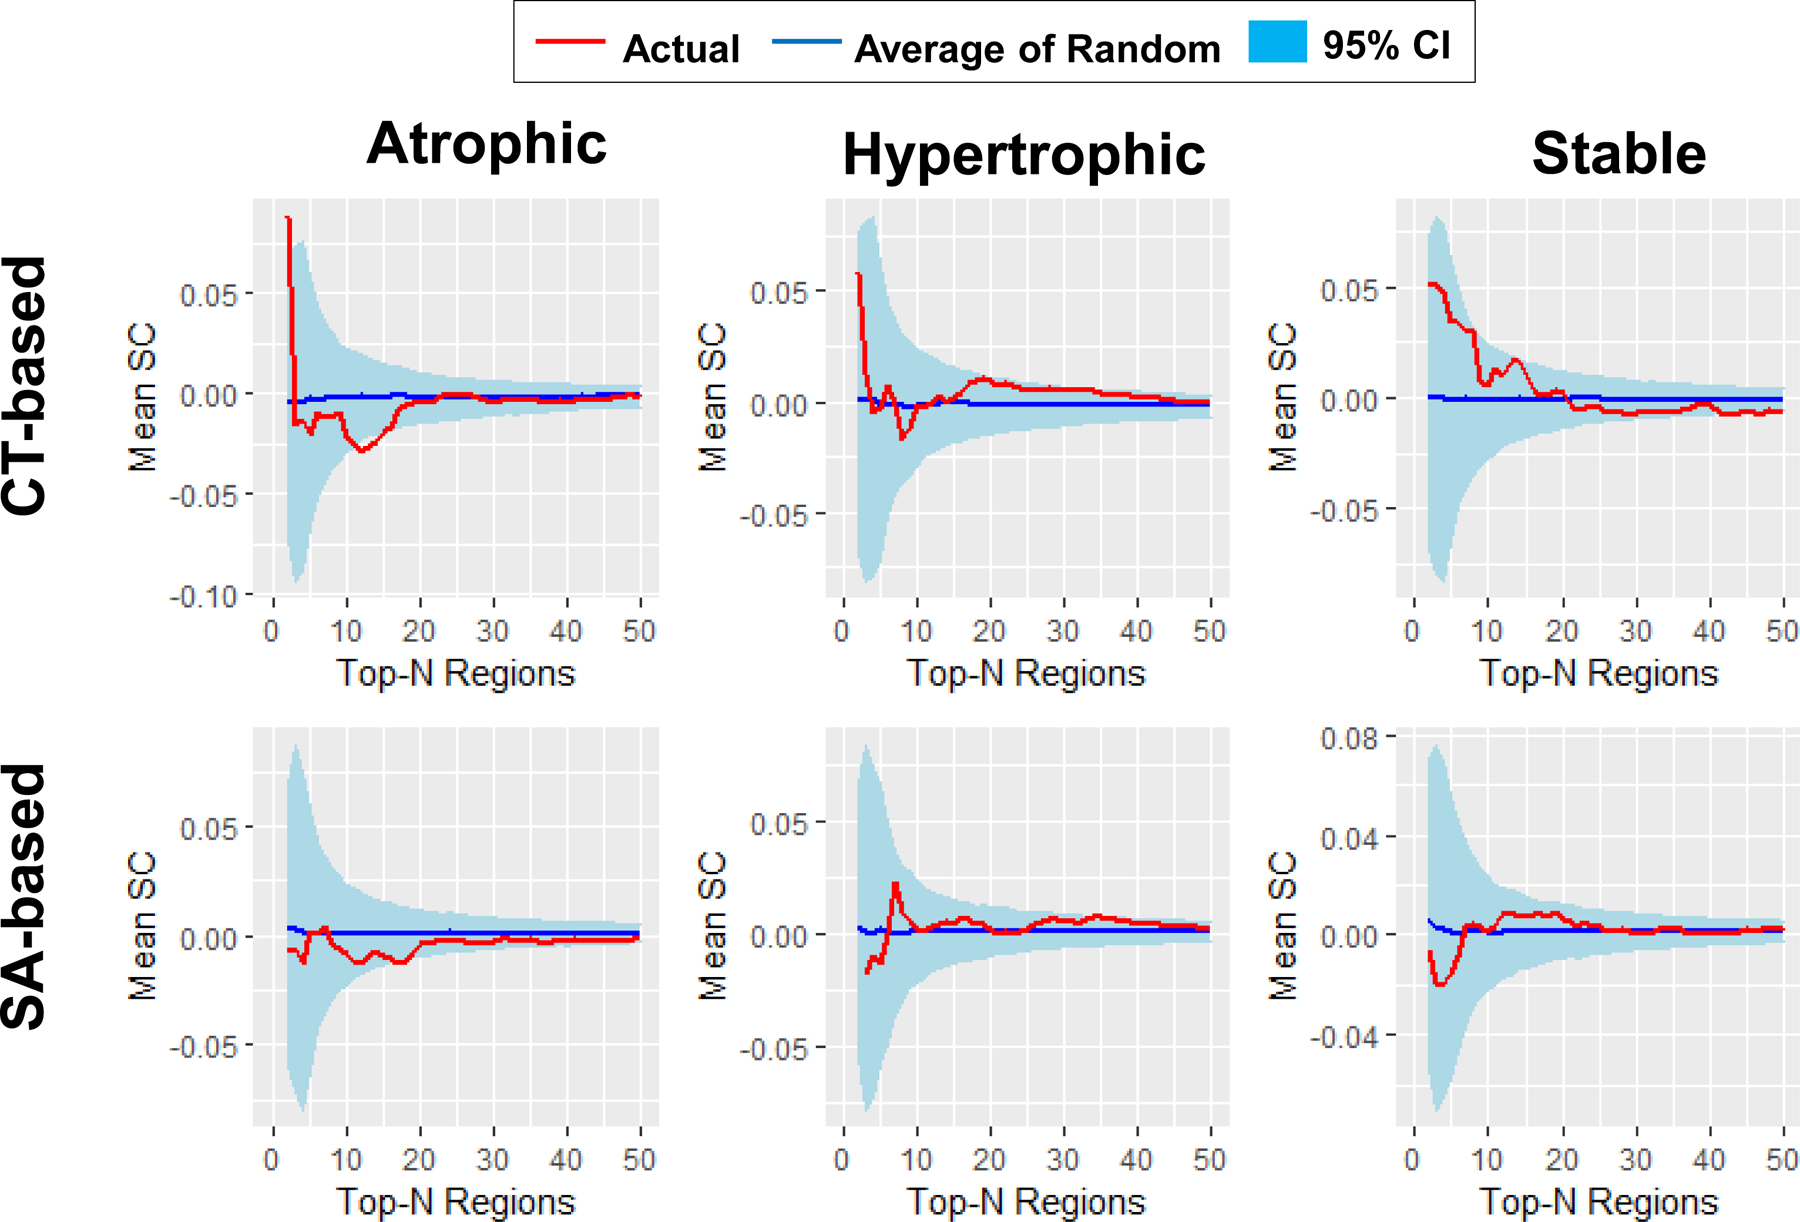
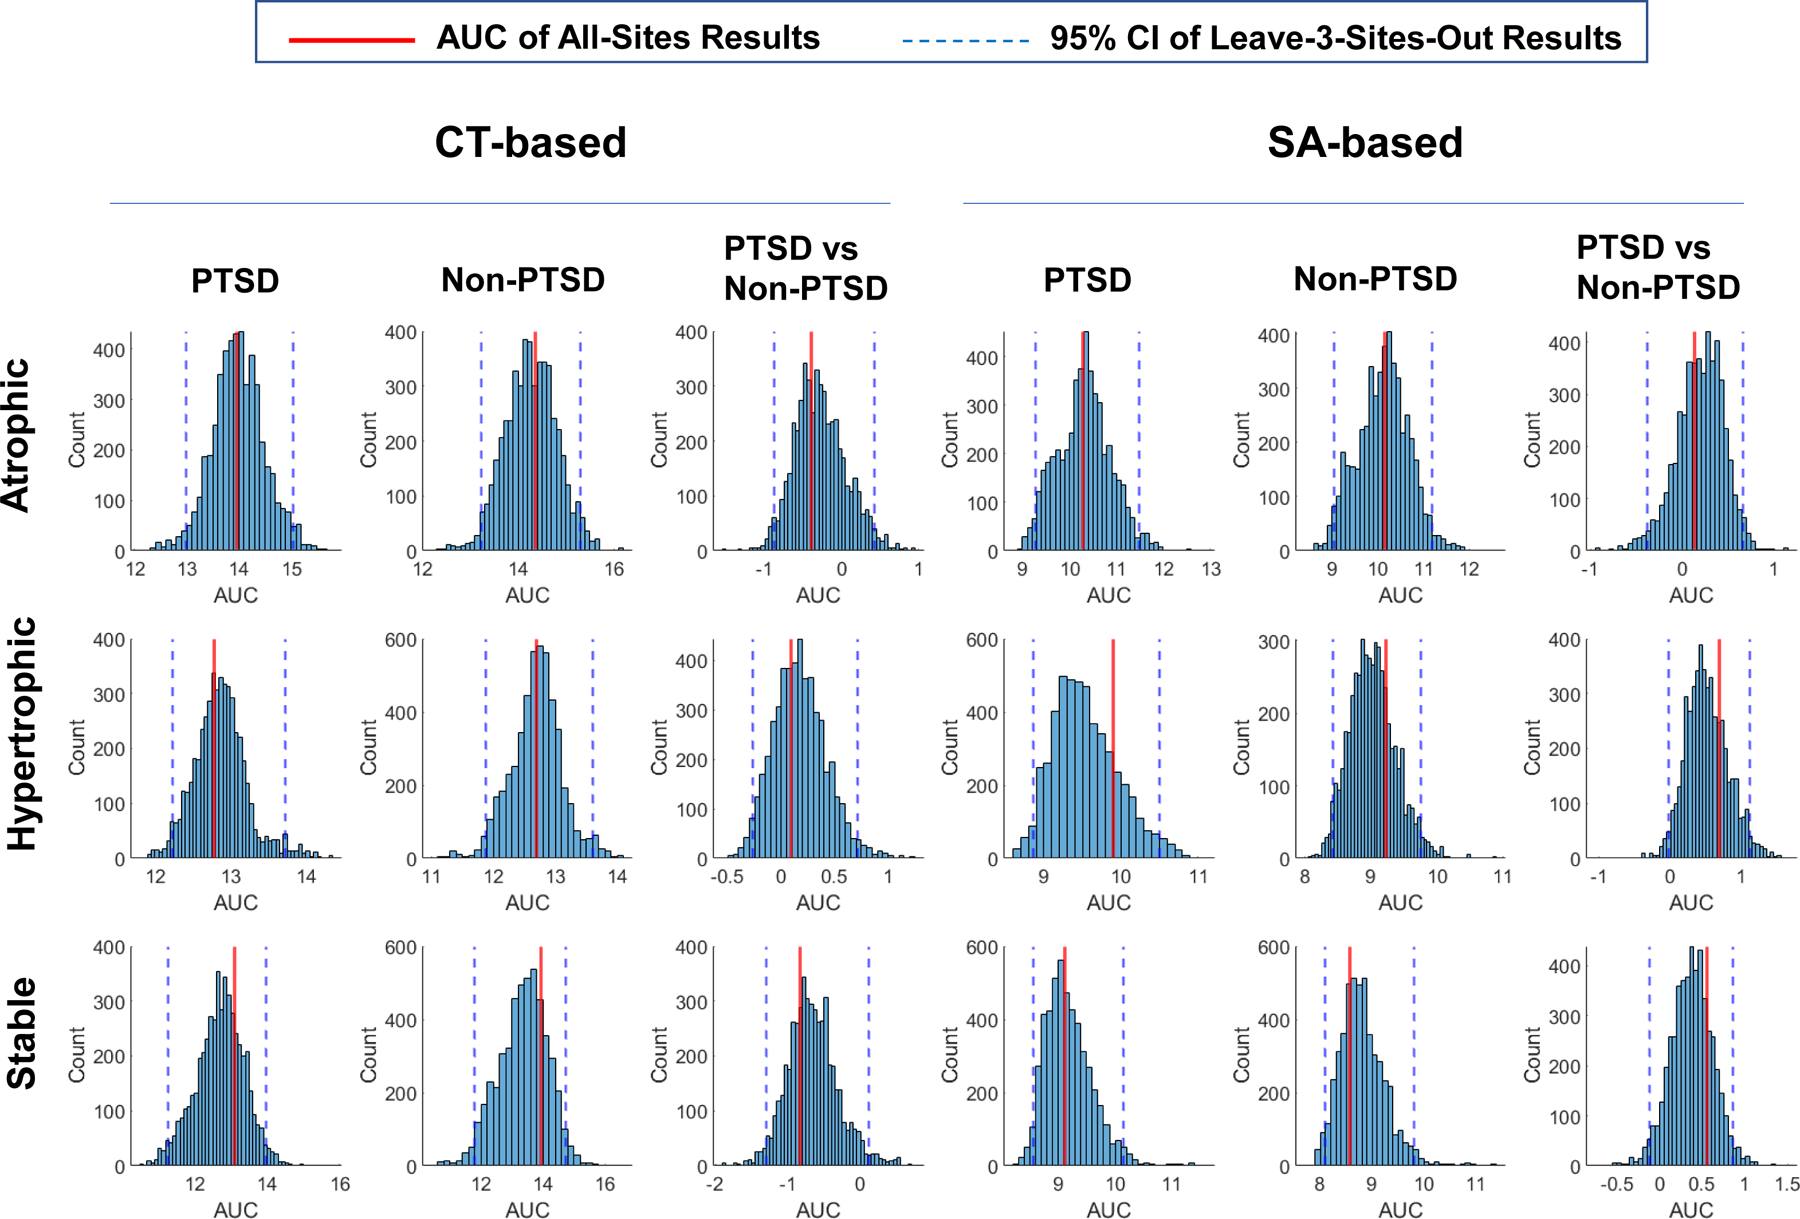
Methods: Neuroimaging and clinical data were aggregated from 29 research sites in >1300 PTSD cases and >2000 trauma-exposed control subjects (ages 6.2-85.2 years) by the ENIGMA-PGC (Enhancing Neuro Imaging Genetics through Meta Analysis-Psychiatric Genomics Consortium) PTSD working group. Cortical regions in the network were rank ordered by the effect size of PTSD-related cortical differences in CT and SA. The top-n (n = 2-148) regions with the largest effect size for PTSD > non-PTSD formed hypertrophic networks, the largest effect size for PTSD < non-PTSD formed atrophic networks, and the smallest effect size of between-group differences formed stable networks. The mean structural covariance (SC) of a given n-region network was the average of all positive pairwise correlations and was compared with the mean SC of 5000 randomly generated n-region networks.
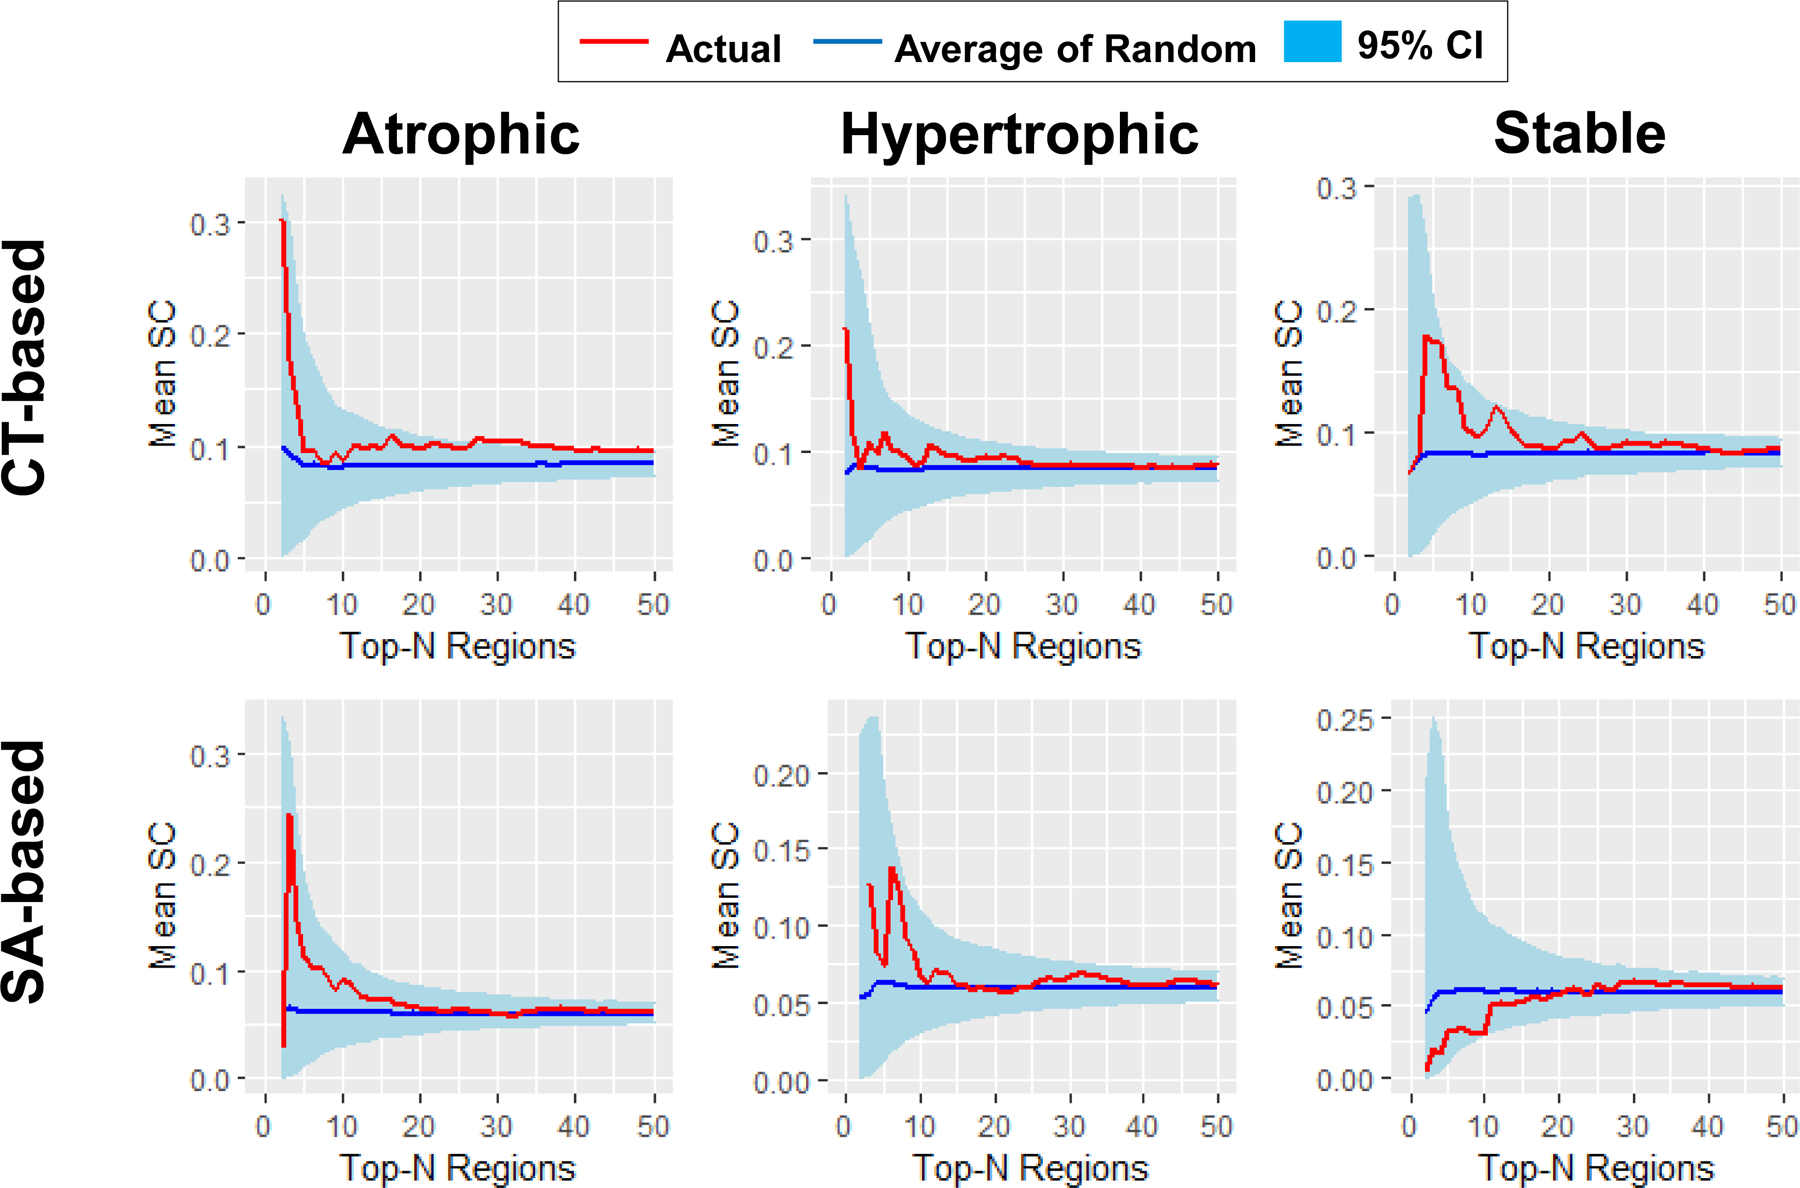
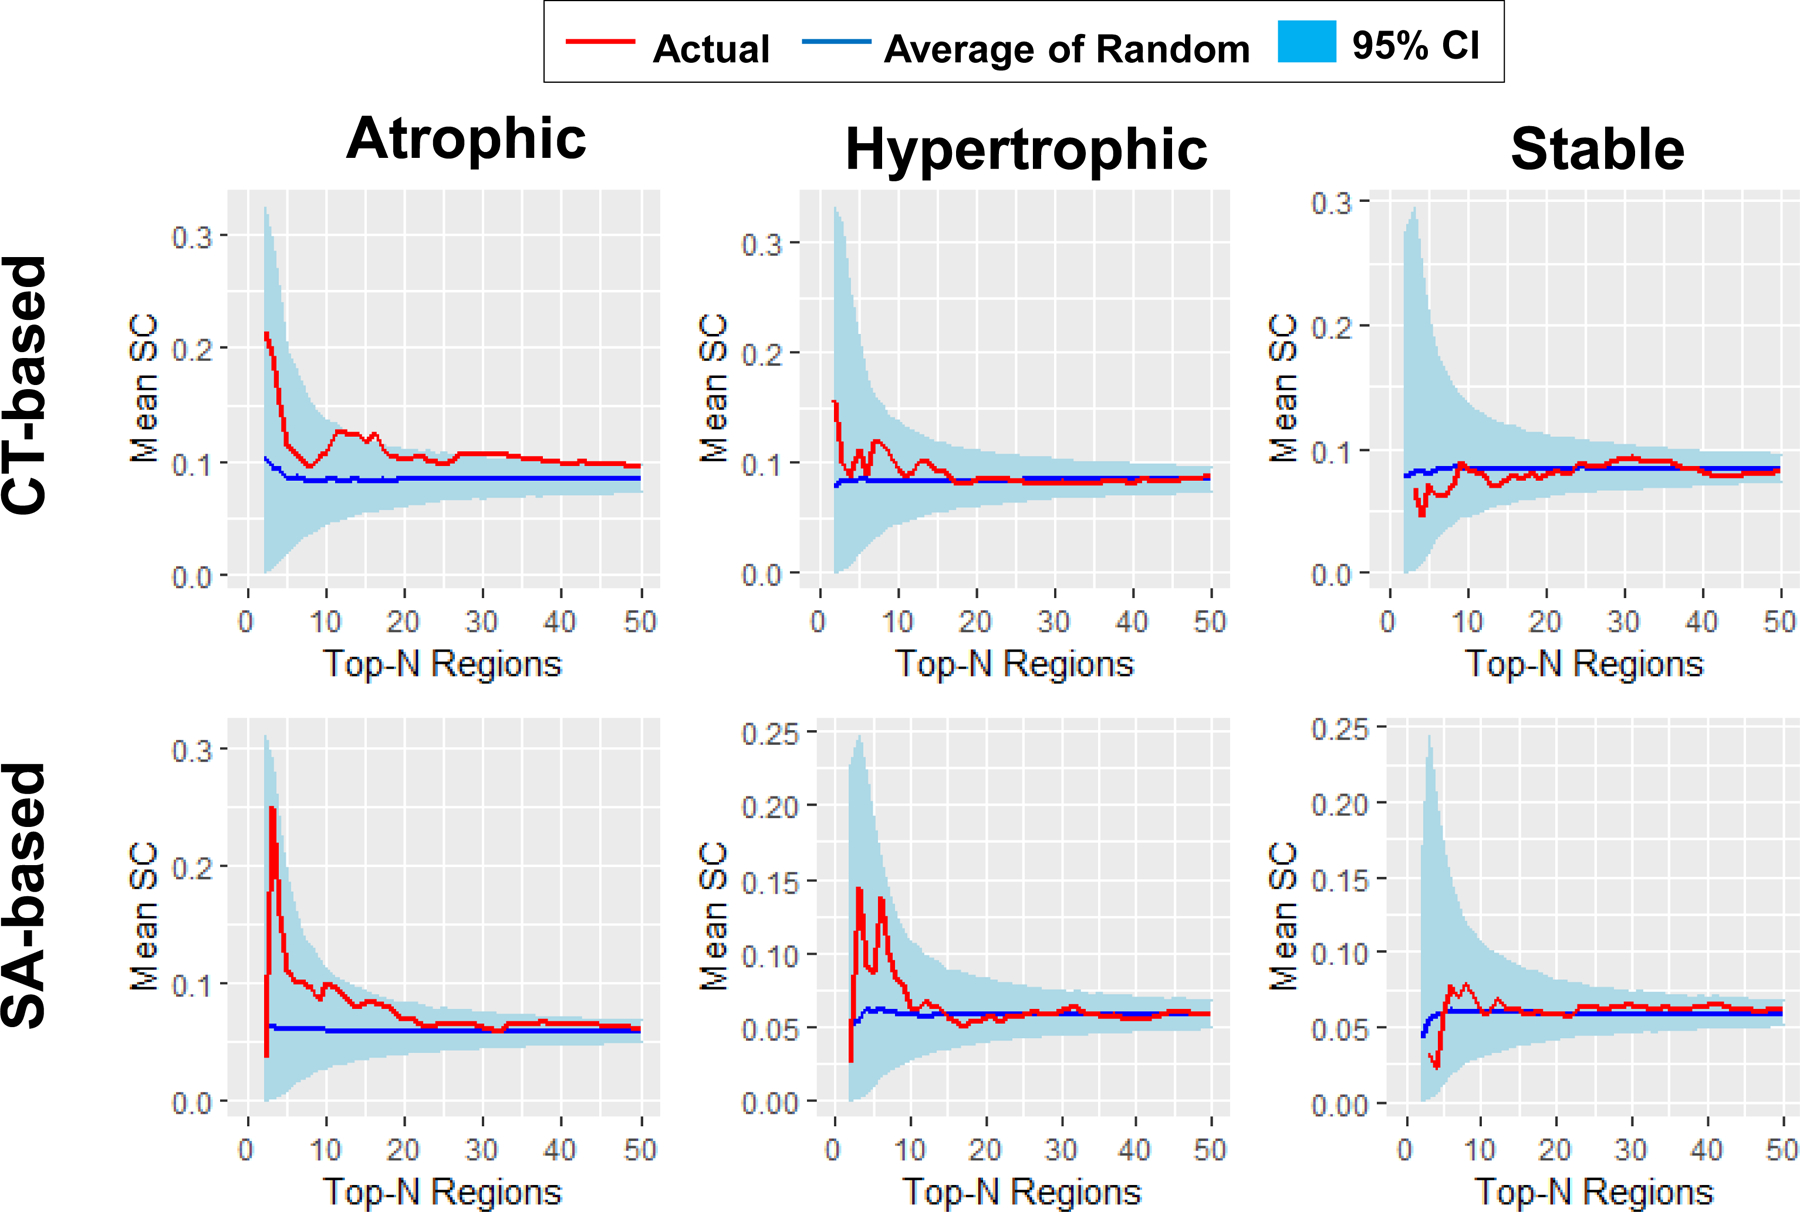
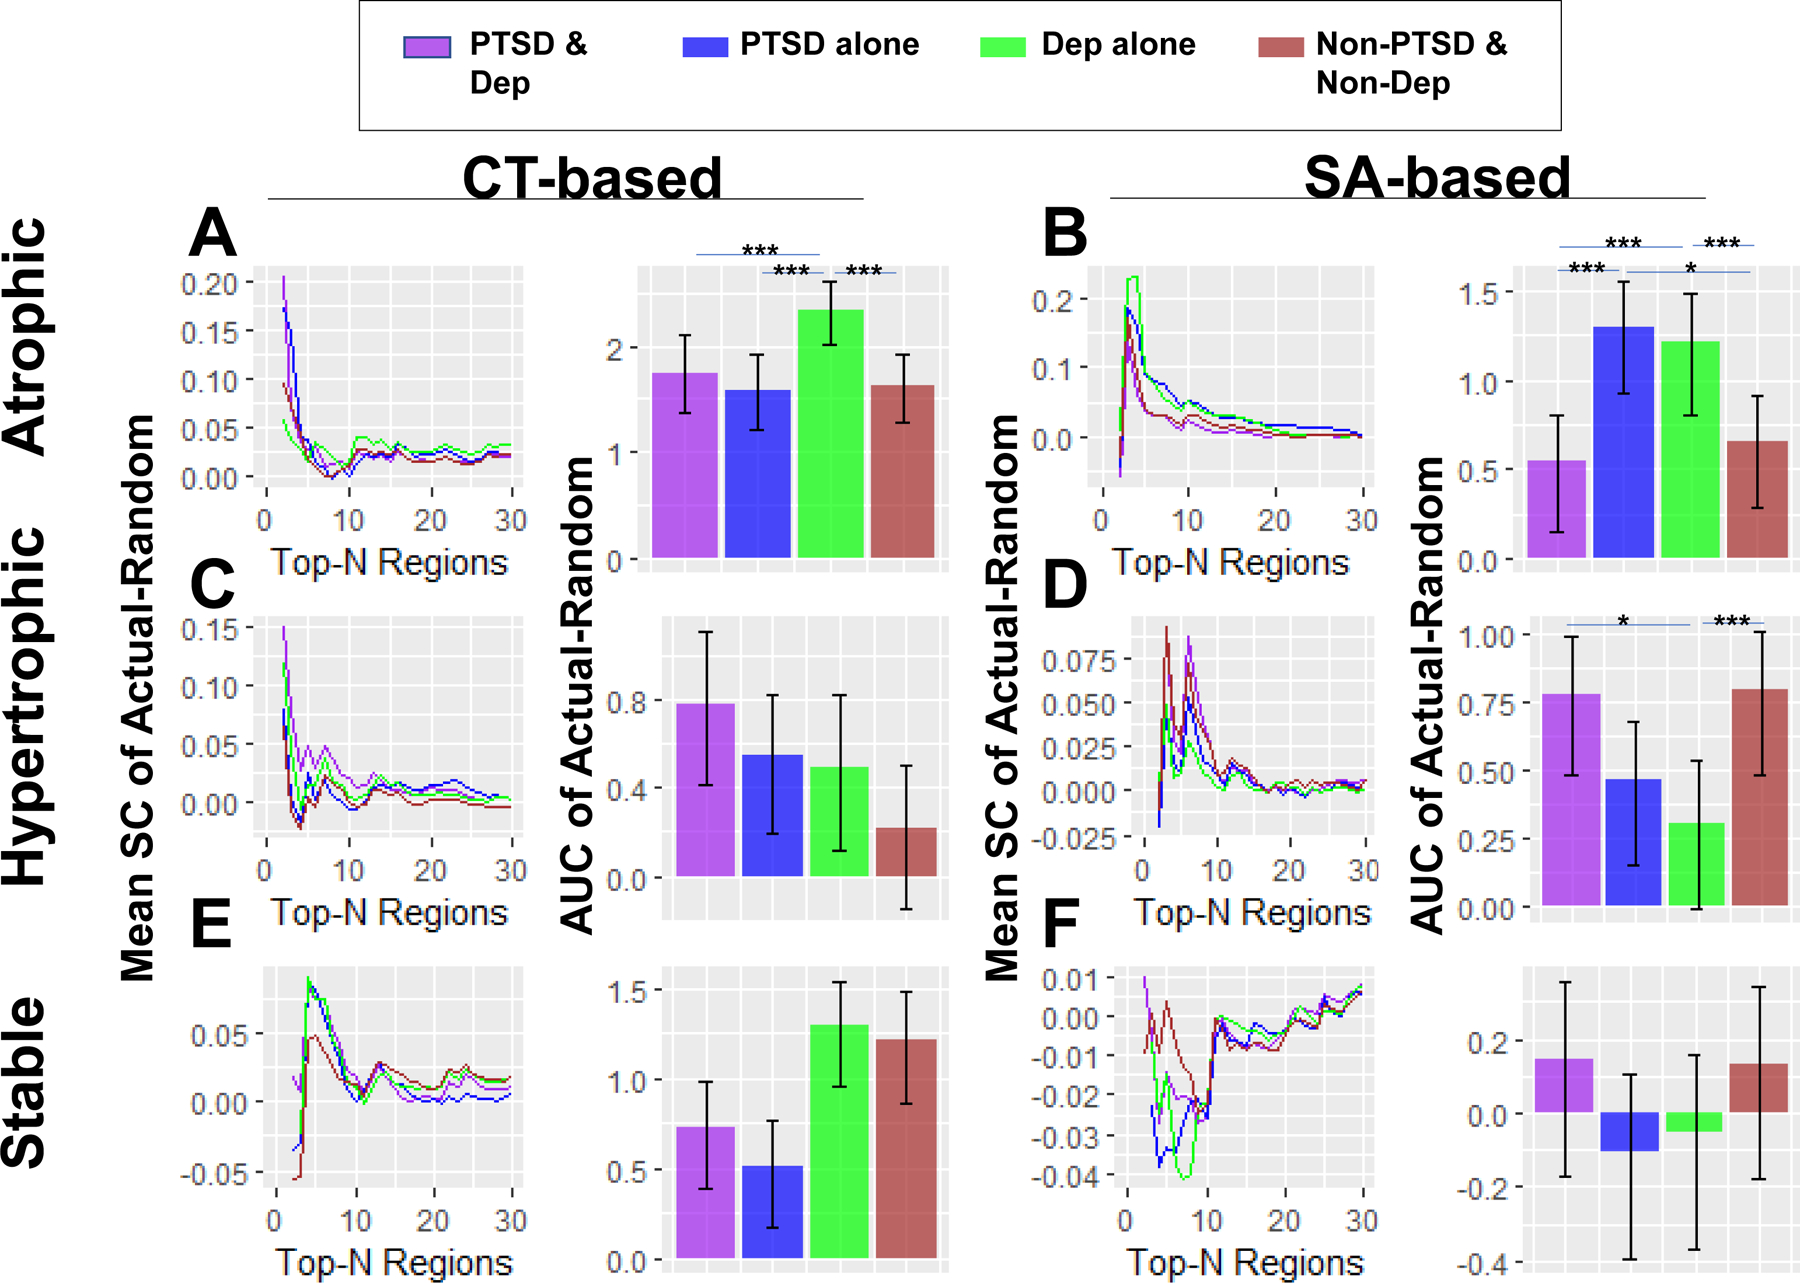
Results: Patients with PTSD, relative to non-PTSD control subjects, exhibited lower mean SC in CT-based and SA-based atrophic networks. Comorbid depression, sex, and age modulated covariance differences of PTSD-related structural networks.
Conclusions: Covariance of structural networks based on CT and cortical SA are affected by PTSD and further modulated by comorbid depression, sex, and age. The SC networks that are perturbed in PTSD comport with converging evidence from resting-state functional connectivity networks and networks affected by inflammatory processes and stress hormones in PTSD.
Keywords: Brain network; Cortical thickness; Depression; PTSD; Structural covariance; Surface area.
Copyright © 2022 Society of Biological Psychiatry. All rights reserved.
Conflict of interest statement
Conflicts of Interest
Dr. Abdallah has served as a consultant, speaker and/or on advisory boards for FSV7, Lundbeck, Psilocybin Labs, Genentech and Janssen, and editor of Chronic Stress for Sage Publications, Inc.; he has filed a patent for using mTOR inhibitors to augment the effects of antidepressants (filed on August 20, 2018). Dr. Davidson is the founder and president of, and serves on the board of directors for, the non-profit organization Healthy Minds Innovations, Inc. Dr. Jahanshad received partial research support from Biogen, Inc. (Boston, USA) for research unrelated to the content of this manuscript. Dr. Krystal is a consultant for AbbVie, Inc., Amgen, Astellas Pharma Global Development, Inc., AstraZeneca Pharmaceuticals, Biomedisyn Corporation, Bristol-Myers Squibb, Eli Lilly and Company, Euthymics Bioscience, Inc., Neurovance, Inc., FORUM Pharmaceuticals, Janssen Research & Development, Lundbeck Research USA, Novartis Pharma AG, Otsuka America Pharmaceutical, Inc., Sage Therapeutics, Inc., Sunovion Pharmaceuticals, Inc., and Takeda Industries; is on the Scientific Advisory Board for Lohocla Research Corporation, Mnemosyne Pharmaceuticals, Inc., Naurex, Inc., and Pfizer; is a stockholder in Biohaven Pharmaceuticals; holds stock options in Mnemosyne Pharmaceuticals, Inc.; holds patents for Dopamine and Noradrenergic Reuptake Inhibitors in Treatment of Schizophrenia, US Patent No. 5,447,948 (issued September 5, 1995), and Glutamate Modulating Agents in the Treatment of Mental Disorders, U.S. Patent No. 8,778,979 (issued July 15, 2014); and filed a patent for Intranasal Administration of Ketamine to Treat Depression. U.S. Application No. 14/197,767 (filed on March 5, 2014); US application or Patent Cooperation Treaty international application No. 14/306,382 (filed on June 17, 2014). Filed a patent for using mTOR inhibitors to augment the effects of antidepressants (filed on August 20, 2018). Dr. Schmahl is consultant for Boehringer Ingelheim International GmbH. Dr. Stein has received research grants and/or consultancy honoraria from Lundbeck and Sun. Dr. Thompson received partial research support from Biogen, Inc. (Boston, USA) for research unrelated to the topic of this manuscript. All other authors have no conflicts of interest to declare.
Figures
References
-
- Shalev A, Liberzon I, Marmar C (2017): Post-Traumatic Stress Disorder. New Engl J Med. 376:2459–2469. - PubMed
-
- Mueller SG, Ng P, Neylan T, Mackin S, Wolkowitz O, Mellon S, et al. (2015): Evidence for disrupted gray matter structural connectivity in posttraumatic stress disorder. Psychiat Res-Neuroim. 234:194–201. - PubMed
-
- Li SG, Huang XQ, Li LJ, Du F, Li J, Bi F, et al. (2016): Posttraumatic Stress Disorder: Structural Characterization with 3-T MR Imaging. Radiology. 280:537–544. - PubMed
Publication types
MeSH terms
Grants and funding
- IK2 CX001680/CX/CSRD VA/United States
- R01 MH105535/MH/NIMH NIH HHS/United States
- R01 MH116147/MH/NIMH NIH HHS/United States
- L30 MH114379/MH/NIMH NIH HHS/United States
- K24 MH071434/MH/NIMH NIH HHS/United States
- R01 MH119227/MH/NIMH NIH HHS/United States
- R01 MH110483/MH/NIMH NIH HHS/United States
- T32 MH018931/MH/NIMH NIH HHS/United States
- IK2 CX001600/CX/CSRD VA/United States
- K01 MH118467/MH/NIMH NIH HHS/United States
- IK2 RX000709/RX/RRD VA/United States
- R01 MH061744/MH/NIMH NIH HHS/United States
- R01 AG059874/AG/NIA NIH HHS/United States
- P41 EB015922/EB/NIBIB NIH HHS/United States
- P30 HD003352/HD/NICHD NIH HHS/United States
- R56 MH071537/MH/NIMH NIH HHS/United States
- K01 MH122774/MH/NIMH NIH HHS/United States
- F32 MH109274/MH/NIMH NIH HHS/United States
- R01 MH131532/MH/NIMH NIH HHS/United States
- IK2 RX002922/RX/RRD VA/United States
- R01 MH103291/MH/NIMH NIH HHS/United States
- R01 MH113574/MH/NIMH NIH HHS/United States
- K24 DA028773/DA/NIDA NIH HHS/United States
- R21 MH098212/MH/NIMH NIH HHS/United States
- K12 HD085850/HD/NICHD NIH HHS/United States
- R01 MH071537/MH/NIMH NIH HHS/United States
- UL1 TR001863/TR/NCATS NIH HHS/United States
- R21 MH112956/MH/NIMH NIH HHS/United States
- K01 MH118428/MH/NIMH NIH HHS/United States
- U01 AA021681/AA/NIAAA NIH HHS/United States
- R01 MH105355/MH/NIMH NIH HHS/United States
- R21 MH098198/MH/NIMH NIH HHS/United States
- R01 MH063407/MH/NIMH NIH HHS/United States
- M01 RR000039/RR/NCRR NIH HHS/United States
- R01 MH111671/MH/NIMH NIH HHS/United States
- R01 MH106574/MH/NIMH NIH HHS/United States
- R01 AA012479/AA/NIAAA NIH HHS/United States
- F32 MH101976/MH/NIMH NIH HHS/United States
- K99 NS096116/NS/NINDS NIH HHS/United States
- IK1 RX002325/RX/RRD VA/United States
- I01 RX000622/RX/RRD VA/United States
- U54 EB020403/EB/NIBIB NIH HHS/United States
- R01 MH117601/MH/NIMH NIH HHS/United States
- UL1 TR000454/TR/NCATS NIH HHS/United States
- R21 MH125277/MH/NIMH NIH HHS/United States
- R56 AG058854/AG/NIA NIH HHS/United States
- K23 MH112873/MH/NIMH NIH HHS/United States
- K23 MH101380/MH/NIMH NIH HHS/United States
- R01 MH043454/MH/NIMH NIH HHS/United States
- R21 MH102634/MH/NIMH NIH HHS/United States
- K01 MH092526/MH/NIMH NIH HHS/United States
- R01 HD071982/HD/NICHD NIH HHS/United States
LinkOut - more resources
Full Text Sources
Medical
Miscellaneous
