

Influence of Lipoxin-A4 Treatment on Cytokine, Chemokine Genes Expression, and Phenotypic Distribution of Lymphocyte Subsets During Experimental Liver Fibrosis
- PMID: 35307625
- PMCID: PMC9634900
- DOI: 10.5152/eurasianjmed.2022.20030
Influence of Lipoxin-A4 Treatment on Cytokine, Chemokine Genes Expression, and Phenotypic Distribution of Lymphocyte Subsets During Experimental Liver Fibrosis
Abstract
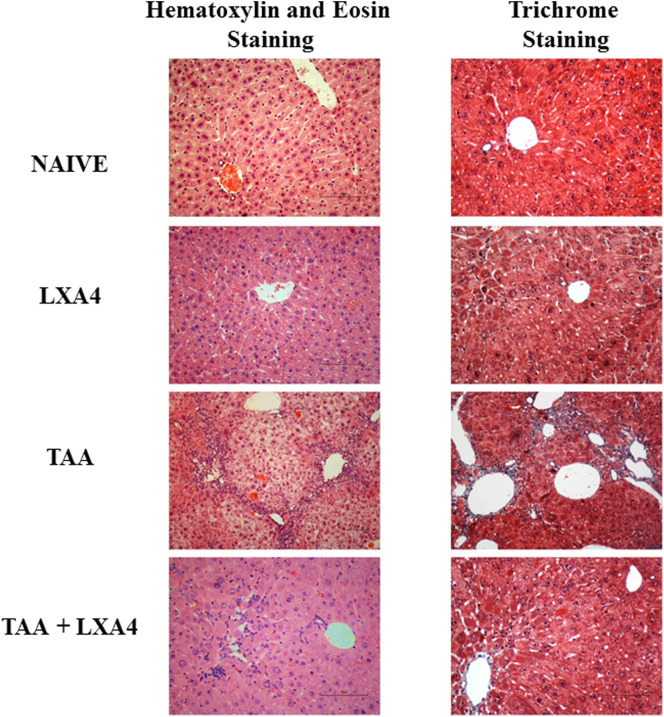
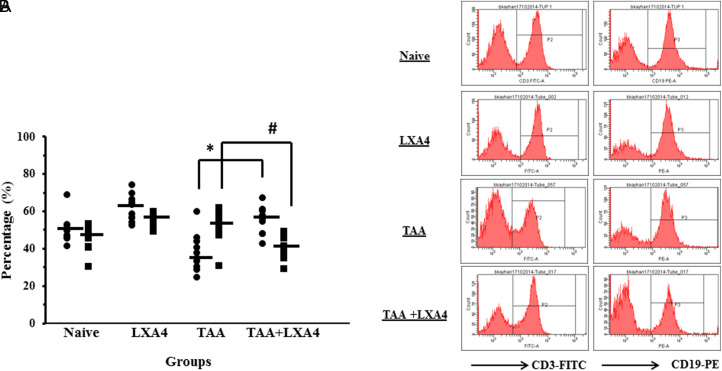
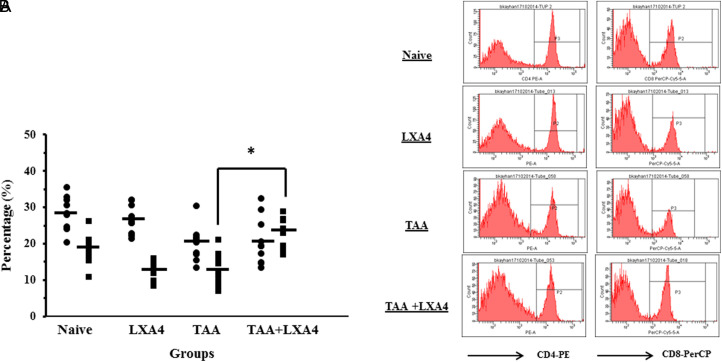
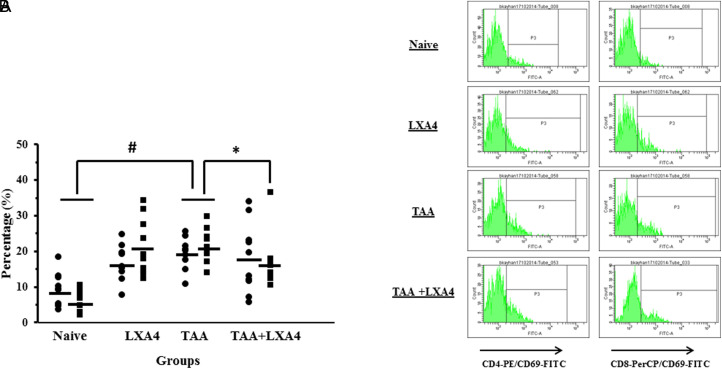
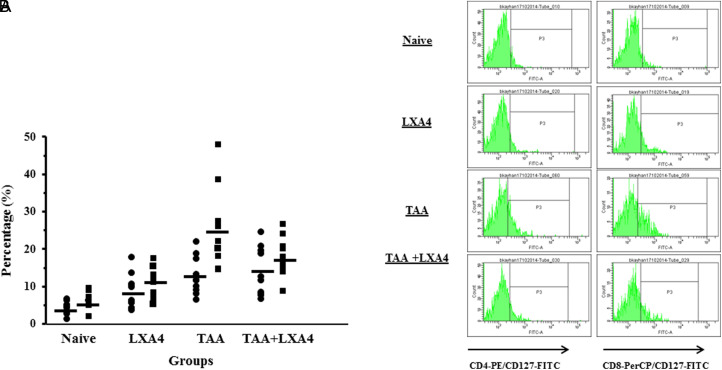
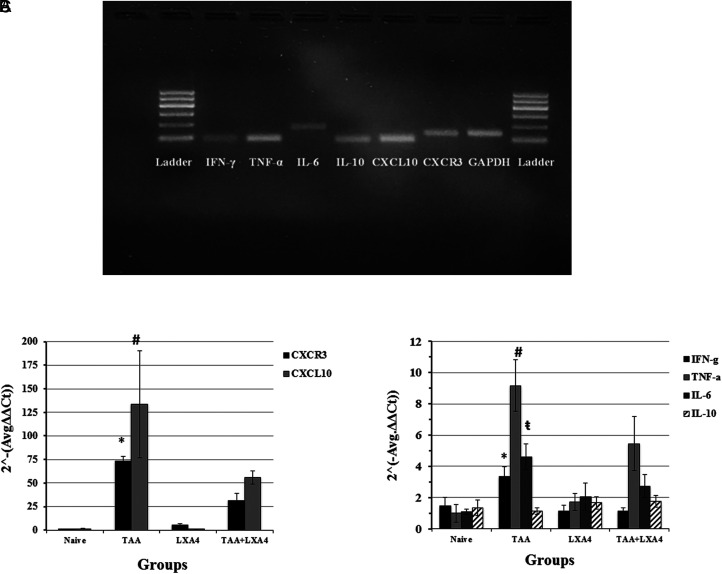
Objective: Lipoxins are anti-inflammatory, pro-resolving molecules that are secreted by immune cells such as neutrophils and macrophages. Lipoxins are a metabolite of the arachidonic acid pathway that resolve inflammation in fibrotic liver by producing several anti-inflammatory molecules. In this study, phenotypic distribution activation markers of lymphocytes in the spleen and expression levels of chemokines (chemokine (C-X-C motif) receptor 3, chemokine (C-X-C motif) ligand 10) cytokines (interferon gamma, tumor necrosis factor alpha, interleukin-6, interleukin-10) in the liver of lipoxin A4-treated fibrotic mice were investigated.
Materials and methods: Liver fibrosis was induced in BALB/c mice by thioacetamide administration. Lipoxin A4 was administered during last 2 weeks of induction. Fibrosis level was determined by using Knodell scoring. Lymphocytes were identified by flow-cytometry. Expression levels of genes were measured by quantitative real time polymerase chain reaction in liver homogenates.
Results: Lipoxin A4 treatment caused an elevation of T-lymphocyte percentage in the spleen. Interestingly, administration of lipoxin A4 significantly reduced B-lymphocyte population in spleen of fibrotic group. CD8+ cytotoxic T cell frequency significantly reduced in thioacetamide-induced mice; however, lipoxin A4 administration increased that percentage significantly. Lipoxin A4 treatment significantly reduced frequency of activated (CD8+CD69+) cytotoxic T cells. Expression levels of chemokines significantly reduced in the liver after lipoxin A4 treatment. While expression levels of interferon gamma, tumor necrosis factor alpha, and interleukin-6 significantly reduced in the liver after lipoxin A4 treatment, an anti-inflammatory cytokine interleukin-10 expression was almost at similar levels in all experimental groups.
Conclusion: Lipoxin A4 performs its anti-inflammatory effect by reducing the frequency of activated T cells and expression levels of chemokines cytokines responsible from inflammatory immune response in the liver.
Conflict of interest statement
Figures
Similar articles
-
A bioactive product lipoxin A4 attenuates liver fibrosis in an experimental model by regulating immune response and modulating the expression of regeneration genes.Turk J Gastroenterol. 2019 Aug;30(8):745-757. doi: 10.5152/tjg.2019.18276. Turk J Gastroenterol. 2019. PMID: 31418419 Free PMC article.
-
Combination therapy of 15-epi-lipoxin A4 with antibiotics protects mice from Escherichia coli-induced sepsis*.Crit Care Med. 2014 Apr;42(4):e288-95. doi: 10.1097/CCM.0000000000000162. Crit Care Med. 2014. PMID: 24463858
-
Downregulation of TNF-α/TNF-R1 Signals by AT-Lipoxin A4 May Be a Significant Mechanism of Attenuation in SAP-Associated Lung Injury.Mediators Inflamm. 2019 Apr 11;2019:9019404. doi: 10.1155/2019/9019404. eCollection 2019. Mediators Inflamm. 2019. PMID: 31097921 Free PMC article.
-
Could Lipoxins Represent a New Standard in Ischemic Stroke Treatment?Int J Mol Sci. 2021 Apr 19;22(8):4207. doi: 10.3390/ijms22084207. Int J Mol Sci. 2021. PMID: 33921615 Free PMC article. Review.
-
Lipoxin and synthetic lipoxin analogs: an overview of anti-inflammatory functions and new concepts in immunomodulation.Inflamm Allergy Drug Targets. 2006 Apr;5(2):91-106. doi: 10.2174/187152806776383125. Inflamm Allergy Drug Targets. 2006. PMID: 16613568 Review.
Cited by
-
Eicosanoids and other oxylipins in liver injury, inflammation and liver cancer development.Front Physiol. 2023 Feb 2;14:1098467. doi: 10.3389/fphys.2023.1098467. eCollection 2023. Front Physiol. 2023. PMID: 36818443 Free PMC article. Review.
-
Chronic kidney disease and aging: dissecting the p53/p21 pathway as a therapeutic target.Biogerontology. 2024 Dec 26;26(1):32. doi: 10.1007/s10522-024-10173-z. Biogerontology. 2024. PMID: 39725742 Review.
-
A signaling network map of Lipoxin (LXA4): an anti-inflammatory molecule.Inflamm Res. 2024 Jul;73(7):1099-1106. doi: 10.1007/s00011-024-01885-6. Epub 2024 Apr 26. Inflamm Res. 2024. PMID: 38668877 Review.
References
LinkOut - more resources
Full Text Sources
Research Materials