. 2022 Jun 1;128(11):2119-2125.
doi: 10.1002/cncr.34157. Epub 2022 Mar 21.

A national quality improvement study identifying and addressing cancer screening deficits due to the COVID-19 pandemic

Affiliations

A national quality improvement study identifying and addressing cancer screening deficits due to the COVID-19 pandemic

Rachel H Joung et al. Cancer. .

Abstract

Background: Cancer-related deaths over the next decade are expected to increase due to cancer screening deficits associated with the coronavirus disease 2019 (COVID-19) pandemic. Although national deficits have been quantified, a structured response to identifying and addressing local deficits has not been widely available. The objectives of this report are to share preliminary data on monthly screening deficits in breast, colorectal, lung, and cervical cancers across diverse settings and to provide online materials from a national quality improvement (QI) study to help other institutions to address local screening deficits.

Methods: This prospective, national QI study on Return-to-Screening enrolled 748 accredited cancer programs in the United States from April through June 2021. Local prepandemic and pandemic monthly screening test volumes (MTVs) were used to calculate the relative percent change in MTV to describe the monthly screening gap.

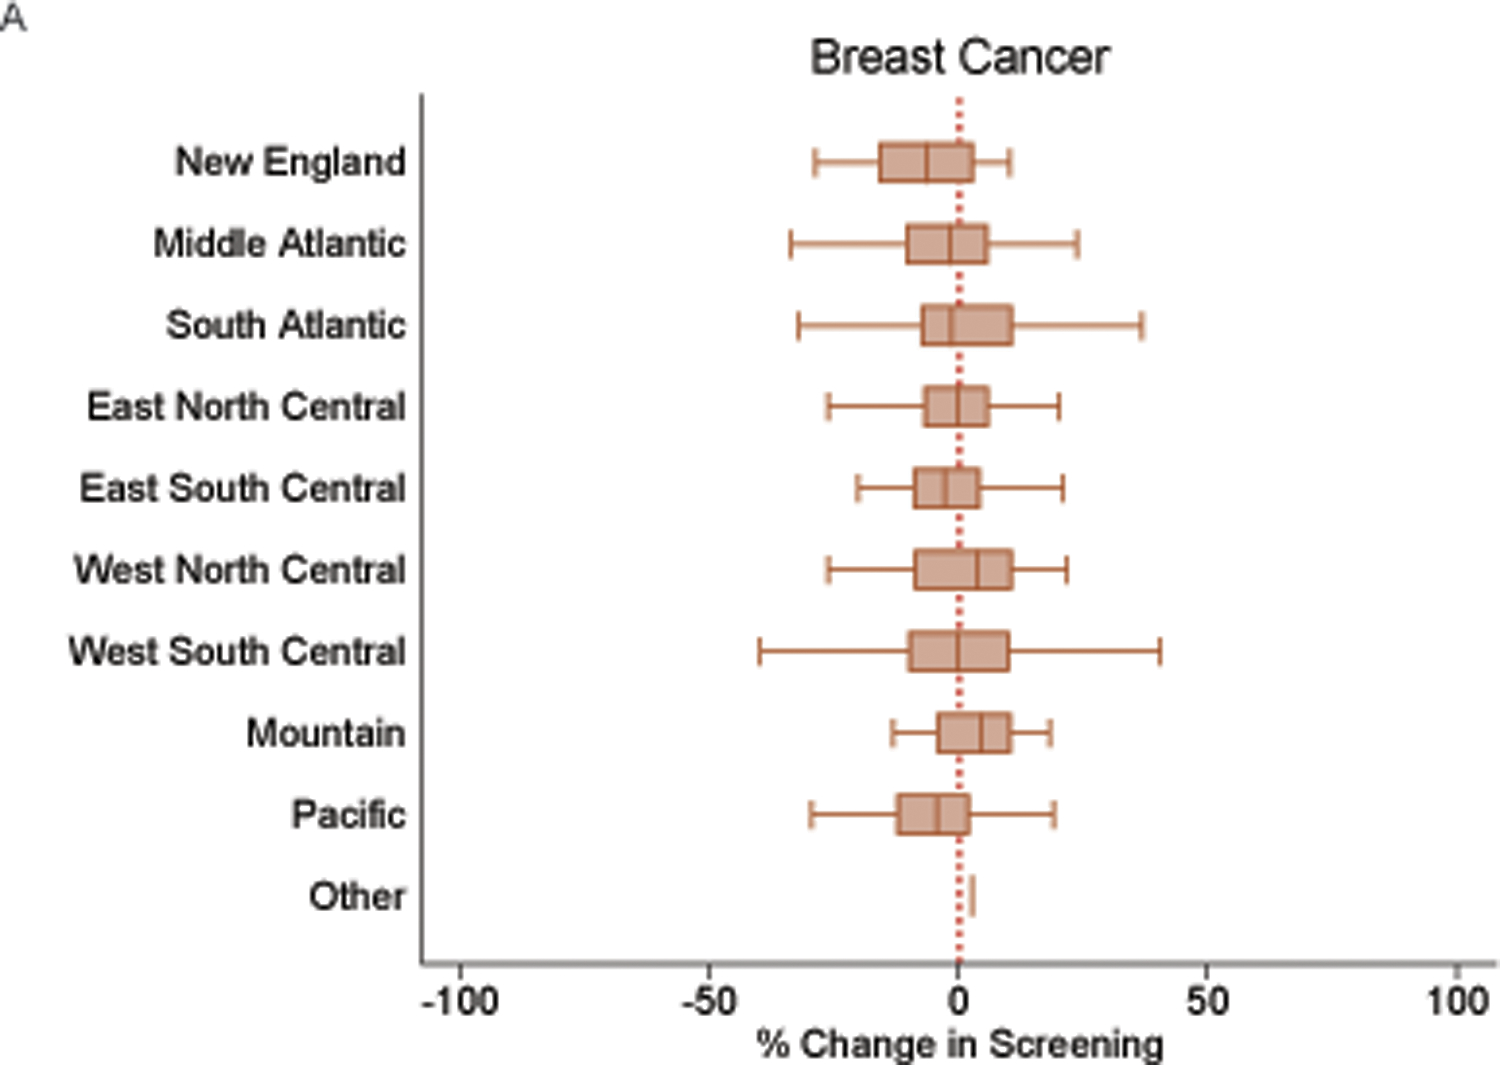
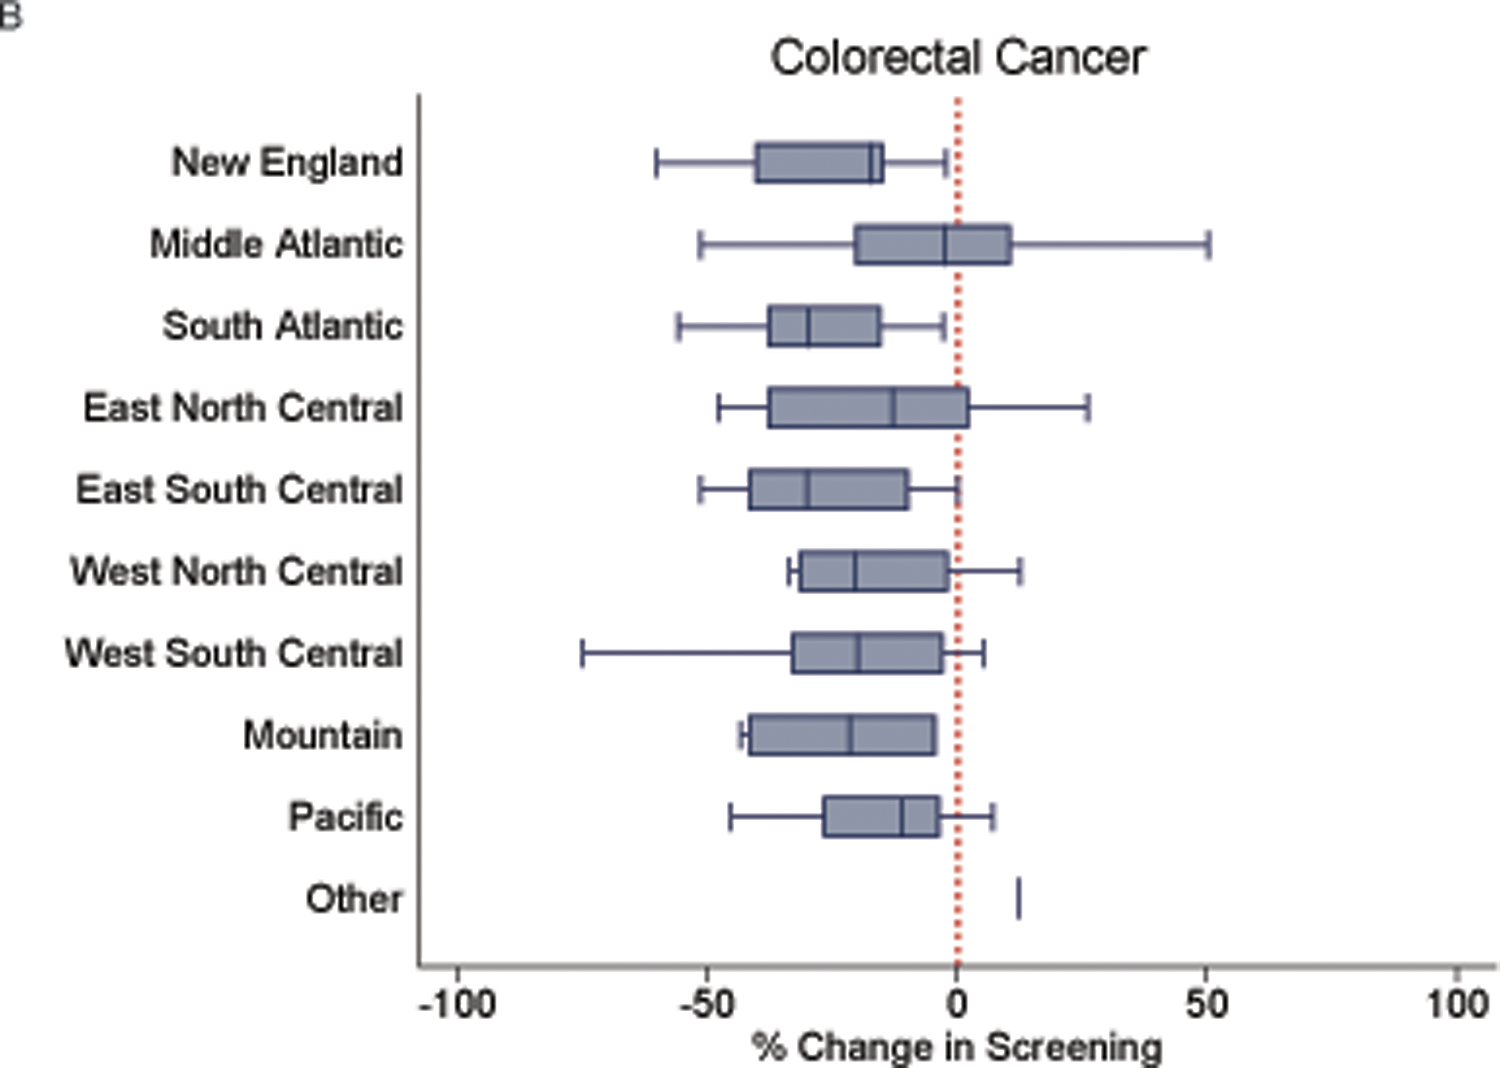
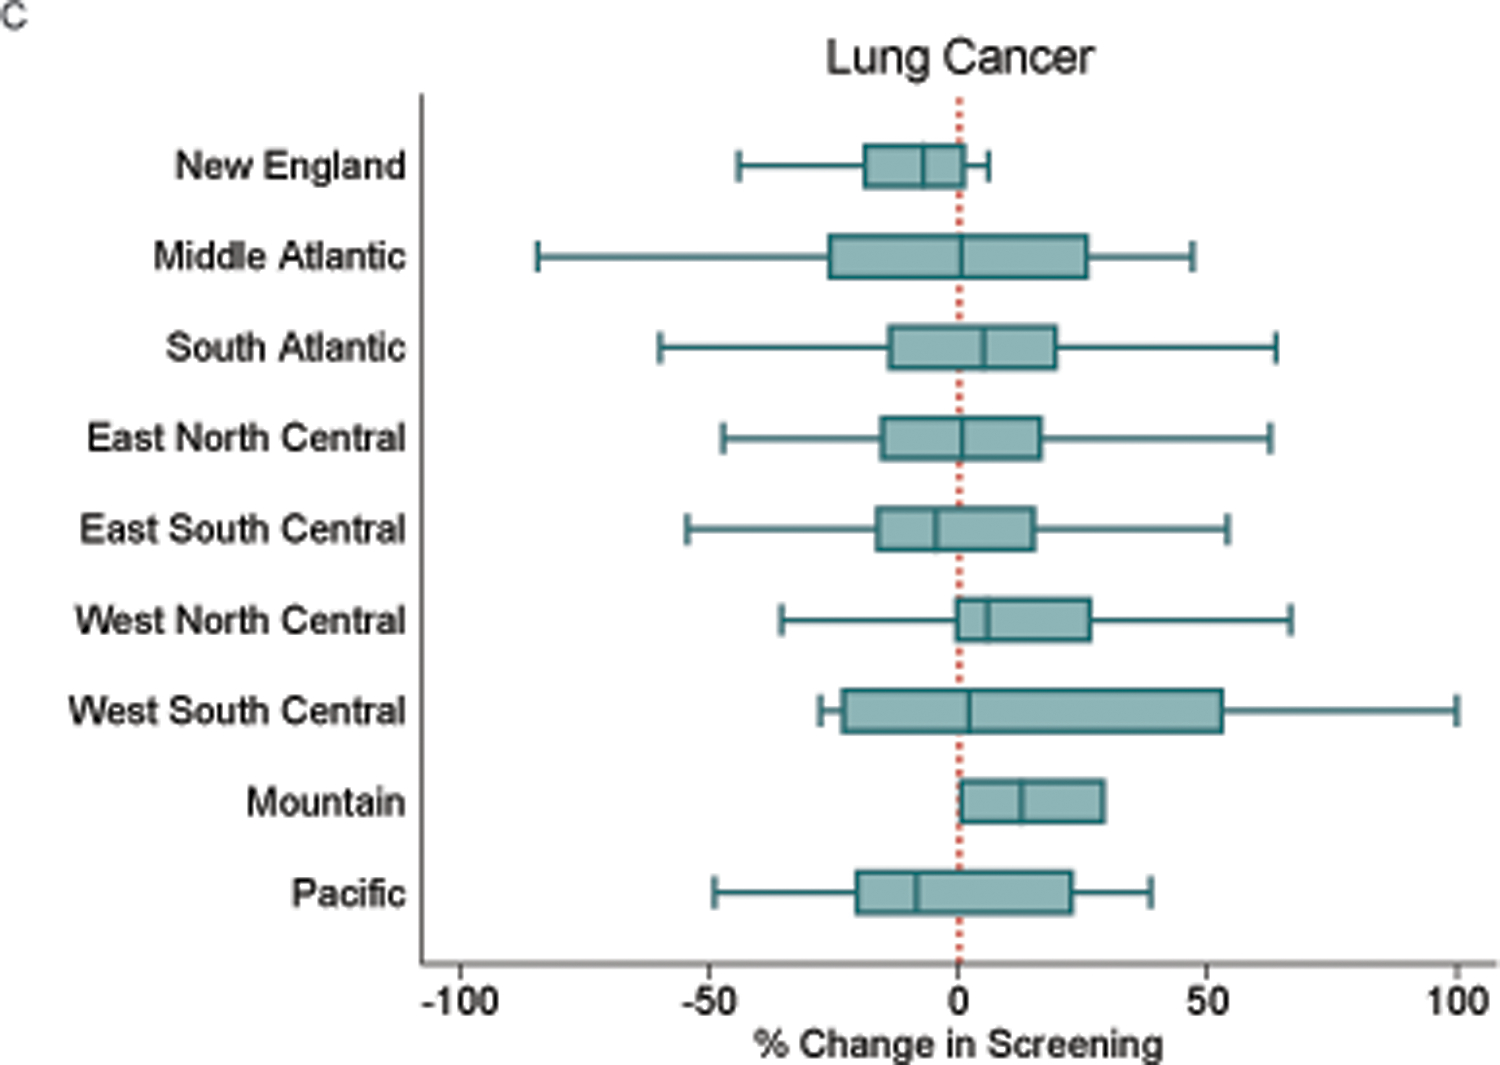
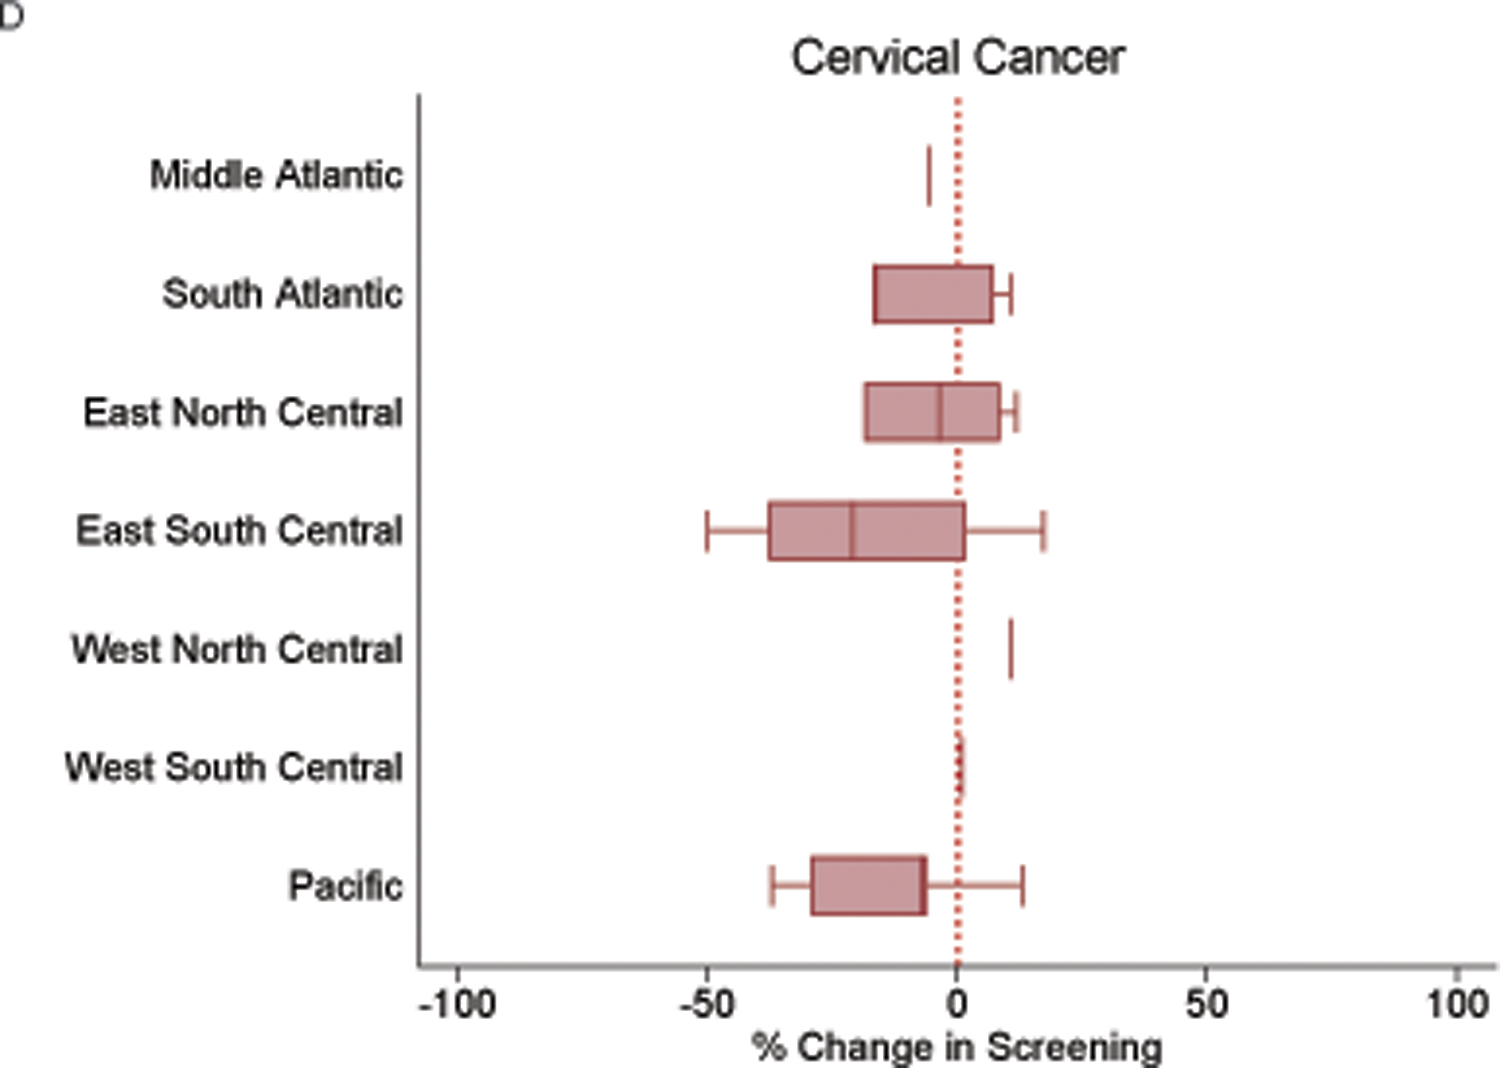
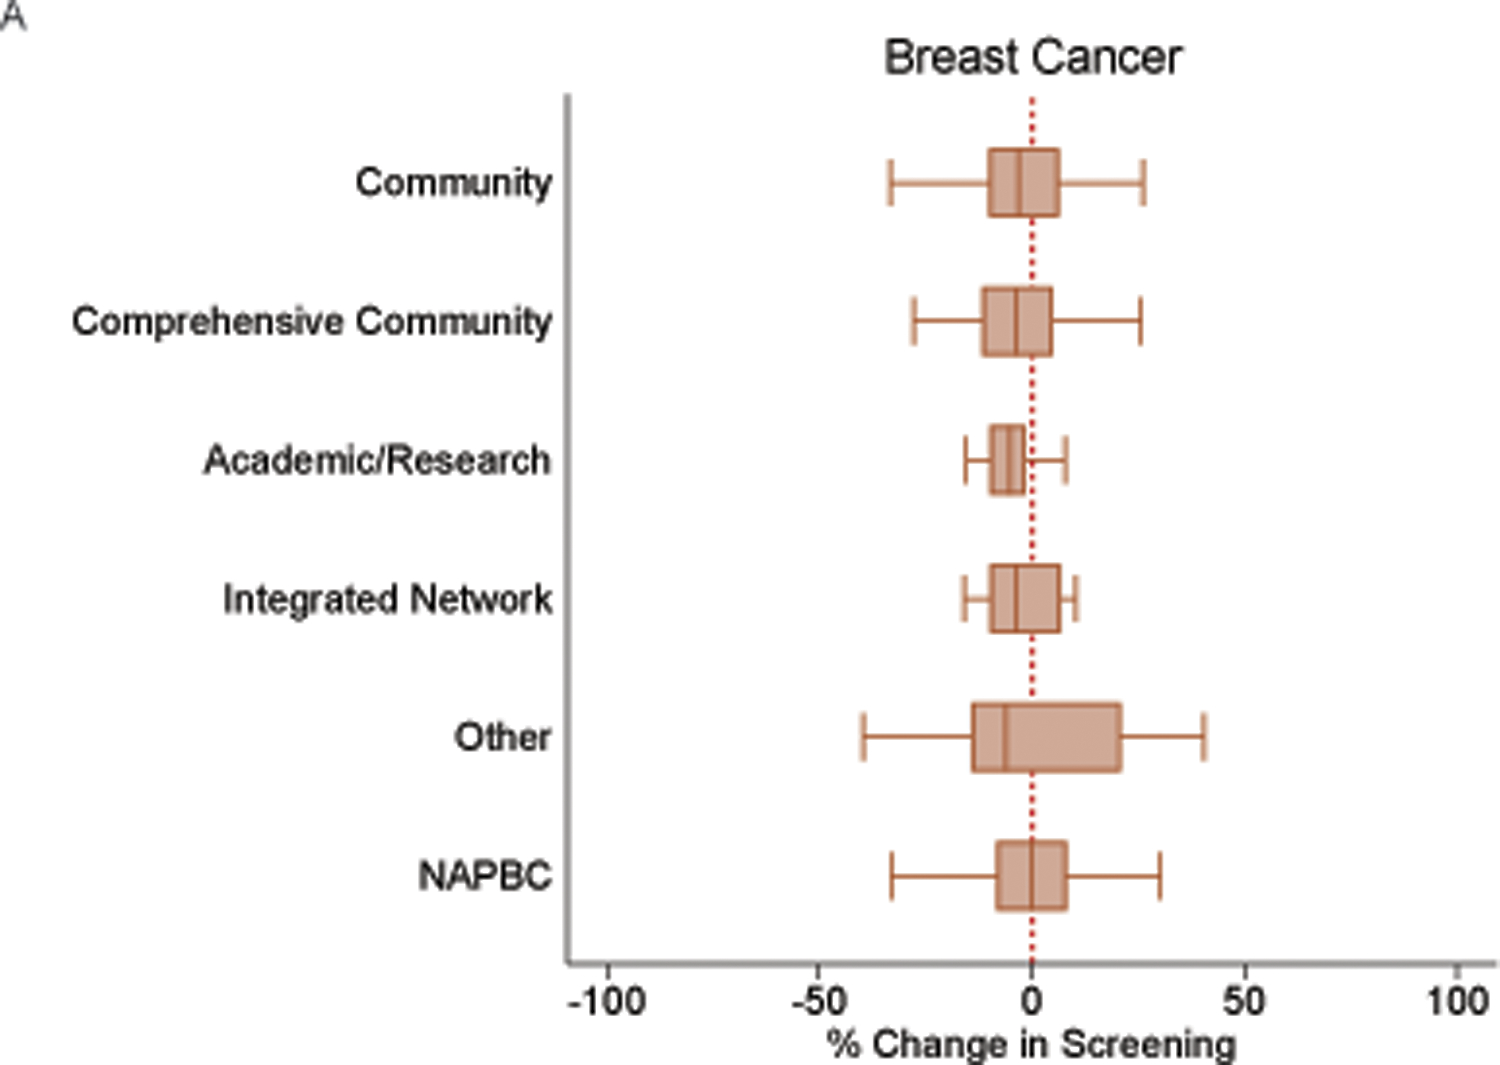
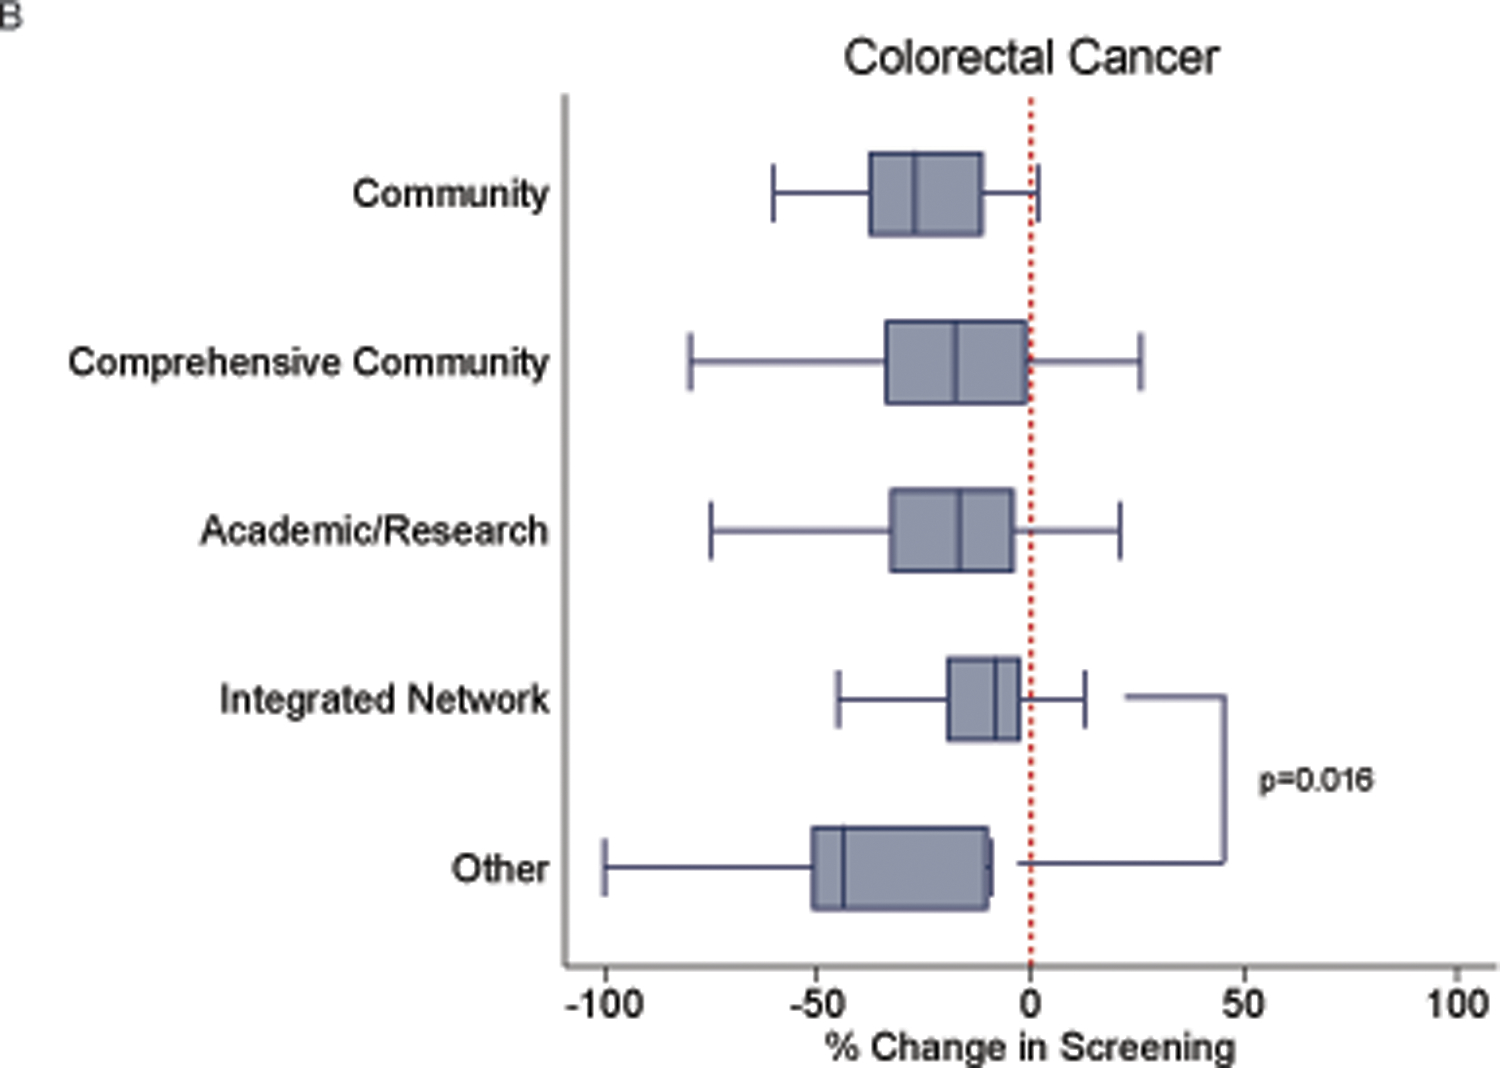
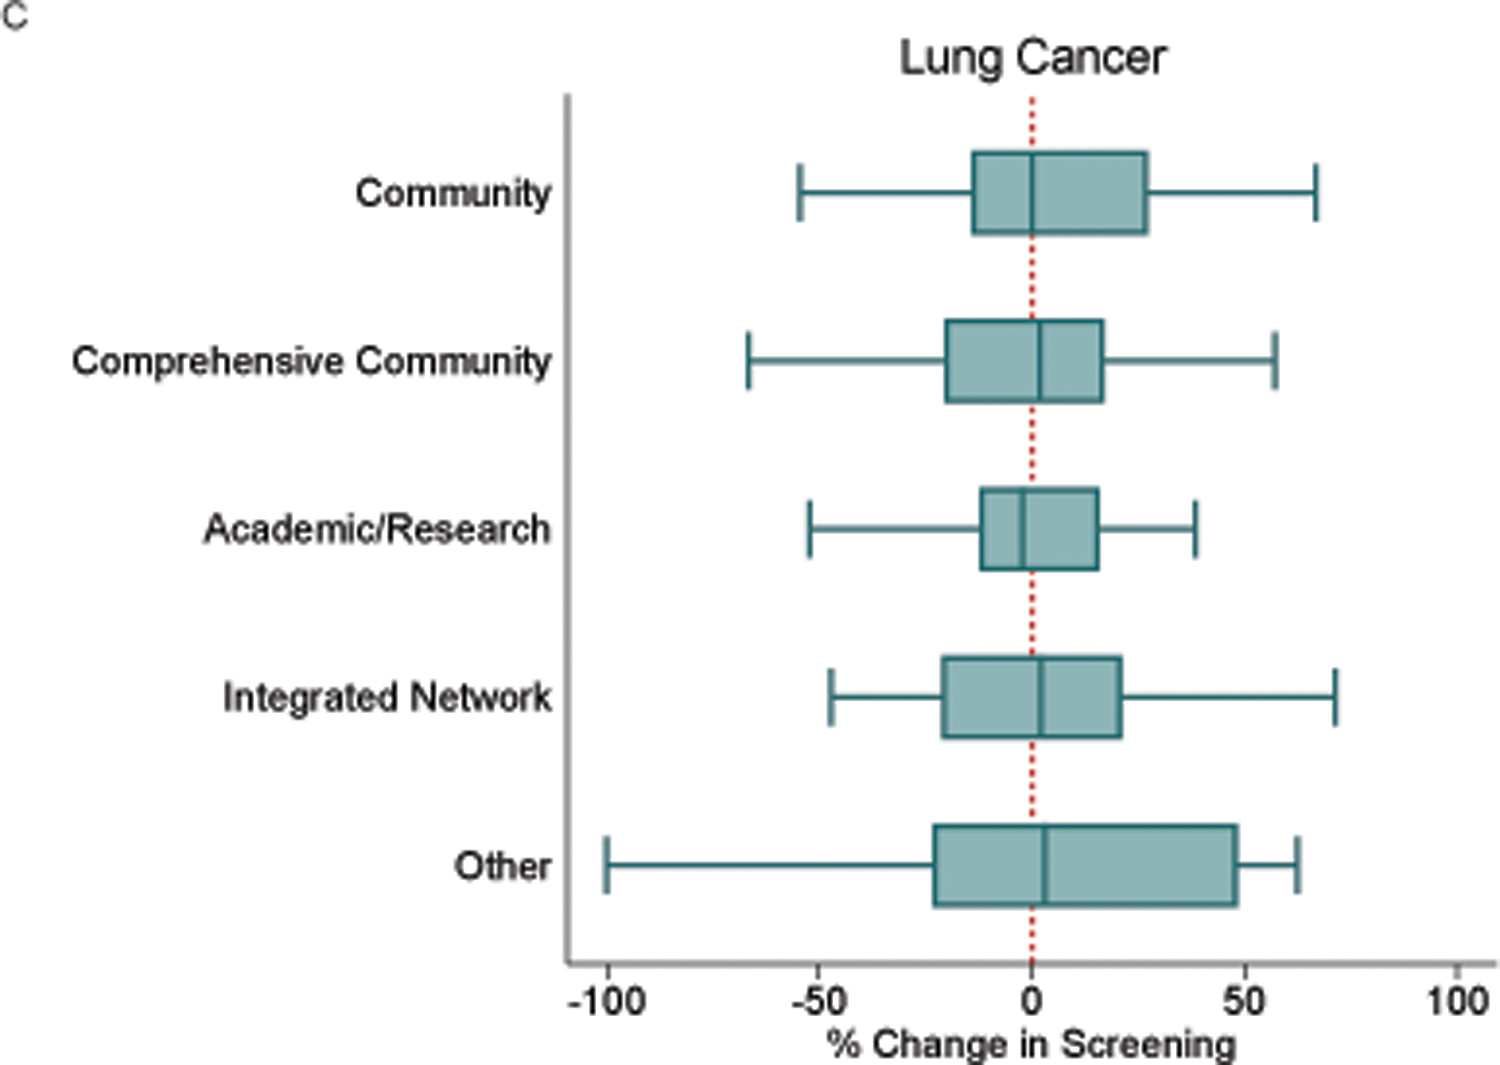
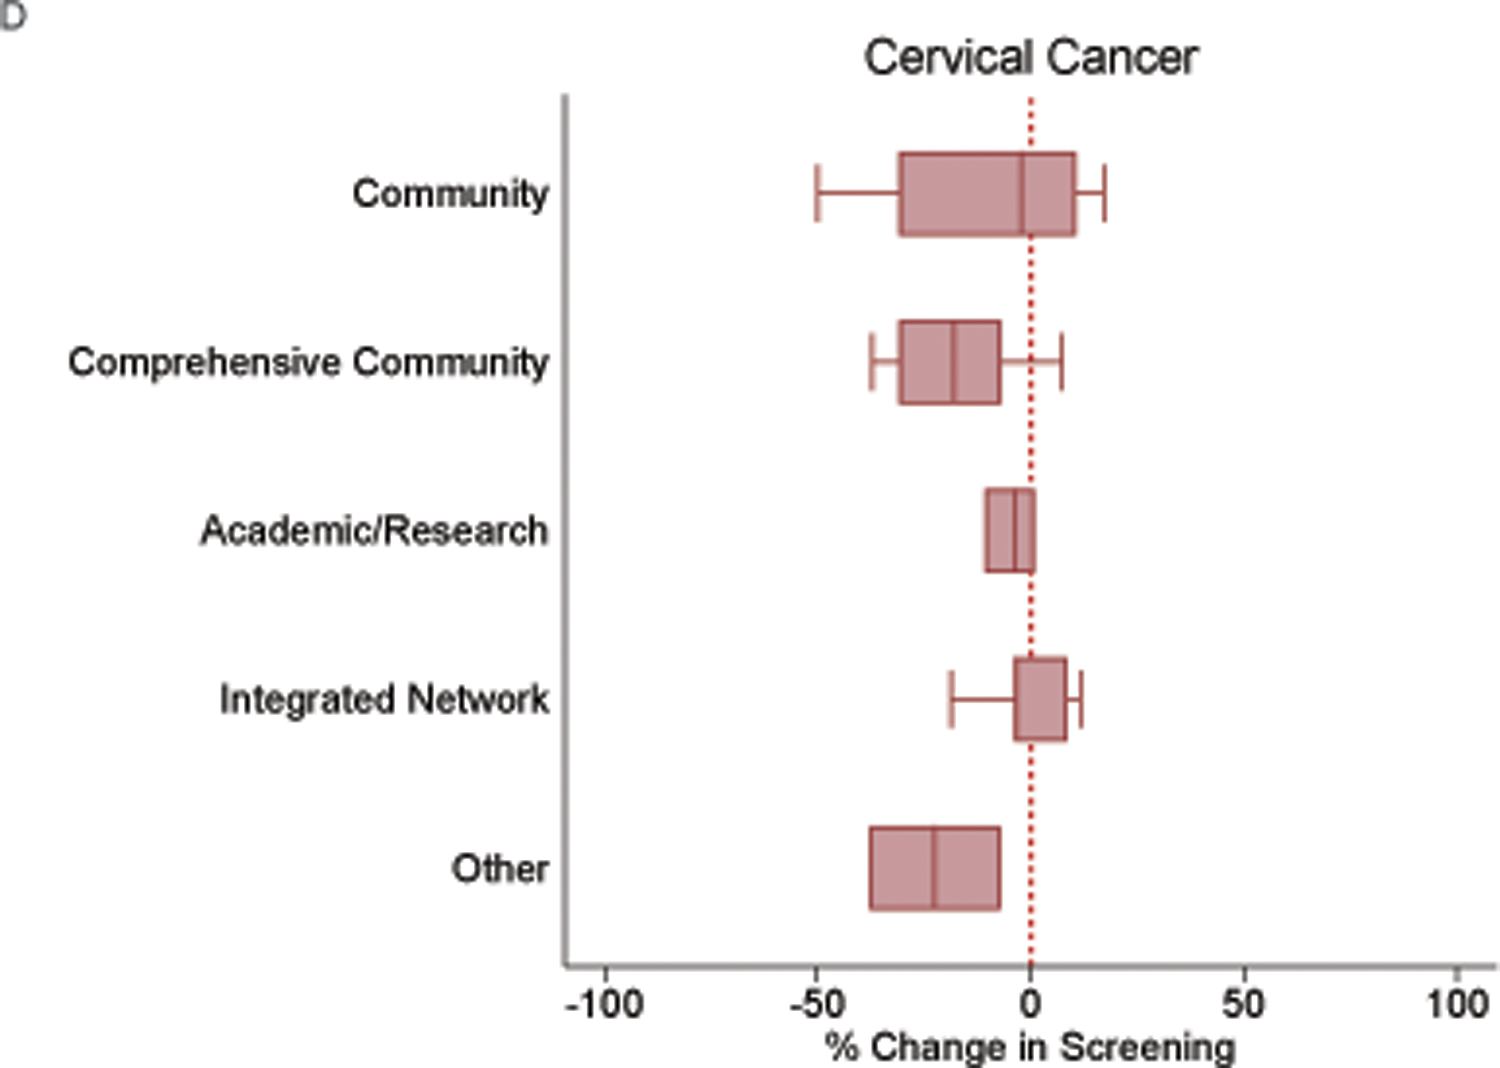
Results: The majority of facilities reported monthly screening deficits (colorectal cancer, 80.6% [n = 104/129]; cervical cancer, 69.0% [n = 20/29]; breast cancer, 55.3% [n = 241/436]; lung cancer, 44.6% [n = 98/220]). Overall, the median relative percent change in MTV ranged from -17.7% for colorectal cancer (interquartile range [IQR], -33.6% to -2.8%), -6.8% for cervical cancer (IQR, -29.4% to 1.7%), -1.6% for breast cancer (IQR, -9.6% to 7.0%), and 1.2% for lung cancer (IQR, -16.9% to 19.0%). Geographic differences were not observed. There were statistically significant differences in the percent change in MTV between institution types for colorectal cancer screening (P = .02).

Conclusion: Cancer screening is still in need of urgent attention, and the screening resources made available online may help facilities to close critical gaps and address screenings missed in 2020.

Lay summary: Question: How can the effects of the coronavirus disease 2019 pandemic on cancer screening be mitigated?

Findings: When national resources were provided, including methods to calculate local screening deficits, 748 cancer programs promptly enrolled in a national Return-to-Screening study, and the majority identified local screening deficits, most notably in colorectal cancer. Using these results, 814 quality improvement projects were initiated with the potential to add 70,000 screening tests in 2021. Meaning: Cancer screening is still in need of urgent attention, and the online resources that we provide may help to close critical screening deficits.

Keywords: breast cancer screening; cancer screening and prevention; cervical cancer screening; colorectal cancer screening; coronavirus disease 2019 (COVID-19) pandemic; lung cancer screening; quality improvement; screening deficits; screening disparities.


Conflict of interest statement

Conflict of Interest Disclosures: Sarah Shafir and William G. Cance are employed by the American Cancer Society, which receives grants from private and corporate foundations, including foundations associated with companies in the health sector, for research outside the submitted work. Sarah Shafir serves as the principal investigator for two cooperative agreements between the American Cancer Society and the Centers for Disease Control and Prevention—the Provision of Technical Assistance and Training Activities to Assure Comprehensive Cancer Control Outcomes and the Strengthening Public Health Systems and Services through National Partnerships to Improve and Protect the Nation’s Health. The remaining authors declare no conflicts of interest.

Figures

Figure 1.
Figure 1.. Relative Percent Change (%) in Monthly Screening Test Volume (MTV) by Facility Location and Disease Site
Relative percent change in MTV across various geographic regions. Negative indicates screening deficit, positive indicates screening excess. Boxes encompass the 25–75th percentile. Whiskers are ± 1.5 IQR. No statistically significant differences between facility locations were identified for any of the four disease sites (a) Breast, (b) Colorectal, (c) Lung, (d) Cervical
Figure 2.
Figure 2.. Relative Percent Change (%) in Monthly Screening Test Volume (MTV) by Type of Institution and by Disease Site
Relative percent change in MTV across types of institutions (calculated as described in Figure1). Boxes encompass the 25–75th percentile. Whiskers are ± 1.5 IQR. Statistically significant difference in the percent change in colorectal cancer screening tests between integrated network programs (median, −8.2%; IQR, −19.8% to −2.3%) compared to other programs (median, −43.8%; IQR, −51.3% to −10.0%), p=.02. (a) Breast, (b) Colorectal, (c) Lung, (d) Cervical

References

    1. Chen RC, Haynes K, Du S, Barron J, Katz AJ. Association of Cancer Screening Deficit in the United States With the COVID-19 Pandemic. JAMA Oncol 2021;7(6):878–884. - PMC - PubMed
    1. Sharpless NE. COVID-19 and cancer. Science 2020;368(6497):1290–1290. - PubMed
    1. ACS Guidance on Cancer Screening During COVID-19 https://www.acs4ccc.org/acs-guidance-on-cancer-screening-during-covid-19/. Accessed 07/14/2021
    1. Return to Cancer Screening Plan-Do-Study-Act Quality Improvement Project Protocol https://www.facs.org/-/media/files/quality-programs/cancer/return-to-scr.... Accessed 07/30/2021.
    1. CPSTF Findings for Cancer Prevention and Control https://www.thecommunityguide.org/content/task-force-findings-cancer-pre.... Accessed 12/13/2021.

Publication types