

Multi-level predictors of depression symptoms in the Adolescent Brain Cognitive Development (ABCD) study
- PMID: 35307818
- PMCID: PMC9489813
- DOI: 10.1111/jcpp.13608
Multi-level predictors of depression symptoms in the Adolescent Brain Cognitive Development (ABCD) study
Abstract
Background: While identifying risk factors for adolescent depression is critical for early prevention and intervention, most studies have sought to understand the role of isolated factors rather than across a broad set of factors. Here, we sought to examine multi-level factors that maximize the prediction of depression symptoms in US children participating in the Adolescent Brain and Cognitive Development (ABCD) study.
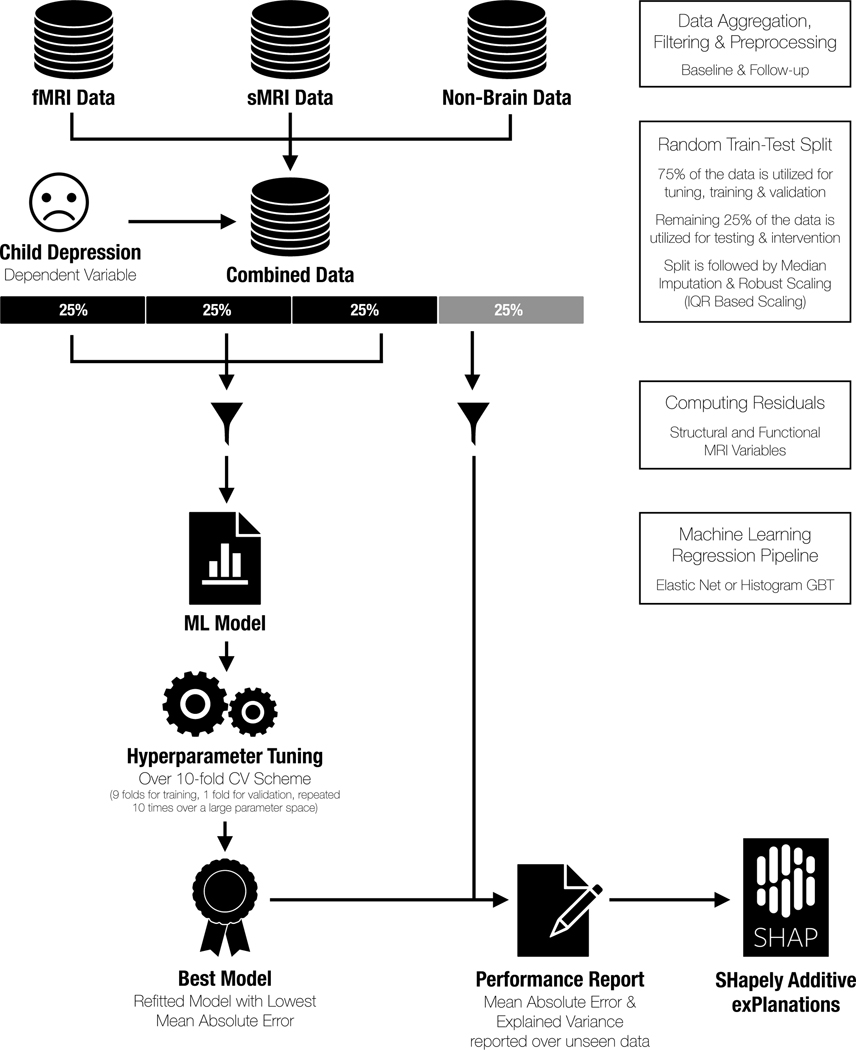
Methods: A total of 7,995 participants from ABCD (version 3.0 release) provided complete data at baseline and 1-year follow-up data. Depression symptoms were measured with the Child Behavior Checklist. Predictive features included child demographic, environmental, and structural and resting-state fMRI variables, parental depression history and demographic characteristics. We used linear (elastic net regression, EN) and non-linear (gradient-boosted trees, GBT) predictive models to identify which set of features maximized prediction of depression symptoms at baseline and, separately, at 1-year follow-up.
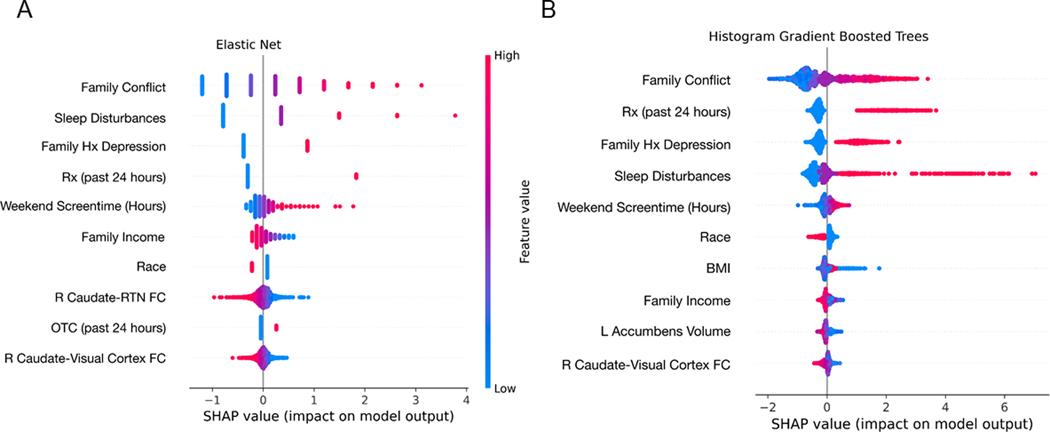
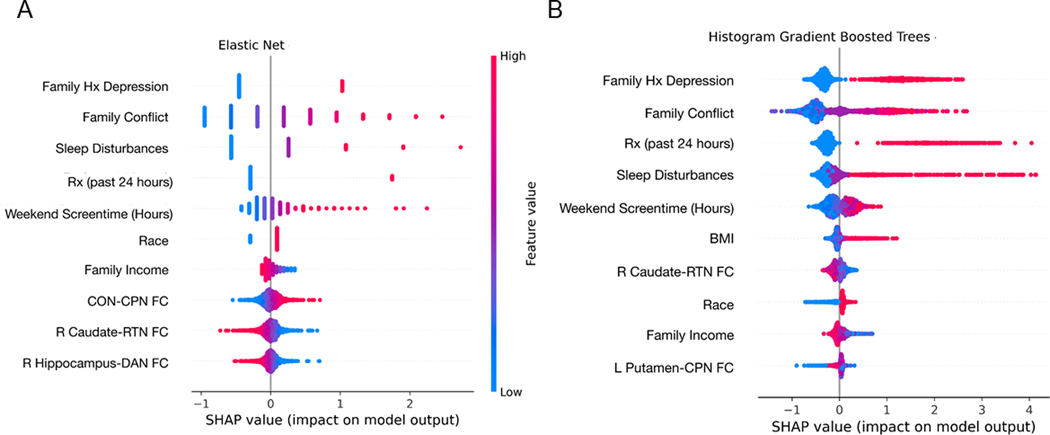
Results: Both linear and non-linear models achieved comparable results for predicting baseline (EN: MAE = 3.757; R2 = 0.156; GBT: MAE = 3.761; R2 = 0.147) and 1-year follow-up (EN: MAE = 4.255; R2 = 0.103; GBT: MAE = 4.262; R2 = 0.089) depression. Parental history of depression, greater family conflict, and shorter child sleep duration were among the top predictors of concurrent and future child depression symptoms across both models. Although resting-state fMRI features were relatively weaker predictors, functional connectivity of the caudate was consistently the strongest neural feature associated with depression symptoms at both timepoints.
Conclusions: Consistent with prior research, parental mental health, family environment, and child sleep quality are important risk factors for youth depression. Functional connectivity of the caudate is a relatively weaker predictor of depression symptoms but may represent a biomarker for depression risk.
Keywords: ABCD Study; Adolescence; depression; functional MRI (fMRI); sleep.
© 2022 Association for Child and Adolescent Mental Health.
Conflict of interest statement
Figures
References
-
- Organization WH: Depression and other common mental disorders: global health estimates. World Health Organisation. World Heal Organ; 2017;
-
- Lewinsohn PM, Allen NB, Seeley JR, et al. : First onset versus recurrence of depression: Differential processes of psychosocial risk. J Abnorm Psychol 1999; - PubMed
-
- Balázs J, Miklõsi M, Keresztény Á, et al. : Adolescent subthreshold-depression and anxiety: Psychopathology, functional impairment and increased suicide risk. J Child Psychol Psychiatry Allied Discip 2013; - PubMed
Publication types
MeSH terms
Grants and funding
- DA-041123/GF/NIH HHS/United States
- U01 DA051039/DA/NIDA NIH HHS/United States
- U01 DA041120/DA/NIDA NIH HHS/United States
- DA-041148/GF/NIH HHS/United States
- U01 DA041093/DA/NIDA NIH HHS/United States
- DA-041147/GF/NIH HHS/United States
- U24 DA041123/DA/NIDA NIH HHS/United States
- DA-041025/GF/NIH HHS/United States
- U01 DA041117/DA/NIDA NIH HHS/United States
- U01 DA041148/DA/NIDA NIH HHS/United States
- DA-041174/GF/NIH HHS/United States
- DA-051037/GF/NIH HHS/United States
- U24 DA041147/DA/NIDA NIH HHS/United States
- DA-051039/GF/NIH HHS/United States
- DA-041022/GF/NIH HHS/United States
- DA-041134/GF/NIH HHS/United States
- U01 DA051018/DA/NIDA NIH HHS/United States
- P50 NS022343/NS/NINDS NIH HHS/United States
- U01 DA051038/DA/NIDA NIH HHS/United States
- DA-050987/GF/NIH HHS/United States
- F31AA027169/AA/NIAAA NIH HHS/United States
- U01 DA041134/DA/NIDA NIH HHS/United States
- U01 DA041022/DA/NIDA NIH HHS/United States
- K01MH117442/MH/NIMH NIH HHS/United States
- U01 DA041156/DA/NIDA NIH HHS/United States
- U01 DA050987/DA/NIDA NIH HHS/United States
- U01 DA051037/DA/NIDA NIH HHS/United States
- DA-050988/GF/NIH HHS/United States
- U01 DA051016/DA/NIDA NIH HHS/United States
- DA-041106/GF/NIH HHS/United States
- U01 DA041025/DA/NIDA NIH HHS/United States
- DA-041117/GF/NIH HHS/United States
- U01 DA050989/DA/NIDA NIH HHS/United States
- DA-041093/GF/NIH HHS/United States
- DA-041156/GF/NIH HHS/United States
- DA-041048/GF/NIH HHS/United States
- DA-051018/GF/NIH HHS/United States
- U01 DA041089/DA/NIDA NIH HHS/United States
- DA-051038/GF/NIH HHS/United States
- U01 DA050988/DA/NIDA NIH HHS/United States
- DA-051016/GF/NIH HHS/United States
- U01 DA041106/DA/NIDA NIH HHS/United States
- U01 DA041028/DA/NIDA NIH HHS/United States
- U01 DA041048/DA/NIDA NIH HHS/United States
- DA-050989/GF/NIH HHS/United States
- DA-041028/GF/NIH HHS/United States
- DA-041120/GF/NIH HHS/United States
- K01 MH117442/MH/NIMH NIH HHS/United States
- U01 DA041174/DA/NIDA NIH HHS/United States
- DA-041089/GF/NIH HHS/United States
- F31 AA027169/AA/NIAAA NIH HHS/United States
LinkOut - more resources
Full Text Sources
Medical
Research Materials
